HIGHLIGHTED ARTICLE
| INVESTIGATION
Linkage Disequilibrium Estimation in Low Coverage
High-Throughput Sequencing Data
Timothy P. Bilton,1John C. McEwan, Shannon M. Clarke, Rudiger Brauning, Tracey C. van Stijn,
Suzanne J. Rowe, and Ken G. Dodds AgResearch, Invermay Agricultural Centre, Mosgiel 9053, New Zealand ORCID IDs: 0000-0001-5945-3766 (T.P.B.); 0000-0003-4801-6207 (J.C.M.); 0000-0002-4615-8917 (S.M.C.); 0000-0001-5068-9166 (R.B.); 0000-0002-9347-6379 (K.G.D.)
ABSTRACTHigh-throughput sequencing methods that multiplex a large number of individuals have provided a cost-effective approach for discovering genome-wide genetic variation in large populations. These sequencing methods are increasingly being utilized in population genetic studies across a diverse range of species. Two side-effects of these methods, however, are (1) sequencing errors and (2) heterozygous genotypes called as homozygous due to only one allele at a particular locus being sequenced, which occurs when the sequencing depth is insufficient. Both of these errors have a profound effect on the estimation of linkage disequilibrium (LD) and, if not taken into account, lead to inaccurate estimates. We developed a new likelihood method, GUS-LD, to estimate pairwise linkage disequilibrium using low coverage sequencing data that accounts for undercalled heterozygous genotypes and sequencing errors. Our findings show that accurate estimates were obtained using GUS-LD, whereas underestimation of LD results if no adjustment is made for the errors.
KEYWORDSgenotyping-by-sequencing; linkage disequilibrium; maximum likelihood; allelic dropout; low coverage
L
INKAGE disequilibrium (LD) is the term given to thenonrandom association of alleles located at different loci in a population. Quantifying the level of LD, or estimating the pairwise LD between all loci in a population, is of interest to many researchers as it has many important applications. For example, in association mapping studies, LD is used to identify candidate regions of the genome associated with a particular trait or disease, and can providefiner resolution in mapping compared to linkage-based studies (Devlin and Risch 1995; Jorde 1995; Xiong and Guo 1997; Mackay and Powell 2007). LD is affected by many genetic and evolutionary forces, such as recombination, admixture, migration, selection, and gene
flow among others (Terwilligeret al.1998; Ardlieet al.2002; Gaut and Long 2003; Slatkin 2008). Consequently, LD pat-terns can be used to quantify genetic diversity and make inferences about the evolutionary history of natural popula-tions (Nordborg and Tavaré 2002; Slatkin 2008; Zhu et al.
2015). In addition, the relationship between map distance and the level of LD can be used to estimate the effective population size (Sved 1971; Hill 1981; Hayes et al. 2003; Waples 2006; Svedet al.2013).
Today, many species are being sequenced using high-throughput sequencing methods that multiplex a large num-ber of individuals. Some of the most popular sequencing methods are whole genome sequencing, and reduced repre-sentation approaches such as genotyping-by-sequencing (Elshireet al.2011), whole-exome sequencing (Hodgeset al.
2007), and restriction-site associated DNA (Bairdet al.2008). These sequencing methods provide a low-cost approach to performing genome-wide genotyping and discovery of single nucleotide polymorphisms (SNPs) that does not require prior genomic information. As a result, they have been applied in a plethora of plant, aquaculture, and animal species, and have become the method of choice for many species, particularly for nonmodel organisms (Andrewset al.2016; Kimet al.2016;
Copyright © 2018 Biltonet al.
doi:https://doi.org/10.1534/genetics.118.300831
Manuscript received February 16, 2018; accepted for publication March 22, 2018; published Early Online March 26, 2018.
Available freely online through the author-supported open access option.
This is an open-access article distributed under the terms of the Creative Commons Attribution 4.0 International License (http://creativecommons.org/licenses/by/4.0/), which permits unrestricted use, distribution, and reproduction in any medium, provided the original work is properly cited.
Supplemental material available at Figshare:https://doi.org/10.25386/genetics. 6007730
Chunget al.2017; Li and Wang 2017; Robledoet al.2017). Genetic data generated using high-throughput sequencing methods are increasingly being used to compute pairwise LD estimates (e.g., Hohenlohe et al. 2012; Wang et al. 2013; Huanget al.2014; Nimmakayalaet al.2014; Xuet al.2014; Fèet al.2015; Zhanget al.2015; Covarrubias-Pazaranet al.
2016; Van Wyngaardenet al.2016; Gur et al.2017; Sieber
et al.2017; Favilleet al.2018).
A major disadvantage with high-throughput sequencing methods is that one or both of the alleles at a particular locus may be missed for a given individual if the sequencing depth is low. If neither allele is seen, a missing genotype results while if only one of the two parental alleles is seen (possibly multiple times), a heterozygous genotype may be called as homozy-gous (Doddset al.2015; Fragosoet al.2016). The latter case is also known as allelic dropout, and is particularly problem-atic as genotype calls with this type of missingness behave like genotyping errors, which have a profound impact on the estimation of LD even when the error rates are low (Akey
et al.2001). An additional complication of sequencing data are the presence of sequencing errors, bases which have been miscalled, which also impact on estimation of genetic quan-tities such as recombination fractions (Biltonet al.2018).
One way of removing genotyping errors resulting from low sequencing depth is to set genotype calls with an associated read depth below some threshold value to missing. However, suchfiltering results in fewer individuals and SNPs for a given sequencing cost (Doddset al.2015), and, for low coverage data, may result in insufficient data to undertake the analysis. LD is often estimated using haplotypes phased from genotype data via various software packages and algorithms such as BEAGLE (Browning and Browning 2007), fastPHASE (Scheet
and Stephens 2006), MaCH (Li et al. 2010), and FILLIN
(Swartset al.2014). However, all of these approaches require that the chromosomal order of the loci is known in order to infer haplotypes, which is not necessarily the case for reduced representation sequencing data, particularly if SNPs are called
de novo. Furthermore, many species that are genotyped using sequencing methods are highly polymorphic and have low LD levels, where phasing in such species can be problematic (Bukowickiet al.2016). A few alternative approaches for es-timating LD from high-throughput sequencing data have been presented in the literature. Federet al.(2012) proposed esti-mating pairwise LD using reads that cover both loci while estimating the allele frequencies using all the reads. This ap-proach, however, is not applicable to short-read sequencing data (e.g., genotyping-by-sequencing) where most of the reads do not cover both sites. Alternatively, it restricts the analysis to loci that are very close, which may not be that useful. Maruki and Lynch (2014) presented a likelihood method for estimat-ing the disequilibrium coefficient in situations where there is a combination of reads that intersect both loci or only one of the two loci. Their method accounts for sequencing errors but requires that additional erroneous alleles are called in the alignment process, whereas most variant callers by default only allow for two alleles to be called at a SNP.
We present a new method for estimating pairwise LD using low coverage sequencing data, without requiring haplotype phasing, a known chromosomal order orfiltering with regard to read depth. In essence, our method is based on the likeli-hood method by Hill (1974), which estimates LD using ge-notypic data in random mating populations, but is extended to account for errors resulting from undercalled heterozy-gotes and sequencing errors. Our method removes bias in LD estimation caused by these errors but results in more variable estimates at low depth. We also examine the effect genotyping errors from low read depths and sequencing errors have on the estimation of LD.
Materials and Methods
Estimation of pairwise LD
LetAjandBjdenote the reference and alternate allele at locus
j, respectively, and letpAjandpBjdenote the allele frequency for the reference and alternate alleles at locusj, respectively. The LD coefficient is defined as (Lewontin and Kojima 1960):
D¼pA1A22pA1pA2; (1)
wherepA1A2is the probability of observing a haplotype con-taining the reference allele at both loci. Since probabilities are required to be non-negative, D must satisfy the con-straints (Lewontin 1964):
D$max2pA1pA2;2
12pA1
12pA2
D#min
pA1
12pA2
;pA2
12pA1
: (2)
We letGijdenote the true genotype for individualiat locusj, andGi¼ ðGij;GikÞT denote the true joint genotype for indi-vidualibetween locusjandk, wherej6¼k;i¼1;. . .;nandT
denotes the transpose. We letAAj;ABj;andBBjdenote the reference homozygous genotype, heterozygous genotype, and alternate homozygous genotype at locus j, respec-tively. For two biallelic loci, the nine joint genotypes are ðAA1;AA2ÞT;ðAA1;AB2ÞT;ðAA1;BB2ÞT;ðAB1;AA2ÞT;ðAB1;AB2ÞT; ðAB1;BB2ÞT;ðBB1;AA2ÞT;ðBB1;AB2ÞT;andðBB1;BB2ÞT;which we denote by 1–9, respectively.
In sequencing data, the true genotypes are latent while the observed data consists of the number of reads for the reference and alternate alleles. We denote the number of reads for the reference allele for individualiat locusjbyYij;whereYijis an integer value between 0 and the sequencing depthdij;which is the sum of reference and alternate allele counts at locusjin individuali. By the law of total probability,
PðYiÞ ¼ X9
g¼1
PðYijGi¼gÞPðGi¼gÞ; (3)
PðYiÞ ¼ X9
g¼1 Y2
j¼1
PYijGij¼gjPðGi¼gÞ: (4)
where gj is either AAj,ABj or BBj. The expected true joint genotype probabilities, Pig=PðGi¼gÞ; correspond to those given in Table 1 when the population is in Hardy-Weinberg equilibrium (Hill 1974).
The number of reads for the reference allele, Yij;can be considered as arising from a binomial sample of the two al-leles found in the true genotypeGij:Suppose that the alleles are read at random, and that sequencing errors for a given read are independent between loci, the conditional probabil-ities of the number of reference alleles given the true geno-type are:
P
Yij¼aGij¼AAj
¼ dij
a !
ð12eÞaedij2a
P
Yij¼aGij¼ABj ¼ dij a ! 1 2 dij
PYij¼aGij¼BBj
¼ dij
a !
eað12eÞdij2a;
(5)
where e is the sequencing error rate (Bilton et al. 2018). Assuming that individuals are independent (e.g., unrelated), then the log-likelihood for the number of reference alleles is,
ℓpA1;pA2;D;e
¼X
n
i¼1
lnPðYiÞ: (6)
The maximum likelihood estimate of the disequilibrium co-efficient,D^;using sequencing data are obtained by maximiz-ing the likelihood in Equation (6) subject to the constraint of Equation (2). As no analytical solution exists, maximization of the likelihood is performed using numerical methods. The expectation of the maximum likelihood estimate is (Weir 1996),
EðD^Þ ¼2n21
2n D; (7)
resulting in a small bias, which is removed by multiplyingD^by 2n=ð2n21Þsubject to constraint (2), wherenis taken as the number of individuals with a nonzero read depth at both loci. Since the range of D depends on the allele frequencies, comparing levels of LD between markers can be difficult using the disequilibrium coefficient. Consequently, many alternative measures of LD have been proposed in the literature; see Hedrick (1987) and Devlin and Risch (1995) for a summary and comparison of these measures. In this article, we shall only consider two commonly used measures,D9(Lewontin 1964; Hedrick 1987) and r2 (Hill and Robertson 1968). Although bothD9andr2 are measures of LD, they have different prop-erties and are useful for different applications (see Mueller (2004)). The maximum likelihood estimates for both of these
measures are computed using the functionsD^9¼D^=D^maxand
^
r2¼D^2=ð^pA1ð12^pA1Þ^pA2ð12^pA2ÞÞ;where
^
Dmax¼ min
^
pA1^pA2;
12^pA1
12^pA2
^
D,0
min^pA112^pA2;p^A212^pA1 D^.0;
8 <
: (8)
and^pA1and^pA2are the maximum likelihood estimates of the reference allele frequencies at locus 1 and 2, respectively. We refer to the proposed methodology as genotyping uncertainty with sequencing data-linkage disequilibrium (GUS-LD, pro-nouncedguzzled).
Simulation
To examine the performance of GUS-LD, a simulation study was undertaken. Generation of simulated sequencing data proceeded as follows. For each individual, two haplotypes were sampled from the four possible haplotypes for preset values ofpA1;pA2;andD, and were then converted to geno-type calls. Simulation of sequencing data proceeded byfirst generating a read depth for each individual at each locus by simulating realizations from a Poisson distribution with
mean mkj; where a range of read depths were used
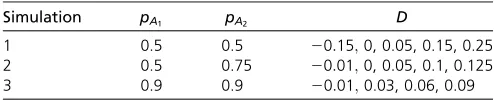
(mkj¼1;2;3;4;5;7:5;10;15). At each locus within each in-dividual, alleles were sampled from the genotype call with equal probability and replacement until a sample size corre-sponding to the read depth was obtained, with a sequencing error (e.g.,Ajbeing called asBjand vice versa) simulated to occur with probabilitye. In some cases, the simulated read depth was zero resulting in a missing genotype. The simula-tions were performed under various combinasimula-tions ofpA1;pA2; andD(see Table 2 for a list of combinations used) and afixed sequencing error rate of 1% (e¼0:01).
Two sets of simulations were performed. The first com-pares estimation of LD using simulated sequencing data be-tween GUS-LD and the standard likelihood procedure of Hill (1974) that assumes accurate genotype calls. For each com-bination of parameters, 10,000 simulated datasets of 100 in-dividuals were generated, where estimates of the bias and standard error (SE) ofD^;D^9;and^r2were computed for both methods. In the second set, the optimal sequencing depth for a given sequencing effort, defined as the number of reads
Table 1 Joint genotype probabilities for two biallelic loci under the assumption of Hardy-Weinberg equilibrium
g Locus 1 Locus 2 Pig
1 AA1 AA2 ðpA1pA2þDÞ2
2 AB2 2ðpA1pA2þDÞðpA1pB22DÞ
3 BB2 ðpA1pB22DÞ2
4 AB1 AA2 2ðpA1pB2þDÞðpB1pA22DÞ 5 AB2 2ðpA1pA2þDÞðpB1pB2þDÞ
þ2ðpA1pB2þDÞðpB1pA22DÞ 6 BB2 2ðpA1pB2þDÞðpB1pB2þDÞ 7 BB1 AA2 ðpB1pA2þDÞ2
8 AB2 2ðpB1pA2þDÞðpB1pB22DÞ
which is the product of the number of individuals, the num-ber of loci, and the mean read depth, is examined. For each combination of parameters, 10,000 datasets were simulated, where the number of individuals in the datasets were set such that an average sequencing effort of 600 reads was main-tained. Estimates of the LD measures were obtained using GUS-LD and the standard approach where the mean square errors ofD^;D^9;and^r2 were computed.
Deer dataset
GUS-LD was also compared to the standard likelihood ap-proach using a dataset consisting of 666 farmed deer and 38 of their sires. The dams were unrecorded red deer (Cervus
elaphus) while the sires were predominantly Wapiti (also
known as Elk; Cervus canadensis), but included some red deer. The animals were managed in accordance with the provisions of the New Zealand Animal Welfare Act 1999, and the Codes of Welfare developed under sections 68279 of the Act. Tissue samples were collected in the form of ear tissue punches and DNA extracted according to Clarkeet al.
(2014). Genotyping was performed using the genotyping-by-sequencing method (Elshireet al.2011) using the restriction enzymePstI and variations of the standard laboratory meth-odology as outlined in Doddset al.(2015). The individuals were sequenced across eight lanes at AgResearch, Invermay, Animal Genomics laboratory on an Illumina HiSeq 2500 v4 chemistry yielding1.34B reads (read length of 13100 bp) in total. SNP variants were called using UNEAK (Lu et al.
2013) as outlined in Doddset al.(2015). For the LD analysis, a set of 38 SNPs that were determined to be close to the microsatellite TGLA94 (Marshallet al.1998), had a minor allele frequency .0.05, and had ,25% missing genotype calls were retained for analysis.
Data availability
Scripts for generating the simulated sequencing data are provided in Supplemental Material, File S1. The deer dataset and an implementation of GUS-LD can be found athttps:// github.com/AgResearch/GUS-LD. Figures S1 and S2 in File S1 gives bias and SE of LD estimates for the second and third simulation scenarios. Figure S3 in File S1 gives the SE of the allele frequency estimates for all the simulations. Figures S4 and S5 in File S1 gives the mean square errors of LD esti-mates for the second and third simulation scenarios. Figure S6 in File S1 gives the mean read depth distribution for the SNPs used in the deer dataset and Figure S7 in File S1 gives the distribution of the sequencing error estimates for the deer analysis. Supplemental material available at Figshare: https://doi.org/10.25386/genetics.6007730.
Results
Simulation
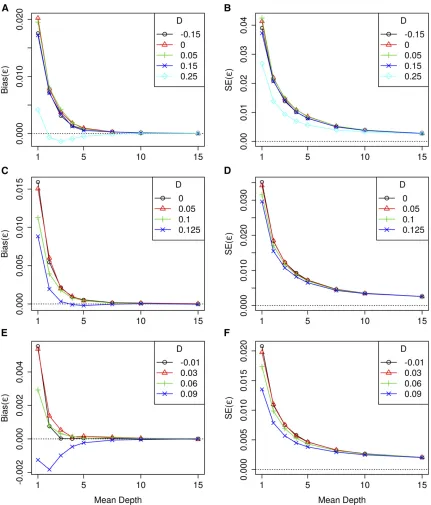
For thefirst set of simulations, the bias of the LD estimates for the various LD measures are given in Figure 1, for
pA1¼0:5;pA2¼0:5 and for a range of values of D. When the average read depth was low, the estimates ofDobtained using the standard likelihood procedure were biased toward zero, where the level of bias increased as the strength of LD increased. In contrast, the estimates computed using GUS-LD were relatively unbiased across the various read depths. Nev-ertheless, for the cases whenDwas close to, or on, its upper or lower bound [Equation (2)],D^ was biased, although the level of bias was much less for GUS-LD than for the standard likelihood procedure. These conclusions, in general, also ap-plied to estimation ofD9andr2;although there was some bias in the estimates of D9even when the read depth was large and the true value of D was not near the upper or lower bound of its parameter space. This bias is due to poor sam-pling properties of D9; and has been observed to occur in simulation studies for small sample sizes (Teareet al.2002; Terwilligeret al.2002). As the average read depth increased, the number of undercalled heterozygous genotypes in the datasets decreased, resulting in less bias for LD estimates obtained from the standard likelihood method. For mean depths .10, the estimates from the standard approach co-incided with GUS-LD when the true LD was small or absent but were still biased when the true LD was large, which is due to the presence of sequencing errors.
Figure 1 also shows the SE of the estimates for the three LD measures computed using the two approaches. In general, the SE of the LD estimates computed under GUS-LD were larger compared with those obtained under the standard likelihood approach, with the difference decreasing as the average read depth increased. This increase in the SE for GUS-LD was expected as there is extra sampling variation introduced into the sequencing data, caused by not all alleles being observed. On the other hand, when the true value ofD
was close to, or on, the lower or upper bound of its parameter space [Equation (2)], GUS-LD tended to yield smaller SE than the standard approach.
The bias and SE of the LD estimates for alternative com-binations of allele frequencies are given in Figure S1 (pA1¼0:5 andpA2¼0:75) and Figure S2 (pA1¼pA2¼0:9) in File S1. The results from these simulations were mostly in agreement with those when pA1¼0:5 and pA2¼0:5: The SE for the allele frequency estimates from GUS-LD and the standard approach for all three sets of parameter values are given in Figure S3 in File S1. Overall, the SE of the allele frequency estimates were fairly similar between the two methods.
The bias and SE of the sequencing error estimates from GUS-LD for thefirst set of simulations is given in Figure 2. At high mean depths, these estimates were unbiased across all the different combinations of parameter values, whereas for low mean read depths the estimates were generally biased
Table 2 Combinations of parameters used in the simulations
Simulation pA1 pA2 D
1 0.5 0.5 20:15;0, 0.05, 0.15, 0.25
2 0.5 0.75 20:01;0, 0.05, 0.1, 0.125
upwards, with the bias increasing as the mean depth de-creased. The SE of the sequencing error estimates were also smallest at higher mean depths, and increased as the mean depth decreased.
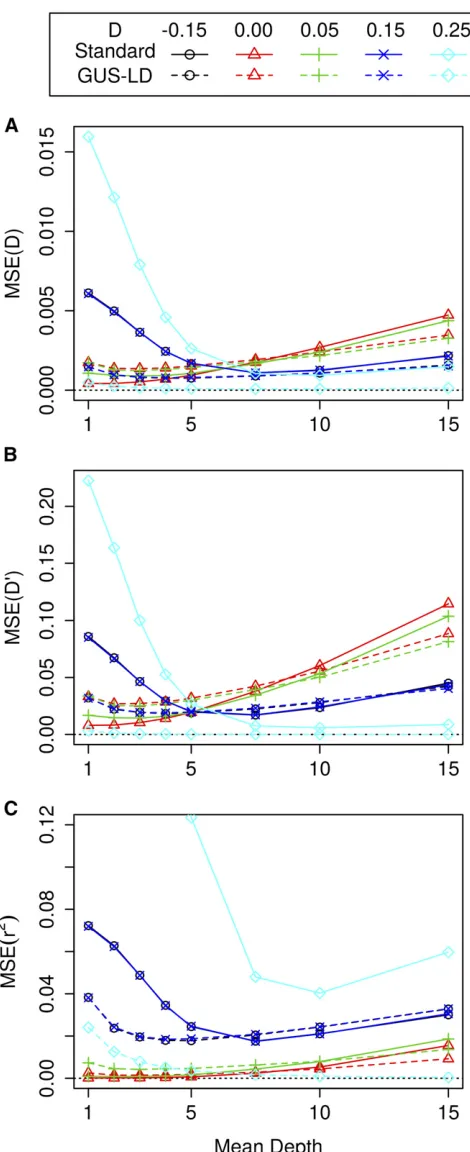
For the second set of simulations, the mean square error (MSE) of the LD estimates for the various pairwise LD mea-sures are given in Figure 3, where the sequencing effort was
fixed at 600 reads,pA1¼pA2¼0:5;e¼0:01 and a range of
values ofDwere used. The MSE for GUS-LD was lower than the standard approach when the true LD was large or near its maximum value. Compared to GUS-LD, the standard ap-proach gave lower MSE at low depths when the true LD was small, which was due to the LD estimates having a small bias and smaller SE compared to GUS-LD. On the other hand, the presence of sequencing errors results in the standard approach having higher MSE at high depths compared to
Figure 1 Bias of the LD estimates forD(A),D9(C), andr2(E), and SE of the LD estimates forD(B),D9(D), andr2(F) whenp
GUS-LD. The MSE for GUS-LD was smallest between mean depths of 2 and 5, where the actual depth at which the min-imum occurred depended on the true value ofDand the LD measure. The MSE is larger at higher read depths for GUS-LD as the increase in variability from having fewer individuals in the data sets was larger than the decrease in variability from having high read depths. There was one exception to this trend that occurred when the true value ofD was equal to its upper bound (D¼0:25) for all the LD measures. In this
case, the MSE was largest at smaller mean read depths and decreased as the mean read depth increased. This is due to the fact that there is no variation or bias when the genotypes are accurate for values ofDthat are on their upper or lower bound, but there is variation when there is uncertainty in the genotype calls associated with low read depths.
The MSE of the LD estimates for alternative combinations of allele frequencies when the sequencing effort wasfixed are given in Figure S4 (pA1¼0:5 andpA2¼0:75) and Figure S5
(pA1¼pA2¼0:9)in File S1. The results from these simula-tions were very similar to the case when pA1¼pA2¼0:5; although there were some differences. For example, the MSE across all the mean depths forDwas larger as the true value ofDincreased whenpA1¼pA2¼0:9;whereas the re-verse was true when pA1¼pA2¼0:5;and when pA1¼0:5 andpA2¼0:75:Also, forpA1¼0:5 andpA2¼0:75;the MSE for the LD measure r2 did not decrease as the read depth increased when the true value ofDwas on its upper boundary (D¼0:125), as for the other parameter combinations. This was due to unequal allele frequencies meaning that the esti-mates ofr2were not near its upper bound of 1. These differ-ences were due to the complex sampling properties of the various LD measures. Nevertheless, the optimal sequencing depth was mostly between 2 and 5 across all scenarios and LD measures.
Deer dataset
The LD estimates between all pairs among a set of 38 SNPs are given in Figure 4 for the absolute value ofD9and Figure 5 for
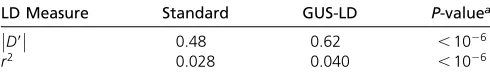
r2: For the former LD measure, a number of pairwise esti-mates computed using GUS-LD were larger compared to the estimates obtained from the standard likelihood ap-proach, which is seen by the greater intensity of red across the heatmap in Figure 4B compared to Figure 4A. Similarly, there were some pairwise estimates of r2 that were larger under GUS-LD (Figure 5B) compared to the standard likeli-hood approach (Figure 5A), which is seen by the fact that some of the yellow squares in Figure 5A appear more orange in Figure 5B. The average value of all the pairwise estimates for the two LD measures was larger under GUS-LD than the standard likelihood approach (Table 3). Compared to the simulation results, the difference in the LD estimates between the two approaches was not particularly large. This was due to a number of SNPs having high mean read depths (Figure S6 in File S1). Nevertheless, theP-values from a Wilcoxon signed-rank test comparing the mean LD estimated from GUS-LD and the standard approach were very small (Table 3), giving strong evidence that the mean estimated level of LD from GUS-LD was significantly larger than from the stan-dard approach. The distribution of the sequencing error esti-mates obtained from GUS-LD for all SNP pairs is given in Figure S7 in File S1, where the mean estimate was 0.14%.
Discussion
The introduction of high-throughput sequencing methods that multiplex a large number of individuals is driving forward research into many species, particularly nonmodel species, and is increasingly being utilized by many researchers. How-ever, analyzing sequencing data using existing analytical tools and methods may, in some cases, be impractical or lead to erroneous results due to the added complexity and nuances of the data compared to other genetic data types. Consequently, the development of new methodological tools for analyzing sequencing data are needed, although the progress of such
Figure 3 MSE of the LD estimates forD(A),D9(B), andr2(C) for afixed
tools has been slow compared to the sequencing technology (Gardneret al.2014).
Our simulation results have demonstrated that genotyping errors associated with undercalled heterozygotes (e.g., allelic dropout), and miscalled bases leads to underestimation of LD when these errors are not taken into account. This is impor-tant, as biased estimates of LD can have a profound effect on downstream analyses. For example, in case-control associa-tion studies, it has been shown using simulaassocia-tions that the presence of genotyping errors leads to reduced power in detecting an association between a locus and phenotype (Gordon and Ott 2001; Gordonet al.2002). Russell and Few-ster (2009) have also shown via simulations that allelic dropout results in positively biased estimates of effective population size when calculated using LD information. This problem is exacerbated for low coverage data as the rate of genotyping errors is much higher than those used in these simulations studies. We have developed a new method, called GUS-LD, that accounts for errors associated with undercalled heterozygotes and miscalled bases in the estima-tion of LD. Our results show that GUS-LD was able to greatly reduce bias in LD estimates at low sequencing depth, al-though the variability of these estimates were larger com-pared to the standard approach at low depths, which reflects the additional variation introduced into the data by
uncertainty over whether both alleles or only one allele were seen. This additional variation will affect downstream analyses such that there will be less power to detect causal variates in association studies, more variable estimates of effective pop-ulation size and less precision in assessing genome quality. However, this can be counteracted by sampling more individ-uals, since this can be more efficient than sampling fewer individuals at high depth as suggested by our simulations re-sults and by Maruki and Lynch (2014). The simulations also show that GUS-LD was able to reduce bias in LD estimates caused by sequencing errors, especially at high depths when the true LD was moderate to large.
The sequencing error parameter,e, in GUS-LD is specified in terms of a miscalled base for a given read, which differs from the tradition specification that is in terms of a miscalled allele in a genotype call. As a consequence, GUS-LD estimates the sequencing error rate from information provided by the allele counts for the reference and alternate alleles. In addi-tion, a smaller sequencing error rate under the alternative specification can affect more genotypes calls than under the traditional specification for the same value ofe, especially if there are many reads associated with each genotype call. This means that the estimate ofefrom GUS-LD is likely to differ from sequencing errors rates generally quoted in the litera-ture. For the deer data set, the mean sequencing error rate for
Figure 4 Heatmaps of the absolute value of the pairwise estimates forD9between all 38 SNPs in the deer dataset using (A) the standard likelihood approach, which does not account for undercalled heterozygous genotypes or sequencing errors, and (B) GUS-LD.
Figure 5Heatmaps of the pairwise estimates forr2
a given read was estimated at 0.14%, which is of similar magnitude to the rate estimated by Biltonet al.(2018) in a linkage context for genotyping-by-sequencing data. Simula-tion results suggest that GUS-LD accurately estimates the sequencing error rate at high depths, but the estimates be-come biased as the mean depth decreases. This bias is likely due to the inability to distinguish between sequencing errors and true reads at very low depths. Nevertheless, GUS-LD still provided accurate LD estimates, even when the sequencing error estimates themselves were biased.
With low coverage sequencing data, there are issues with estimating LD when the true parameter value lies near or on the upper or lower bound of its parameter space [Equation (2)]. Specifically, the bias in the LD estimates increases asD
approaches its upper or lower bound. This is even the case for GUS-LD, which adjusts for genotyping errors associated with low read depths, although the bias is significantly less than the standard likelihood approach. This bias is caused by sam-pling variation resulting in the maximum of the likelihood in Equation (6) lying outside the parameter space ofD, whereas maximization is performed with respect to the constraint of Equation (2). When genotype calls are accurate and without error, this bias, in estimatingDwhen its true value is near its upper or lower bound, is absent.
There are many potential applications of using pairwise LD estimates from GUS-LD. For example, they could be used for quantifying the extent of LD decay in populations relative to physical distance from an assembly or genetic distance computed from a linkage analysis. This should prove a popular application since there are numerous studies already using sequencing data for this purpose in a number of species (e.g., Huanget al.2014; Nimmakayalaet al.2014; Fèet al.
2015; Guret al.2017; Sieberet al.2017), including one by Favilleet al.(2018), which utilized GUS-LD. LD estimates from GUS-LD can also be used in conjunction with the method of Sved (1971) to estimate historic effective popu-lation size, or the method of Waples (2006) to estimate contemporary effective population size. Another application is assessing the quality of an assembly (e.g., Pernaciet al.
2014) or ordering scaffolds, such as in the Locus Ordering by Dis-Equilibrium procedure (Khatkar et al. 2010). This application of LD is perhaps less well known but is particularly useful for sequencing data, since assemblies are often frag-mented or not existent, and has already been used in a study by Tennessenet al.(2017). One powerful application is com-bining LD estimates from GUS-LD with the software package
LDna (Kemppainenet al.2015) to explore genome-wide LD and investigate the evolutionary forces acting on a popula-tion. The advantage of combining these two approaches is that no reference genome is required, meaning that it is ap-plicable to any species and so will prove valuable for non-model species.
For the methodology developed in this paper, a number of assumptions have been made. First, genotype calls observed in the sequencing data are assumed to be conditionally inde-pendent between loci given the true genotype call. This assumption is reasonable provided that loci are not located on the same sequencing read across individuals. Estimation of LD is unaffected by the presence of genotyping errors resulting from low read depth when the loci are located on the same read as the true underlying haplotypes in the individuals are preserved. Depending on their settings, many variant callers allow for multiple SNPs to be called on the same sequencing read. However, it is more practical to only retain a single SNP from a given read as the loss of information is minimal and is outweighed by the reduced computational time. Other as-sumptions include that missing genotypes resulting from read depths of zero occur randomly, and that the alleles of the true genotypes are sampled randomly in the sequencing process. If the latter assumption does not hold, one allele will be sampled more frequently than the other (e.g., preferential sampling). In this case, the proportion of heterozygotes seen as homo-zygotes will be larger than expected under the model, which would result in some bias in the LD estimates at low sequenc-ing depth. If additional information is available, then the probabilities in Equation (5) can be adjusted to reflect alter-native sampling models. Lastly, it is assumed that sequencing errors occur independently between reads. In reality, this assumption may not hold, although it has been found to be reasonable in some scenarios (Biltonet al.2018).
The main contributions of this paper are twofold. First, we have demonstrated that there can be significant bias in LD estimates from sequencing data when the read depth is low and the associated errors are not taken into account. This highlights the need for practitioners to either remove these errors byfiltering or adjust their methodology to account for these errors. This is particularly important as some LD anal-yses give no explicit mention of a minimum cut-off with respect to read depth being used. Second, we have proposed GUS-LD as a new method to estimate LD using low-coverage sequencing data. GUS-LD will prove valuable to researchers seeking to undertake population studies when cost constraints prohibit the production of high-coverage sequencing data or other types of genetic data. In fact, our simulation results suggest that it is more cost-efficient to use low coverage data, as it allows more individuals to be sequenced for the same cost and results in smaller mean square errors for the LD estimates. From our results, the optimal sequencing depth was between 2 and 5, which was similar to the optimal read depth observed by Doddset al.(2015) in the context of relatedness estima-tion. GUS-LD also allows LD estimation using loci with a mixture of high and low mean read depths, which is
Table 3 Average LD estimate across all pairs of SNPs for the deer dataset
LD Measure Standard GUS-LD P-valuea
D9 0.48 0.62 ,1026
r2 0.028 0.040 ,1026
aP-value from a Wilcoxon signed-rank test comparing the mean level of LD
particularly useful as the sequencing depth typically varies substantially between SNPs.
Acknowledgments
We thank Landcorp Farming Limited for use of their data, and two anonymous referees for their helpful comments. This work was funded by FarmIQ (Ministry for Primary In-dustries’Primary Growth Partnership fund)—FIQ Systems— Plate to Pasture (PGP06-09020) and the Ministry of Business, Innovation and Employment (New Zealand), Contract C10X1306,“Genomics for Production & Security in a Biological Economy”to AgResearch Ltd.
Literature Cited
Akey, J. M., K. Zhang, M. Xiong, P. Doris, and L. Jin, 2001 The effect that genotyping errors have on the robustness of common linkage-disequilibrium measures. Am. J. Hum. Genet. 68: 1447– 1456.https://doi.org/10.1086/320607
Andrews, K. R., J. M. Good, M. R. Miller, G. Luikart, and P. A. Hohenlohe, 2016 Harnessing the power of RADseq for ecolog-ical and evolutionary genomics. Nat. Rev. Genet. 17: 81–92. https://doi.org/10.1038/nrg.2015.28
Ardlie, K. G., L. Kruglyak, and M. Seielstad, 2002 Patterns of linkage disequilibrium in the human genome. Nat. Rev. Genet. 3: 299–309.https://doi.org/10.1038/nrg777
Baird, N. A., P. D. Etter, T. S. Atwood, M. C. Currey, A. L. Shiver
et al., 2008 Rapid SNP discovery and genetic mapping using sequenced RAD markers. PLoS One 3: e3376.https://doi.org/ 10.1371/journal.pone.0003376
Bilton, T. P., M. R. Schofield, M. A. Black, D. Chagné, P. L. Wilcox
et al., 2018 Accounting for errors in low coverage high-throughput sequencing data when constructing genetic maps using biparental outcrossed populations. Genetics @@@. DOI: https://doi.org/10.1534/genetics.117.300627
Browning, S. R., and B. L. Browning, 2007 Rapid and accurate haplotype phasing and missing-data inference for whole-genome association studies by use of localized haplotype clus-tering. Am. J. Hum. Genet. 81: 1084–1097. https://doi.org/ 10.1086/521987
Bukowicki, M., S. U. Franssen, and C. Schlötterer, 2016 High rates of phasing errors in highly polymorphic species with low levels of linkage disequilibrium. Mol. Ecol. Resour. 16: 874–882. https://doi.org/10.1111/1755-0998.12516
Chung, Y. S., S. C. Choi, T.-H. Jun, and C. Kim, 2017 Genotyping-by-sequencing: a promising tool for plant genetics research and breeding. Hortic. Environ. Biotechnol. 58: 425–431.https://doi. org/10.1007/s13580-017-0297-8
Clarke, S. M., H. M. Henry, K. G. Dodds, T. W. D. Jowett, T. R. Manleyet al., 2014 A high throughput single nucleotide poly-morphism multiplex assay for parentage assignment in New Zealand sheep. PLoS One 9: e93392.https://doi.org/10.1371/ journal.pone.0093392
Covarrubias-Pazaran, G., L. Diaz-Garcia, B. Schlautman, J. Deutsch, W. Salazaret al., 2016 Exploiting genotyping by sequenc-ing to characterize the genomic structure of the American cranberry through high-density linkage mapping. BMC
Genomics 17: 451.
https://doi.org/10.1186/s12864-016-2802-3
Devlin, B., and N. Risch, 1995 A comparison of linkage disequi-librium measures for fine-scale mapping. Genomics 29: 311– 322.https://doi.org/10.1006/geno.1995.9003
Dodds, K. G., J. C. McEwan, R. Brauning, R. M. Anderson, T. C. van Stijn et al., 2015 Construction of relatedness matrices using genotyping-by-sequencing data. BMC Genomics 16: 1047. https://doi.org/10.1186/s12864-015-2252-3
Elshire, R. J., J. C. Glaubitz, Q. Sun, J. A. Poland, K. Kawamoto
et al., 2011 A robust, simple genotyping-by-sequencing (GBS) approach for high diversity species. PLoS One 6: e19379. https://doi.org/10.1371/journal.pone.0019379
Faville, M. J., S. Ganesh, M. Cao, M. Z. Z. Jahufer, T. P. Biltonet al., 2018 Predictive ability of genomic selection models in a multi-population perennial ryegrass training set using genotyping-by-sequencing. Theor. Appl. Genet. 131: 703–720.https://doi.org/ 10.1007/s00122-017-3030-1
Fè, D., F. Cericola, S. Byrne, I. Lenk, B. H. Ashraf et al., 2015 Genomic dissection and prediction of heading date in perennial ryegrass. BMC Genomics 16: 921. https://doi.org/ 10.1186/s12864-015-2163-3
Feder, A. F., D. A. Petrov, and A. O. Bergland, 2012 LDx: estima-tion of linkage disequilibrium from high-throughput pooled
re-sequencing data. PLoS One 7: e48588. https://doi.org/
10.1371/journal.pone.0048588
Fragoso, C. A., C. Heffelfinger, H. Zhao, and S. L. Dellaporta, 2016 Imputing genotypes in biallelic populations from low-coverage sequence data. Genetics 202: 487–495. https://doi. org/10.1534/genetics.115.182071
Gardner, K. M., P. Brown, T. F. Cooke, S. Cann, F. Costa et al., 2014 Fast and cost-effective genetic mapping in apple using next-generation sequencing. G3 (Bethesda) 4: 1681–1687. https://doi.org/10.1534/g3.114.011023
Gaut, B. S., and A. D. Long, 2003 The lowdown on linkage dis-equilibrium. Plant Cell 15: 1502–1506. https://doi.org/ 10.1105/tpc.150730
Gordon, D., and J. Ott, 2001 Assessment and management of
single nucleotide polymorphism genotype errors in genetic as-sociation analysis. Pac. Symp. Biocomput. 6: 18–29.
Gordon, D., S. J. Finch, M. Nothnagel, and J. Ott, 2002 Power and sample size calculations for case-control genetic association tests when errors are present: application to single nucleotide
polymorphisms. Hum. Hered. 54: 22–33. https://doi.org/
10.1159/000066696
Gur, A., G. Tzuri, A. Meir, U. Sa’ar, V. Portnoyet al., 2017 Genome-wide linkage-disequilibrium mapping to the candidate gene level in melon (Cucumis melo). Sci. Rep. 7: 9770.https://doi. org/10.1038/s41598-017-09987-4
Hayes, B. J., P. M. Visscher, H. C. McPartlan, and M. E. Goddard, 2003 Novel multilocus measure of linkage disequilibrium to estimate past effective population size. Genome Res. 13: 635– 643.https://doi.org/10.1101/gr.387103
Hedrick, P. W., 1987 Gametic disequilibrium measures: proceed with caution. Genetics 117: 331–341.
Hill, W. G., 1974 Estimation of linkage disequilibrium in ran-domly mating populations. Heredity 33: 229–239.https://doi. org/10.1038/hdy.1974.89
Hill, W. G., 1981 Estimation of effective population size from data on linkage disequilibrium. Genet. Res. 38: 209–216.https://doi. org/10.1017/S0016672300020553
Hill, W. G., and A. Robertson, 1968 Linkage disequilibrium in finite populations. Theor. Appl. Genet. 38: 226–231. https:// doi.org/10.1007/BF01245622
Hodges, E., Z. Xuan, V. Balija, M. Kramer, M. N. Molla et al., 2007 Genome-wide in situ exon capture for selective resequencing. Nat. Genet. 39: 1522–1527.https://doi.org/10.1038/ng.2007.42 Hohenlohe, P. A., S. Bassham, M. Currey, and W. A. Cresko,
Huang, Y.-F., J. A. Poland, C. P. Wight, E. W. Jackson, and N. A. Tinker, 2014 Using genotyping-by-sequencing (GBS) for geno-mic discovery in cultivated oat. PLoS One 9: e102448.https:// doi.org/10.1371/journal.pone.0102448
Jorde, L. B., 1995 Linkage disequilibrium as a gene-mapping tool. Am. J. Hum. Genet. 56: 11–14.
Kemppainen, P., C. G. Knight, D. K. Sarma, T. Hlaing, A. Prakash
et al., 2015 Linkage disequilibrium network analysis (LDna) gives a global view of chromosomal inversions, local adaptation and geographic structure. Mol. Ecol. Resour. 15: 1031–1045. https://doi.org/10.1111/1755-0998.12369
Khatkar, M. S., M. Hobbs, M. Neuditschko, J. Sölkner, F. W. Nicholas
et al., 2010 Assignment of chromosomal locations for unas-signed SNPs/scaffolds based on pair-wise linkage disequilib-rium estimates. BMC Bioinformatics 11: 171.https://doi.org/ 10.1186/1471-2105-11-171
Kim, C., H. Guo, W. Kong, R. Chandnani, L.-S. Shuang et al., 2016 Application of genotyping by sequencing technology to a variety of crop breeding programs. Plant Sci. 242: 14–22. https://doi.org/10.1016/j.plantsci.2015.04.016
Lewontin, R. C., 1964 The interaction of selection and linkage. I. General considerations; heterotic models. Genetics 49: 49–67. Lewontin, R. C., and K. Kojima, 1960 The evolutionary dynamics
of complex polymorphisms. Evolution 14: 458–472.
Li, Y., C. J. Willer, J. Ding, P. Scheet, and G. R. Abecasis,
2010 MaCH: using sequence and genotype data to estimate
haplotypes and unobserved genotypes. Genet. Epidemiol. 34: 816–834.https://doi.org/10.1002/gepi.20533
Li, Y.-H., and H.-P. Wang, 2017 Advances of
genotyping-by-sequencing in fisheries and aquaculture. Rev. Fish Biol. Fish. 27: 535–559.https://doi.org/10.1007/s11160-017-9473-2 Lu, F., A. E. Lipka, J. Glaubitz, R. Elshire, J. H. Cherney et al.,
2013 Switchgrass genomic diversity, ploidy, and evolution: novel insights from a network-based SNP discovery protocol. PLoS Genet. 9: e1003215.https://doi.org/10.1371/journal.pgen.1003215 Mackay, I., and W. Powell, 2007 Methods for linkage
disequilib-rium mapping in crops. Trends Plant Sci. 12: 57–63.https://doi. org/10.1016/j.tplants.2006.12.001
Marshall, T. C., J. B. K. E. Slate, L. E. B. Kruuk, and J. M. Pemberton, 1998 Statistical confidence for likelihood-based paternity infer-ence in natural populations. Mol. Ecol. 7: 639–655.https://doi. org/10.1046/j.1365-294x.1998.00374.x
Maruki, T., and M. Lynch, 2014 Genome-wide estimation of link-age disequilibrium from population-level high-throughput se-quencing data. Genetics 197: 1303–1313. https://doi.org/ 10.1534/genetics.114.165514
Mueller, J. C., 2004 Linkage disequilibrium for different scales and applications. Brief. Bioinform. 5: 355–364.https://doi.org/ 10.1093/bib/5.4.355
Nimmakayala, P., A. Levi, L. Abburi, V. L. Abburi, Y. R. Tomason
et al., 2014 Single nucleotide polymorphisms generated by genotyping by sequencing to characterize genome-wide diver-sity, linkage disequilibrium, and selective sweeps in cultivated watermelon. BMC Genomics 15: 767.https://doi.org/10.1186/ 1471-2164-15-767
Nordborg, M., and S. Tavaré, 2002 Linkage disequilibrium: what history has to tell us. Trends Genet. 18: 83–90.https://doi.org/ 10.1016/S0168-9525(02)02557-X
Pernaci, M., S. De Mita, A. Andrieux, J. Pétrowski, F. Halkettet al., 2014 Genome-wide patterns of segregation and linkage dis-equilibrium: the construction of a linkage genetic map of the poplar rust fungusMelampsora larici-populina. Front. Plant Sci. 5: 454.https://doi.org/10.3389/fpls.2014.00454
R Core Team, 2017 R: A Language and Environment for Statistical Computing. R Foundation for Statistical Computing, Vienna. Robledo, D., C. Palaiokostas, L. Bargelloni, P. Martínez, and R.
Houston, 2017 Applications of genotyping by sequencing in
aquaculture breeding and genetics. Rev. Aquacult. https://doi. org/10.1111/raq.12193
Russell, J. C., and R. M. Fewster, 2009 Evaluation of linkage dis-equilibrium method for estimating effective population size, pp. 291–320 inModeling Demographic Processes in Marker Popula-tions, edited by D. L. Thomson, E. G. Cooch, and M. J. Conroy.
Springer, Boston, MA.
https://doi.org/10.1007/978-0-387-78151-8_13
Scheet, P., and M. Stephens, 2006 A fast andflexible statistical model for large-scale population genotype data: applications to inferring missing genotypes and haplotypic phase. Am.
J. Hum. Genet. 78: 629–644. https://doi.org/10.1086/
502802
Sieber, A.-N., C. F. H. Longin, and T. Würschum, 2017 Molecular characterization of winter durum wheat (triticum durum) based on a genotyping-by-sequencing approach. Plant Genet. Resour. 15: 36–44.https://doi.org/10.1017/S1479262115000349 Slatkin, M., 2008 Linkage disequilibrium–understanding the
evo-lutionary past and mapping the medical future. Nat. Rev. Genet. 9: 477–485.https://doi.org/10.1038/nrg2361
Sved, J., 1971 Linkage disequilibrium and homozygosity of chro-mosome segments infinite populations. Theor. Popul. Biol. 2: 125–141.https://doi.org/10.1016/0040-5809(71)90011-6 Sved, J. A., E. C. Cameron, and A. S. Gilchrist, 2013 Estimating
effective population size from linkage disequilibrium between unlinked loci: theory and application to fruitfly outbreak pop-ulations. PLoS One 8: e69078.https://doi.org/10.1371/journal. pone.0069078
Swarts, K., H. Li, J. A. R. Navarro, D. An, M. C. Romay et al.,
2014 Novel methods to optimize genotypic imputation
for low-coverage, next-generation sequence data in crop plants. Plant Genome 7: DOI: 10.3835/plantgenome2014.05. 0023.
Teare, M. D., A. M. Dunning, F. Durocher, G. Rennart, and D. F. Easton, 2002 Sampling distribution of summary linkage dis-equilibrium measures. Ann. Hum. Genet. 66: 223–233.https:// doi.org/10.1046/j.1469-1809.2002.00108.x
Tennessen, J. A., S. R. Bollmann, and M. S. Blouin, 2017 A tar-geted capture linkage map anchors the genome of the schisto-somiasis vector snail,Biomphalaria glabrata. G3 7: 2353–2361. https://doi.org/10.1534/g3.117.041319
Terwilliger, J. D., S. Zöllner, M. Laan, and S. Pääbo, 1998 Mapping genes through the use of linkage disequilibrium generated by genetic drift:‘drift mapping’in small populations with no demo-graphic expansion. Hum. Hered. 48: 138–154.https://doi.org/ 10.1159/000022794
Terwilliger, J. D., F. Haghighi, T. S. Hiekkalinna, and H. H. H.
Göring, 2002 A bias-ed assessment of the use of SNPs in
human complex traits. Curr. Opin. Genet. Dev. 12: 726–734. https://doi.org/10.1016/S0959-437X(02)00357-X
Van Wyngaarden, M., P. V. R. Snelgrove, C. DiBacco, L. C. Hamilton, N. Rodríguez-Ezpeleta et al., 2016 Identifying patterns of dispersal, connectivity and selection in the sea
scallop, Placopecten magellanicus, using RADseq-derived
SNPs. Evol. Appl. 10: 102–117. https://doi.org/10.1111/ eva.12432
Wang, Y.-H., H. D. Upadhyaya, A. M. Burrell, S. M. E. Sahraeian, R. R. Kleinet al., 2013 Genetic structure and linkage disequilibrium in a diverse, representative collection of the C4 model plant,Sorghum bicolor. G3 (Bethesda) 3: 783–793.https://doi.org/10.1534/g3. 112.004861
Waples, R. S., 2006 A bias correction for estimates of effective population size based on linkage disequilibrium at unlinked gene loci. Conserv. Genet. 7: 167–184. https://doi.org/10.1007/ s10592-005-9100-y
Xiong, M., and S.-W. Guo, 1997 Fine-scale genetic mapping based on linkage disequilibrium: theory and applications. Am. J. Hum. Genet. 60: 1513–1531.https://doi.org/10.1086/ 515475
Xu, P., S. Xu, X. Wu, Y. Tao, B. Wang et al., 2014 Population genomic analyses from low-coverage RAD-Seq data: a case study on the non-model cucurbit bottle gourd. Plant J. 77: 430–442.https://doi.org/10.1111/tpj.12370
Zhang, D., J. Li, R. O. Compton, J. Robertson, V. H. Goff et al., 2015 Comparative genetics of seed size traits in divergent
cereal lineages represented by sorghum (Panicoidae) and rice (Oryzoidae). G3 (Bethesda) 5: 1117–1128. https://doi.org/ 10.1534/g3.115.017590
Zhu, X., F. Xu, S. Zhao, W. Bo, L. Jianget al., 2015 Inferring the evolutionary history of outcrossing populations through com-puting a multiallelic linkage–linkage disequilibrium map. Meth-ods Ecol. Evol. 6: 1259–1269. https://doi.org/10.1111/2041-210X.12428