Design and Implementation of Web Based
GIS Provided With an RSIP Means
Eng. Ahmed Mohamed Abdelhady * Dr. Fawzy Eltohamy H. Amer Dr. Gouda I. Salam Dr. Khaled Shafee badran Egyptian Armed Forces Egyptian Armed Forces Egyptian Armed Forces Egyptian Armed Forces
Abstract: The Geographic Information Systems (GIS) have become popular tool, used in different fields. The launching of Commercial map servers offered a new approach of building web based GIS systems; making it possible to integrate external geographically referenced data with the powerful map server . This paper presents the design and implementation of a web based GIS which involves both server side and client side. The system is built by adapting the Google MapsApplication programming interface (API) library and building a web server with HyperText Markup Language (HTML5), Hypertext Preprocessor (PHP) and other web programming language.Users can interact with the application to send requests to the server to obtain images from the map server. The required images is then sent to the processing server to perform unsupervised classification of satellite images using Matlab. The previous functionalities are necessary to use efficient techniques for the classification of images and the incorporation of content-based image retrieval (CBIR). Several experimental validation types of the classification results with the proposed system are performed by comparing the classification accuracy of the proposed chain by means of techniques available in the well-known ERDAS IMAGINE software package.
Keywords: Remote sensing data processing, satellite image classification, web-based system, k-means, fuzzy c-means,content-based image retrieval (CBIR)
1. INTRODUCTION
Remote sensing images have significant applications in different areas such as urban planning, surveys and mapping, agricultural analysis, environmental monitoring and military intelligence. Urban land cover classification can be challenging as there are many uncertainties in remote sensing data and there is no definite mathematical model that truly captures the image data. Heterogeneous spectra of the Very high-resolution (VHR) imagery caused by the inner complexity of dense urban areas and the occlusions and shadows caused by the variety of objects in urban areas, for example buildings, roads and trees, make it even more difficult and challenging, hindering exhaustive automatic or manual extraction. Classification of the VHR optical sensors imagery into Land Cover/Land use map is an important and challenging task. The detailed visual information of land targets makes the classification task difficult and methods difficult to standardize. With a web-based system, users only require a simple web browser to access remotely sensed imagery and perform spatial analyses without the needs or costs of installing GIS and image processing software packages. This resourceful increase has led to the exponential growth of the user community for satellite/airborne images, not long ago only accessible by government intelligence agencies [1], [2] and such capabilities and analytical resources can be easily shared by multiple users from different locations at the same time. The combination of an easily searchable mapping and satellite/airborne imagery tool such as Google Maps, with advanced image classification and retrieval features [3], can expand the functionalities of the tool and also allow end-users to extract relevant information from a massive and widely available database of satellite/airborne images.
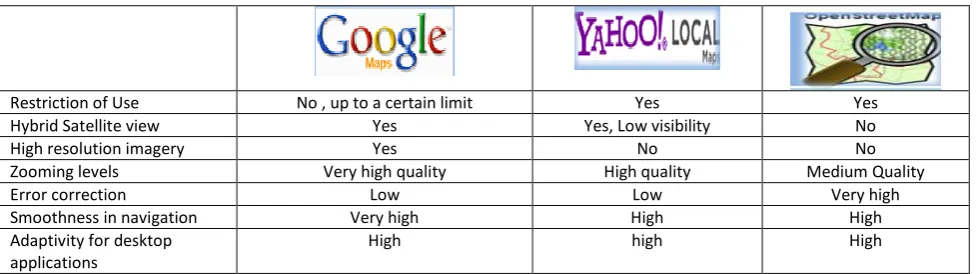
Restriction of Use No , up to a certain limit Yes Yes
Hybrid Satellite view Yes Yes, Low visibility No
High resolution imagery Yes No No
Zooming levels Very high quality High quality Medium Quality
Error correction Low Low Very high
Smoothness in navigation Very high High High
Adaptivity for desktop applications
High high High
Table. 1 Comparison between the main functionalities of Google Maps, Yahoo Maps and OpenStreetMap
For illustrative purposes, Fig. 1 shows a comparison between the main functionalities of Google Maps, Yahoo Maps and OpenStreetMap. As shown in Table 1, the Google Maps service offers important competitive advantages, such as : 1. The availability of HR satellite imagery .
2. The smoothness in the navigation and interaction with the system.
Even though, the possibility to perform unsupervised or supervised classification of satellite images is not available in Google Maps. Image classification is widely recognized as one of the most powerful approaches in order to extract information from satellite imagery and be able to perform CBIR tasks.
In this paper, we describe a web-based system that allows an unexperienced user to perform an unsupervised classification of satellite/airborne images obtained via Google Maps based on two well-known clustering techniques: Fuzzy c-means [4] and k-means [5]. The processing chain has been implemented in Matlab and integrated into our web based application tool using HTML5, PHP. Then we evaluate the results using accuracy assessment tool to discover the best technique(s) in each case to be as a guide for any an unexperienced users.
2. RELATED WORK
A GIS system is most often associated with maps and viewed as a set of map views that graphically present the geographic features on the surface of the earth. Also, other kinds of geographic referenced information can be displayed on the maps. For example, a map can be used to give a view of certain area. Then graphic markers (lines, coloured dots, arrows…) can be placed on the map to give indications (tourist attractions, driving directions, business addresses…).
There are two key components to a GIS system. One is the database that contains the geographically referenced information. The other is the set of maps on which the geographical referenced data are presented. Moreover, the maps in a GIS system often work as the user interface through which users can work with the geographic data in the system.
Since the Google Maps API was published, a number of web applications and papers have been developed that integrate external custom data on Google Maps. we can state the most similar systems/papers to ours as follows:
1. Web-Based System for Classification of Remote Sensing Data [6]:
Using Web programming languages, Image acquisition with Google Maps application programming interface (API) and as a map server makes unsupervised classification of satellite/airborne images based on two well-known clustering techniques: ISODATA, and k-means followed by spatial post-processing based on majority voting.
The results are evaluated by comparing the classification accuracy of the proposed chain by means of techniques available in the well-known Environment for Visualizing Images (ENVI) software package and producing Confusion Matrix.
2. A New System to Perform Unsupervised and Supervised Classification of Satellite Images from Google Maps [7]:
Using Google Maps application programming interface (API) and other external libraries such as Swing X-WS and Google Web Toolkit (GWT) to make inexperienced user to perform unsupervised classification of satellite images obtained via Google Maps by means of the ISODATA and k-Means classifiers, followed by spatial post-processing based on majority voting. Selected regions in the classified portion can then be used to train a more sophisticated, supervised classifier (maximum likelihood type) able to map larger image areas in a manner transparent to the user.
The results are evaluated by comparing the obtained classification results with those provided by commercial software, such as the popular Research Systems ENVI package in terms of the overall accuracy (OA) resulting from the confusion matrix .
3. A New Tool for Classification of Satellite Images Available from Google Maps Efficient Implementation in Graphics Processing Units [8]:
The results are evaluated by classification agreement (in percentage) measured after comparing k-means classification map with the one obtained by ENVI (assuming the latter as the reference). And the execution times achieved for each of the CPU-GPU configurations used, as well as the speedups achieved for different image sizes and number of clusters.
4. A Web Based System for Classification of Remote Sensing Data [9]:
Using C language in developing a new tool and then integrated it with HTML5, JavaScript, Php, AJAX and other web programming languages. Image acquisition with the applications programmer interface (API) for the incorporation of content-based image retrieval (CBIR).the system is intend for the classification of Remote Sensing Data and retrieval features to expand the functionalities of the tool and also allow end-users to extract relevant information from a massive and widely available database of satellite/airborne images .The results are evaluated by comparing the classification accuracy of the proposed chain by means of techniques available in the well-known Environment for Visualizing Images (ENVI) software package.
The difference between our proposed system and above systems that we compared the results with a classified image obtained from well-known (ERDAS imagine) software package and we used Accuracy assessment tool (ERDAS imagine) software package to obtain the confusion matrix .
3. PROPOSED SYSTEM ARCHITECTURE
This section describes the architecture of the proposed system, displayed in Fig. 2. It is a web application comprised of several layers or modules. Each module serves a different purpose, and the technology adopted for the development of the system is based on open standards and free software. A combination of these modules has been used for the development of the system. As shown by the architecture model described in Fig. 2, the proposed system can be described from a high level view point using three different layers, which are completely independent from each other.
Fig.1 Architecture of the proposed system expressed in the form of 3 layers.
Map Layer Client Layer
Server Layer
Tablet
Google Maps PC
Web Server
Due to the adopted modular design, any of the layers can be replaced. Also, the system is fully scalable. Moreover, the design of the system in the form of layers (map, client and server) allows for the incorporation of additional resources in each of the layers without modification of the system. A good example is the possibility to incorporate additional compute resources such as A graphics processor units (GPUs), or even additional map servers, or using another application on the server which are fully supported by our current implementation of the system. The communication between two layers is carried out over the Internet via the hypertext transfer protocol (HTTP).As a result, the system performance will depend largely (as expected) on the available bandwidth. Both the map layer (currently provided by Google Maps) and server layer (by ourselves) are available from any location in the world. We describe each layer adopted briefly next.
A.Map Layer
This layer contains the source imagery data to be used by the system, i.e., the image database. Google Maps is used in the current version by means of the Google Maps API V3 as a programming interface intended for accessing the provided maps .The current framework is limited to the types of maps provided by Google Maps. Also, all the potentials and functionalities provided by the Google Maps API V3 are included (this comprises management of zoom levels, image cantering, location by geo-spatial coordinates, etc.). The system is accessible free of charge and is easy to include in our proposed platform. In fact, the image database can be used to capture any satellite/airborne images displayed by the Google Maps engine, and most importantly the images can be captured at different zoom levels. Even a single image can be extracted at different zoom levels, which is obtained by different image sizes and resolutions. This feature offers significant advantages in the accurate analysis of geo-registered satellite/airborne imagery at different resolutions.
B. Server Layer
The server layer is one main layer in the system. It is formed by two sub-modules: web server and processing server. The former is the part of the system hosting the source code of the application [developed using HTML5, PHP and Cascading Style Sheets (CSS)] and deal with the incoming traffic and requests from client browsers. We have used the Apache web server due to its wide acceptance, performance, and free-of-charge license. Further, PHP is used both in the server layer and also for managing the communications between the clients and the web server (mainly dominated by the transmission of satellite/airborne imagery to be processed), and the web server and the processing server (in-tended for the processing of satellite/airborne images). The processing server is mainly in charge of the actual image processing tasks which comprise clustering
using k-means [5] and fuzzy c-means [4] algorithms. The processing server receives the processing
requests from end-users, manages them effectively by resorting to exploit a remote server, and then provides the obtained result to the end-user. The web server and the compute server are currently hosted on the same machine, which in our case is motivated by the fact that the processing capacity of the server was experimentally observed to be high enough to support also the computational demands introduced by the map layer. The system also allows having different machines for this purpose, allowing for incorporation of additional processing modules other than Gabor wavelet, k-means.
The client layer defines the interactions between the user (through an internet browser) and our system. Only one web Page is needed as user interface, which updated automatically without the need for interactions with the web server. The design of the web interface has been done using PHP and it is built on JavaScript.
Client layers contains the Graphical User Interface (GUI) ,which is important because it is the visible part of our system and allows the user to perform all operations available in the application. An HTML page and JavaScript libraries have been used for development.. As the whole GUI runs on the client layer, usability and speed of response are guaranteed, and the adopted design is very flexible. The GUI has been developed in the form of single HTML page, avoiding repeated requests and responses back to the server. Several features within the HTML5 standard have been used in order to design the GUI for our system application. The most important object used is the canvas, which allows for an efficient management of the images to be processed. The container can carry out map captures (snapshots), to access the information of each pixel of the capture, to transfer all such information to the server layer, and to save the obtained information (processed images). The only requirement at the client layer is the use of browsers that supportHTML5. Some browsers currently support some (but not all) of the features in HTML5. One of the key features that client browsers must support in the context of our application is the so-called attribute cross Origin of the image object in HTML8. Should this feature not be supported, the application will display a security error and will not work correctly.
Fig. 2 shows an example of the designed GUI, designed for simplicity purposes. It consists of a single web page with a working panel, a container of maps, the capture of maps, the zoom level shift, and the selection of processing parameters for the k-means, fuzzy c-means and showing segmented (classified) image. Different captures of the same map always have the same size as the original map size.
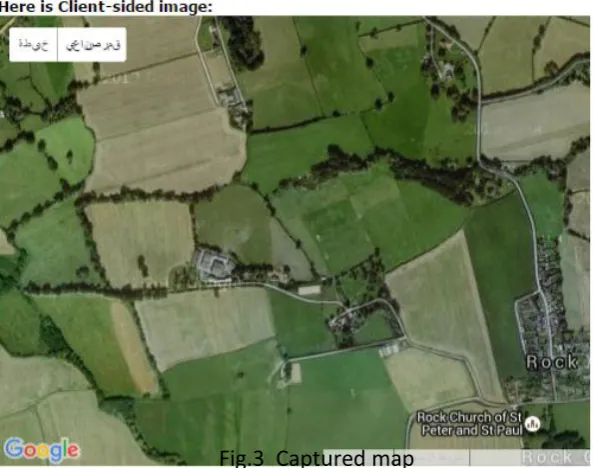
Fig. 3 shows the captured map with an option to save it to local disk or go map to main page.
Fig.3 Captured map
4. PROPOSED SYSTEM WORKFLOW
In order to understand the interactions between the different layers of proposed system, the follow explain the workflow of a processing request started by the end-user in the system and the different steps needed until a processing result is received by him again. The following steps are identified in fig. (4) As follows:
1. First, the end-user starts the use of the system from the local internet browser by requesting the web page site. This an HTTP request to the web server.
2. This request will be received by web server and then provides the end-user with an HTML web page and all necessary references (JavaScript libraries, CSS, ….etc.).
3. Then the client layer asks from the map server the information needed to perform some operations on the map (i.e., zooming). This operation is transparent to the system.
4. The map layer sends the information requested by the client layer in the form of operated maps that will be locally managed by the end-user.
server) We emphasize that the end-user can decide the image view (street, satellite, hybrid,… etc.) and the zoom level and of the map image to be processed.
6. The web server composes the full image by accessing to the Google Maps database.
7. The web server provides the image to be processed to the processing server. Our proposed system thus delegates the processing task to an independent remote server that takes care of the processing task independently in the system.
8. Once the image has been processed, the processing server returns the result to the web server. In our current implementation both the web server and the processing server are implemented in the same machine (generally, it can be implemented on another machine).
9. Finally, the processing result is returned to the client layer as the final outcome of the adopted processing chain.
10. The end-user can save the processed image to local disk.
Fig.4 Interactions between the three main layers (map, client and server) of the proposed system.
5. CLASSIFIERS
One of the main purposes of satellite remote sensing is to analysis the digital data and extract the useful information (features). The first step In RS image analysis is the image classification where each pixel is labelled to a particular spectral class. In RS There are two broads classification techniques (supervised and unsupervised classification).Unsupervised classification doesn’t require human to have the foreknowledge of the classes, and mainly using some clustering algorithm to
classify an image data [10]. These procedures can be used to determine the number and location of
are spectrally similar. In our implementation, we have used the well-known k-means Clustering Algorithm and Fuzzy c-means Clustering Algorithm (FCM).
A. k-means Clustering Algorithm:
The aim of the K-means algorithm is to divide M points in N dimensions into K clusters so that the within cluster sum of squares is minimized. It is not practical to require that the solution has minimal sum of squares against all partitions, we seek instead "local" optima, solutions such that no movement of a point from one cluster to another will reduce the
within-cluster sum of squares[11]. K-means is one of the simplest unsupervised learning
algorithms that solve the well-known clustering problem [12]. The procedure follows a simple and
easy way to classify a given data set through a certain number of clusters (assume k clusters) fixed a priori.
The algorithm is composed of the following steps:
1. Place K points into the space represented by the objects that are being clustered. These
points represent initial group centroids as in fig (5).
2. Assign each object to the group that has the closest centroid as in fig (6).
3. When all objects have been assigned, recalculate the positions of the K centroids.
4. Repeat Steps 2 and 3 until the centroids no longer move. This produces a separation of the
objects into groups from which the metric to be minimized can be calculated as in fig (7).
Fig.5 The data before using any classification technique
Fig.6 The k-means algorithm partitions the data into k=2 mutually exclusive clusters
As it is clear from the previous step, the main idea is to define k centroids, one for each cluster. These centroids should be placed in a cunning way because of different location causes different result. So, the better choice is to place them as much as possible far away from each other. The next step is to take each point belonging to a given data set and associate it to the nearest centroid. When no point is pending, the first step is completed and an early groupage is done. At this point we need to re-calculate k new centroids as barycenters of the clusters resulting from the previous step. After we have these k new centroids, a new binding has to be done between the same data set points and the nearest new centroid. A loop has been generated. As a result of this loop we may notice that the k centroids change their location step by step until no more changes are done. In other words centroids do not move any more.
Finally, this algorithm aims at minimizing an objective function, in this case a squared error function. The objective function
(1)
where is a chosen distance measure between a data point and the cluster
centre , is an indicator of the distance of the n data points from their respective cluster centres.
B.Fuzzy c-means Clustering Algorithm(FCM)
It is amethod of clustering which allows one piece of data to belong to two or more clusters. It is
frequently used in pattern recognition [13] [14]. It is based on minimization of the following
objective function:
(2)
where m is any real number greater than 1, uij is the degree of membership of xi in the cluster j, xi is
the ith of d-dimensional measured data, cj is the d-dimension center of the cluster, and ||*|| is any
norm expressing the similarity between any measured data and the center. Fuzzy partitioning is carried out through an iterative optimization of the objective function shown above, with the update of membership uij and the cluster centers cj by:
, (3)
(4)
6. EXPERIMENTALVERIFICATIONS
package. We adopt the same classes when running our implementations as those available in the ERDAS Imagine package.
The validation is conducted by means of the following steps:
1) An experiment with the k-means unsupervised classification algorithm on the satellite image
using Matlab and the result is shown in Fig (10.b).
2) An experiment with the Fuzzy C-means unsupervised classification algorithm on the satellite
image using Matlab and the result is shown in Fig (10.c).
3) An experiment with the k-means unsupervised classification algorithm on the satellite image
using Erdas Imagine and the result is shown in Fig (10.d).
Fig.10.a satellite image obtained from Google Maps over an urban area (Pavia city, Italy)
(a)
Fig.10.b image obtained from an experiment with the k-means unsupervised classification using Matlab
Fig.10.d image obtained from an experiment with the k-means unsupervised classification using using Erdas Imagine
7. CLASSIFICATION ACCURACY ASSESSMENT
Accuracy assessment is a general term for comparing the classification to geographical data that are assumed to be true, in order to determine the accuracy of the classification process. Usually,
the assumed-true data are derived from ground truth data [15].
Accuracy Assessment CellArray … is created to compare the classified image with reference data by creating a list of class values for the pixels in the classified image file and the class values for the corresponding reference pixels. The class values for the reference pixels are input by you while The CellArray data reside in an image file.
From Accuracy Assessment CellArray, two kinds of reports can be derived:
1. Error matrix … simply compares the reference points to the classified points in a c×c matrix, where c is the number of classes (including class 0).
2. Accuracy report … calculates statistics of the percentages of accuracy, based upon the results of the error matrix.
Kappa coefficient … expresses the proportionate reduction in error generated by a classification process compared with the error of a completely random classification. For example,
a value of 0.82 implies that the classification process is avoiding
82 percent of the errors that a completely random classification generates.
We used stratified random sampling design (points are generated proportionate to the distribution of classes in the image) as it is the most appropriate for the land cover accuracy
assessment [16].
The equation based on binomial probability theory that relates classification accuracy assessment sample size to overall classification accuracy and allowable error can be used to calculate the
allowable error on the accuracy of each land cover map [17]. The equation is:
(5)
where,
N = Number of samples
p = Expected or calculated accuracy (in percentage) q = 100-p
Z = Standard normal deviate for the 95% two-tail confidence level (1.96)
For achieving the expected accuracy is 85% at an allowable error of 5% (i.e., it is 95% accurate), the number of points necessary for reliable results is:
aminimum of203 points.
5 ) 15 )( 85 ( 2 2 2 N
For Accuracy assessment “best practices” we can assume following conditions *18]:
1. (30-50) reference points per class is ideal
2. Reference points should be derived from imagery or data acquired at or near the same time as
the classified image
3. If no other option is available, use the original image to visually evaluate the reference points
(effective for generalized classification schemes)
For this reason, we set 50 as the minimum number of sample points for any class, therefore increasing our total number of sample points from 203 to 457 and the confusion matrix obtained after comparing the classified image produced by our system/by Erdas with the original map. The results of classification accuracy assessment for our Experiment are given as follows:
a. Experiment 1: Validation of the K-means Unsupervised Classification Algorithm :
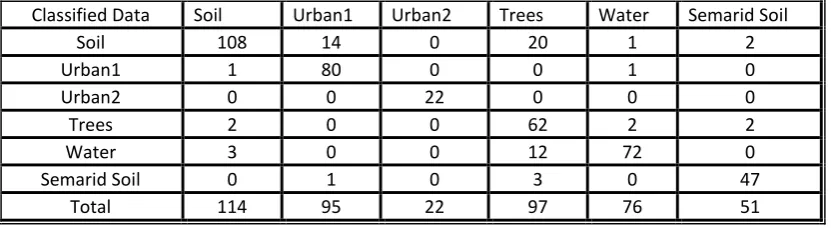
TABLE (2)confusion matrix obtained after comparing the classification map in fig.(10.b), produced by our system (with the k-means algorithm) with the original map in fig.(10.a)
Classified Data Soil Urban1 Urban2 Trees Water Semarid Soil
Soil 108 14 0 20 1 2
Urban1 1 80 0 0 1 0
Urban2 0 0 22 0 0 0
Trees 2 0 0 62 2 2
Water 3 0 0 12 72 0
Semarid Soil 0 1 0 3 0 47
Total 114 95 22 97 76 51
Overall Classification Accuracy = 85.56 %
Overall Kappa Statistics = 0.8205
b. Experiment 2: Validation of the Fuzzy c-means Unsupervised Classification Algorithm :
Table (3) confusion matrix obtained after comparing the classification map in fig. (10.c), produced by our system (with the fuzzy c-means algorithm) with the original map in fig. (10.a)
Classified Data Soil Urban1 Urban2 Trees Water Semarid Soil
Soil 85 10 0 13 1 2
Urban1 2 69 0 0 1 0
Urban2 0 0 40 0 0 0
Trees 8 5 0 61 2 2
Water 7 3 0 8 72 0
Semarid Soil 0 3 0 7 0 37
Overall Classification Accuracy = 80 % Overall Kappa Statistics = 0.7766
c. Experiment 3: Validation of the Erdas Imagine (K-means) Unsupervised Classification Algorithm :
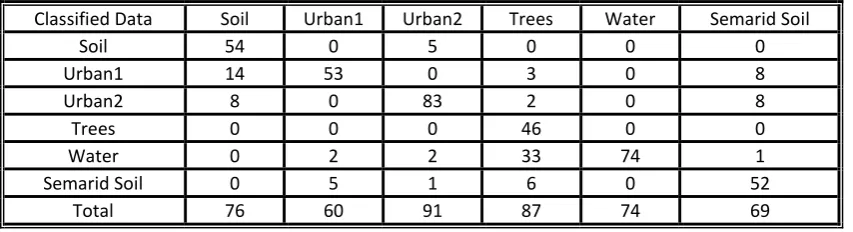
Table (4) confusion matrix obtained after comparing the classification map in fig. (10.d), produced by Erdas imagine (with the k-means algorithm) with the original map in fig. (10.a)
Classified Data Soil Urban1 Urban2 Trees Water Semarid Soil
Soil 54 0 5 0 0 0
Urban1 14 53 0 3 0 8
Urban2 8 0 83 2 0 8
Trees 0 0 0 46 0 0
Water 0 2 2 33 74 1
Semarid Soil 0 5 1 6 0 52
Total 76 60 91 87 74 69
Overall Classification Accuracy = 79.87 % Overall Kappa Statistics = 0.7580
8. CONCLUSION
In this work, we have developed a new parallel implementation of unsupervised classification and of satellite images. The algorithm has been implemented using Matlab, and evaluated the classification results using a accuracy assessment using ERDAS Imagine for information extraction and analysis of image data sets from Google Maps engine. The system was integrated into web application with three layers (client , processing , storage). The algorithm has been evaluated in terms of its Overall Classification Accuracy and Kappa Statistics with commercial software (Erdas Imagine) in the same context. The main contributions of this study is The proposed method succeeded in obtaining better results of clustering satellite images with regards to commercial software.
II.
REFERENCES[1] R. A. Schowengerdt, Remote Sensing: Models and Methods for Image Processing, 2nd ed. New York: Academic Press, 1997.
[2] D. A. Landgrebe, Signal Theory Methods in Multispectral Remote Sensing. New York: Wiley, 2003.
[3] J.A.RichardsandX.Jia, Remote Sensing Digital Image Analysis: An Introduction. New York: Springer, 2006.
[4] J. C. Dunn,A Fuzzy Relative of the ISODATA Process and Its Use in detecting Compact Well-Separated Clusters", Journal of Cybernetics 3: 32-57, 1973.
[5] J. A. Hartigan and M. A. Wong, “Algorithm as 136: A k-means clustering algorithm,” J. of the Royal Statistical Soc., Series C (Appl Statist.), vol. 28, pp. 100–108, 1979.
[7] Sergio Bernabe and Antonio Plaza “A New System to Perform Unsupervised and Supervised Classification of Satellite Images from Google Maps” Satellite Data Compression, Communications, and Processing VI, Proc. of SPIE, 2010 ·
[8] Sergio Bernabe and Antonio Plaza “A New Tool for classification of Satellite” 2010 ·
[9] Dhananjay G. Deshmukh “A Web – Based System for Classification of Remote Sensing Data” International Journal of Engineering Research and General Science Volume 2, Issue 6, October-November, 2014
[10] Richards, J. A., Remote sensing digital image analysis: an introduction (second edition), 1993. [11] J. MACQUEEN, Some Methods For Classification And Analysis Of Multivariate Observations,
1967.
[12] “Introduction to Matlab , Lecture 10:Supervised Learning & Artificial Neural Networks ", Eran Eden Weizmann,2008.
[13] J. C. Dunn (1973): "A Fuzzy Relative of the ISODATA Process and Its Use in Detecting Compact Well-Separated Clusters", Journal of Cybernetics 3: 32-57
[14] J. C. Bezdek (1981): "Pattern Recognition with Fuzzy Objective Function Algoritms", Plenum Press, New York
[15] ERDAS Field Guide Seventh Edition page 261
[16] An Accuracy Assessment of 1992 Landsat-MSS Derived Land Cover for the Upper San Pedro Watershed, United States Environmental Protection Agency, 2002.
[17] van Genderen, J. L. and B. F. Lock. 1977. Testing land use map accuracy. Photogrammetric Engineering and Remote Sensing 43:1135-37.