Proceedings of the 27th International Conference on Computational Linguistics, pages 2505–2515 2505
Real-time Change Point Detection using On-line Topic Models
Yunli Wang
Scientific Data Mining National Research Council Canada
1200 Montreal Rd., Ottawa, ON [email protected]
Cyril Goutte
Multilingual Text Processing National Research Council Canada
1200 Montreal Rd., Ottawa, ON [email protected]
Abstract
Detecting changes within an unfolding event in real time from news articles or social media enables to react promptly to serious issues in public safety, public health or natural disasters. In this study, we use on-line Latent Dirichlet Allocation (LDA) to model shifts in topics, and apply on-line change point detection (CPD) algorithms to detect when significant changes happen. We describe an on-line Bayesian change point detection algorithm that we use to detect topic changes from on-line LDA output. Extensive experiments on social media data and news articles show the benefits of on-line LDA versus standard LDA, and of on-line change point detection compared to off-line algorithms. This yieldsF-scores up to 56% on the detection of significant real-life changes from these document streams.
1 Introduction
In recent years, the detection of emerging events from publicly available data streams such as twitter messages has received a lot of attention. The approaches used range from topic modeling, incremental clustering, the concept of interestingness, and others (Hasan et al., 2017). For example, methods relying on topic models detect latent topics from tweets and use that semantic structure to guide the event de-tection task. In particular, Latent Dirichlet Allocation,akaLDA (Blei et al., 2003), and extensions have been widely used to model topics from large corpora. It has been used for event detection (Pozdnoukhov and Kaiser, 2011; Ertl et al., 2012; Vavliakis et al., 2012; Lau et al., 2012; Zhou and Chen, 2014), sum-marization, or finding influential users in social media. However, only few studies used LDA to detect topic changes over time (Lau et al., 2012; Zhou and Chen, 2014).
Once a main event is identified, detecting key sub-events is an essential task. For example, during a public health epidemic crisis, detecting turning points in the spread of the disease is extremely important. Relatively little attention has been paid on detecting these change points during an event. For example, Bruggermann et al. (2016) used the dynamic topic model,akaDTM (Blei and Lafferty, 2006), to detect and track stories in news articles. In addition, although many studies use topic models for event detection, very few focus on real-time or sub-event detection.
In statistics, change point detection (CPD) is the task of finding locations where the underlying stochastic process governing time series changes. Change-point detection algorithms can be split into two categories: Real-time (or on-line) detection and retrospective (or off-line) detection, depending on how data is used. Most CPD algorithms are retrospective (Barry and Hartigan, 1993; James and Matte-son, 2015): the main drawback is that they can’t be run before all the data has been acquired, which is a significant operational constraint when monitoring unfolding safety or health crises. Few algorithms address real-time detection (Adams and MacKay, 2007).
Our study focuses on real-time change point detection in document streams by combining on-line LDA with on-line CPD. Most previous studies on event detection used off-line topic models (Ertl et al., 2012; Vavliakis et al., 2012), which is not appropriate for document streams. In addition, many studies using LDA or on-line LDA for event detection only tested on several case studies (Pozdnoukhov and
c
Kaiser, 2011; Ertl et al., 2012): there were no reference events to test against. By contrast, we collected document streams from social media and news articles, and gathered reference change points for each dataset, in order to evaluate the performance on these datasets.
In the following section, we review some related work in order to position ours. In Section 3 we describe the methods: topic modeling, CPD and their combination. Sections 4 and 5 report on our experiments and results, before we discuss our findings (Section 6).
2 Related Work
LDA is a three-level hierarchical Bayesian model (Blei et al., 2003) where each document is a multi-nomial distribution over topics, and each topic is a multimulti-nomial distribution over the vocabulary. The Dynamic Topic Model (Blei and Lafferty, 2006) is an extension of LDA that captures the evolution of topics in a sequentially organized corpus of documents. In order to process document streams, several on-line LDA (oLDA) methods have also been proposed (Hoffman et al., 2010; Lau et al., 2012; Zhai and Boyd-Graber, 2013).
These models have been used for event detection from social media data. Pozdnoukhov and Kaiser (2011) used LDA to identify topics and classified tweets according to the most probable topic. Ertl et al. (2012) combined LDA with Seasonal Trend Decomposition in order to detect and rank topics, remove daily chatter and detect abnormal topics. Vavliakis et al. (2012) used LDA for topic identification and event detection in the MediaEval-2012 Social Event Detection task. Zhou and Chen (2014) proposed a location-time constrained topic model to represent social data information over content, time, and location. By considering the time and location of messages as additional variables, it outperformed oLDA on the tested datasets. In addition to using spatial information on top of LDA, none of the previous studies consider real-time event detection.
Other recent work attempt to build storylines from either news articles or social media data. Brugger-mann et al. (2016) use the word-topic distribution from the DTM model to represent the changes during events, but did not evaluate the performance of the DTM model on topic identification, or whether the turning points from the word-topic distribution discover actual sub-events. Wang and Goutte (2017) evaluated the performance of change point detection algorithms using the temporal profiles of hashtags and frequency of tweets on two twitter data sets. Their work is an early attempt to use CPD algorithms on the content of document streams. Previous studies (Guralnik and Srivastava, 1999; James et al., 2016) detected significant changes from sensor signals but do not use the textual content of message streams. Recently, Goutte et al. (2018) used a similar on-line CPD approach, but applied it on time series recording the sentiment polarity in streams of tweets.
3 Methods
In this section, we describe on-line topic modeling, several competing ways to produce time series from the topic models, and several change point detection algorithms.
3.1 On-line Topic Model
We use both standard LDA and an on-line version of LDA with infinite vocabulary, oLDA∞. The basic LDA generates documents from a distribution over topics, each topic having a distribution over words. ForDdocuments overKtopics, the generative process is as follows (Blei et al., 2003):
1. For each docd= 1. . . D, pickθd∼Dir(α),
2. For each topick= 1. . . K, pickφk∼Dir(β),
3. For each wordwn,n= 1. . .Nd, in documentd(of sizeNd),
(a) Pick topicz∼Mult(θd),
(b) Pick wordwn∼Mult(φz).
yields document topic distributions θd and word-topic probabilitiesφk. Both can be used for further
processing, in particularθdencodes the topics represented ind.
One limitation of LDA and early on-line variants is that words are sampled over a fixed vocabulary. This makes sense in a batch setting, where all words are known from the collection, but not in a streaming or on-line setting, where new words may appear as documents are acquired. The on-line LDA with in-finite vocabulary (oLDA∞) introduced by Zhai and Boyd-Graber (2013) addresses this by 1) processing data and doing inference in minibatches, and 2) instead of a Dirichlet distribution over a fixed vocabulary, topic distributionsφkare drawn from a Dirichlet Process with a base distribution overallwords.
Dirich-let processes are a common tool from non-parametric statistics, allowing sampling and inference in finite time over unbounded and possibly countably infinite support. Details of the sampling and inference are provided by Zhai and Boyd-Graber (2013).
The original implementation of oLDA∞updates the model for each minibatch containing a fixed num-ber of documents. This does not work well in our setting where news articles or social media messages do not arrive regularly, and we want to update the model for fixedtimeincrements (e.g. a few minutes or a few days). We therefore adapted oLDA∞to process the collection in fixed-time minibatches containing variable numbers of documents according to their time stamps. We denote this variant by oLDA∞t . Doc-uments within the same time interval are placed in the same mini batch, and the model is updated at each time slott1, t2, . . . tm. Inference yields corresponding word-topic distributionsφ(1), φ(2), . . . φ(m).
3.2 From Topic Models to Topic Change
The evolution of topics in on-line LDA models is usually shown using the most probable words from the word-topic distributions (Hoffman et al., 2010; Lau et al., 2012; Zhai and Boyd-Graber, 2013). However, the same top words can appear in different topics, making differences between topics hard to show. This is in particular the case when documents are related to a particular event, as words typical of that event are common in all topics. Other approaches rely on the top words in different ways: the cosine similarity of top words from the DTM Bruggermann et al. (2016), the Jensen-Shannon divergence (JSD) Lau et al. (2012), and the symmetrized Kullback-Leibler divergence of word distribution Zhou and Chen (2014) to represent topic change over time.
We propose to evaluate topic change by using the word-topic distribution φ(t) and the document-topic distribution θn at each time slot. Four methods were tested in our study to represent the topic
change over time: cosine distance, Jensen-Shannon divergence, the word-topic distribution (WD), and the document-topic distribution (DD). For cosine distance, we used the cosine similarity between the top-word probabilities of all topics at the current timetand previous timet−1. From the word-topic distributions φk(t) and φk(t−1), we extract the top-word probabilities PW(t) and PW(t−1) and
Dcos(t)is a univariate time series withm−1points, which we use to detect significant changes using the CPD algorithms below.
The second method uses the sum of JSD between the top words in all topics between t andt−1. Normalizing the top-word distributions intoPW(t)andPW(t−1):
DJSD(t)again forms a univariate time series withm−1data points.
The last method uses the average document-topic distribution, for documents in each time interval. In the document-topic distribution matrix θ, each elementθkj represents the probability of topick in
documentj. Averaging over all documents from a minibatcht, we compute the average document-topic probabilityπk(t) = |1t|Pdj∈tθkj. This producesKtimes series, withmdata points each, on which we run multivariate CPD.
3.3 Change Point Detection
In time series analysis, a change point is a location where the underlying stochastic process changes. Although it may seem superficially related, this is a different problem than anomaly detection, where the purpose is to identify observations that do not conform to an expected pattern or distribution in the data. In change point detection, we assume that data before the change point conforms to one distribu-tion, while data after the change point comes from a second, different distribution. In our case, we are interested in identifying where the change has occurred, as soon as possible after it occurs.
Many algorithms have been proposed to detect change points. Most work on univariate time series, and use the entire time series to detect change points. We will focus on techniques that can be used with multivariate time series:
bcp
The Bayesian change point detection of Barry and Hartigan (1993) assumes that each block between two change points arises from a (multivariate) normal distribution. It outputs the posterior probability that a change occurred at each point in the time series. We use the implementation from theRpackagebcp
(Erdman and Emerson, 2007), which runs in time linear in the length of the time series, and handles multivariate time series. The biggest limitations are that it is designed to detect changes in the mean of independent Gaussian observations, and that it works retrospectively, once the entire time series is available.
ecp
The nonparametric, hierarchical divisive algorithm of James and Matteson (2015) uses recursive bisec-tions, identifying change points using a non-parametric divergence measure from Sz´ekely and Rizzo (2005). As the divergence measure is non-parametric, this makesecpsuitable to detect changes with minimal assumptions on the underlying distributions. The divisive approach by recursive bisections re-turns a number of consecutivesegmentsbetween change points, without knowing the number of change pointsa priori. In addition, the implementation from theRpackageecphandles multivariate time se-ries. One remaining limitation is that it works only in retrospective mode, once the entire time series is available.
ocp
The Bayesian online change point detection algorithm of Adams and MacKay (2007) addresses that issue. It is designed to update the detection of change points sequentially, as new data points are acquired, rather than wait until the entire times series are available. It relies on two components: a probabilistic modelP(rt|s(1. . . t))of the length of a runduring which the underlying distribution is stable, given
observations until timet; and an underlying predictive model (UPM)P(s(t+ 1)|s(1. . . t), rt)governing
the stochastic generation of new data in each run. Our basic implementation, available in theRpackage
onlineCPD,1uses a multivariate Gaussian UPM.
ocp+
We extend theocpalgorithm beyond the Gaussian assumption by using a more flexible UPM, modeling linear trends within each run, using a multivariate linear regression with additive Gaussian noise. This allows modeling drifts in the time series without forcing multiple change points. Our implementation is also available in theonlineCPD Rpackage available from github.
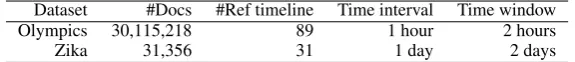
Table 1: Statistics on our two benchmark datasets.
Dataset #Docs #Ref timeline Time interval Time window
Olympics 30,115,218 89 1 hour 2 hours
Zika 31,356 31 1 day 2 days
4 Experiments
4.1 Datasets
To test the performance of our various combinations of online LDA and online CPD, we collected two datasets. One large collection of tweets related to the 2014 Sochi Winter Olympics, and a collection of public health news articles related to the 2015-2016 Zika epidemics. Statistics are shown in Table 1.
The 2014 Sochi Winter Olympics Twitter dataset was collected from the Twitter API during the whole olympic games period (Feb. 6-24th, 2014). Keywords such as “Sochi”, “Olympics” were used to filter tweets. The dataset contains 3,115,218 tweets after removing re-tweets and non-English tweets. The reference events were collected from Wikipedia,2 considering finals for most event, plus quarterfinals, semifinals, bronze and gold medal games for ice hockey, which adds up to 89 reference change points.
During the outbreak of Zika virus from 2015 to 2016, we collected news articles from November 3rd 2015 to December 31st 2016 on the GPHIN system.3 News articles from a variety of sources were collected and translated into English, named entities and medical terms were identified, then keywords like “Zika” and “mysterious disease” were used to filter news articles (Carter, 2018). The final, filtered Zika dataset contains 31,356 news articles. The original reference events were collected from a web source.4 Events on the same or subsequent days were combined into one, and the final gold standard contains 31 reference change points.
4.2 Evaluation
The performances of change point detection methods were measured by comparing detected change points with known reference events, using precision, recall and F-score. We count a detection as a true positive if it falls into the tolerance time window (Table 1, last column) of the reference change point, based on the order of references. The precision is computed by dividing true positives by all detections, while recall is computed by dividing true positives by total references, and the F-score is:
F = 2×Precision×Recall
Precision+Recall
4.3 Experimental settings
In the experiments, we compare two types of LDA models, standard (LDA) and on-line (oLDA∞t ), and two categories of CPD algorithms, retrospective or off-line CPD (bcpandecp) and real-time or on-line CPD (ocpandocp+). We used the implementation of standard LDA from theRpackagetext2vec
(Selivanov, 2016) and adapted oLDA∞t from the code made available by Zhai and Boyd-Graber (2013).5
5 Results
We first examine whether the top words and top documents extracted from the topic models represent topic changes over time. We then compare four methods of generating time series for CPD from the on-line topic model. We also compare the performance of CPD using the on-line topic model versus the off-line topic model and a baseline using counts. Finally, we check how various CPD algorithms work in a simulated real-time experiment, and analyze the errors made by the different methods.
2https://en.wikipedia.org/wiki/2014_Winter_Olympics
3https://gphin.canada.ca/cepr/aboutgphin-rmispenbref.jsp
4
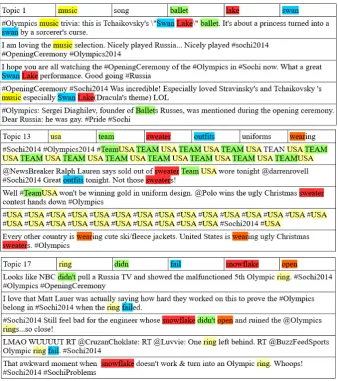
Figure 1: Top words (colored) and top documents for three topics from the Olympics opening ceremony: the beautiful Ballet, the strange US team uniform, and the malfunctioning 5th ring.
5.1 Validating topics from LDA and oLDA∞t
We first run a sanity check on the topic models, with qualitative and quantitative evaluations of the resulting topics.
Figure 1 shows the top words and top documents from the LDA model of the Olympics opening ceremony, withK= 20topics. Top words from topics 1, 13 and 17 are shown with colored backgrounds in the top 5 documents for each topic. Top documents (i.e. tweets, in that collection) provide more context than the top words, and clearly show that the topics are related to the ballet (topic 1), the US team uniform (topic 13) and the malfunctioning fifth ring (topic 17).
For a quantitative validation, we compare top documents extracted from the LDA and oLDA∞t models to the reference change points. The top documents for each topic were extracted from the portion of the document-topic distribution table corresponding to the time slot for a reference sub-event, and compared to its description. For example, at 19:00 on Feb. 22nd, the sub-event is the ice hockey bronze medal game between US and Finland. Top tweet “Ice hockey USA vs Finland now #sochi” in one topic is counted as a correct match, whereas “Go Finland ice hockey team! #sochi” is not, as it does not refer to a specific game. Whenever one top document from one topic matches with the reference, this is counted as the topic model (LDA or oLDA∞t ) correctly matching a sub-event. The rate of matching references for each model is reported in Table 2.
Table 2: Percentage of reference sub-events matched by LDA and oLDA∞t top documents.
Dataset K #Top docs #Ref changes LDA oLDA∞t Olympics 20 5 89 70.89% 79.75%
Zika 5 5 31 54.83% 74.18%
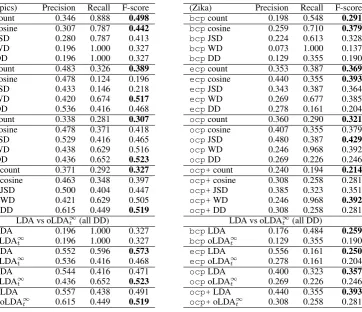
Table 3: Experimental results on Olympics (left) and Zika (right) data. Top: performance of CPD of four methods for representing topic change: cosine distance, JSD distance, word-topic distribution and document-topic distribution. Bottom: performance of CPD on LDA and oLDA∞t .
(Olympics) Precision Recall F-score
locally-transmitted Zika infections. A top document with title “Singapore confirms the first case of Zika virus transmitted locally” is counted as correct, whereas “FDA: Screen all blood donations for Zika” in another topic is not. Results in Table 2 show that top documents from LDA and oLDA∞t match the majority of reference change points in both datasets. Top documents from oLDA∞t clearly match
better than standard LDA. As oLDA∞t updates the word-topic distribution on-line, adding new words as necessary, top documents can better reflect recent change.
5.2 Comparing Topic Change Time Series
We compare the different approaches to encode topic change into time series, as described in Section 3.2: cosine distance, JSD, word-topic (WD) and the document-topic (DD) distributions. We compare with a simple count-based baseline, where the time series is simply the number of document in each time slot. Table 3 (left) shows the performance obtained on the Olympics dataset. The word-topic distribution (WD) and document-topic distribution (DD) time series perform better than the cosine and JSD time series forecp,ocpandocp+. The reverse is true forbcp, although its best performance is lower than the other three CPD algorithms, and lower than using the count baseline. All topic change time series perform better than counts forocpandocp+. Overall best results are obtained by the DD time series and on-line change point detection.
as on the Olympics dataset, but time series derived from the on-line topic models outperform, in some configuration, the count baseline. The best performance is obtained byocp on the JSD distance, fol-lowed by cosine distance onecp, and the word-topic distribution onocp andocp+. ecp, ocp and
ocp+perform better thanbcpagain. Top performance (.429) is also lower than on the Olympics dataset (.523).
The Olympics and Zika datasets are quite different: the Olympics dataset has many documents in each time interval, whereas the Zika dataset is very sparse in the first several months. Documents from different topics in Zika are quite similar at first, and become much diverse later. The JSD and word-topic distribution can capture such changes of topics, but the changes in the document-topic distribution are subtle. Among these methods, only the document-topic distribution (DD) can be applied in both off-line and on-line topic models. The other three methods use the dynamic word-topic distribution at each time slot. Since the performance of the DD time series is best on the Olympic dataset and reasonable on the Zika dataset, we adopt that method in the following experiments.
5.3 Off-line vs. On-line Topic Models
We now focus on the difference between the off-line and on-line LDA. We use the document-topic distri-bution from LDA and oLDA∞t to produce time series on which we run the four CPD algorithms. Results are reported at the bottom of Table 3. On the Olympics dataset, the performance of CPD from LDA and oLDA∞t are much better than the baseline except onbcp. This confirms that the topic time series
extracted from LDA and oLDA∞t help detect relevant changes. The off-line LDA degrades performance ofocpandocp+but improves that ofecp, which reaches the top performance on that dataset. On the Zika data set, the performance is better on the LDA time series than on oLDA∞t . Forbcpandecpthe performance stays below that of the baseline counts, suggesting that information from the topic model either does not help for these algorithms, or does not fit well with their underlying modeling assump-tions. This may be due again to the smaller number of documents in the Zika dataset, and lower number of documents in the earlier time period. Note that although LDA yields better performance than oLDA∞t on the Zika dataset, the on-line topic model offers a key functionality: the topic model can be estimated in real-time as documents are acquired. The time series can then be build on-line and change detection can be applied on-line as well, in order to produce real-time change detection.
5.4 On-line Change Point Detection
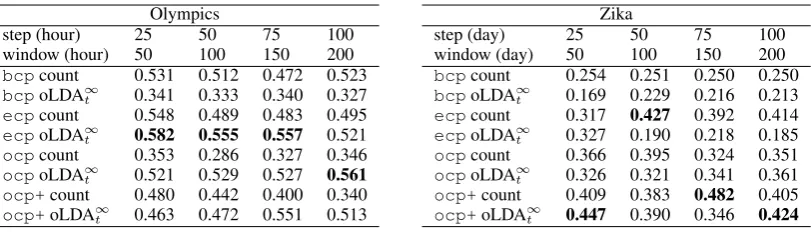
The above change point detection experiments were performed in a off-line mode forbcpandecp, and for all CPD algorithms using LDA: CPD algorithms read all data points at all time intervals at once. For real-time detection, however, it is necessary to test the performance in a real on-line fashion. In order to simulate that withbcpandecp, we use a sliding window, feeding the algorithm overlapping slices of the data, step by step. Althoughocpandocp+are built as on-line CPD algorithms, processing one new data point at a time, we used the same sliding window to get a fair comparison. On the Olympics and Zika datasets, we tested different sliding window sizes and steps to evaluate the impact of this size on performance. Table 4 shows the result obtained by the four CPD algorithms on either oLDA∞t topic scores or baseline message counts. On the Olympics data, oLDA∞t performs better than counts in all CPD algorithms exceptbcp. With smaller steps and window sizes,ecpperforms the best.ocpperforms best on the largest step and sliding window sizes (100 and 200 hours, respectively). The best performance for different settings (bold) are very close. On the Zika data, the performance of CPD algorithms on counts and oLDA∞t are not consistent. ocp+reaches the best performance on counts using a 150 day window size in 75 day steps, and performs well on oLDA∞t in two other settings, whileecp performs well on counts in the remaining situation (100 day window, 50 day steps). Comparing the best performance obtained in off-line and on-line modes on these two datasets (Table 3 vs. Table 4), we see that the on-line CPD algorithms using sliding windows achieve better performance than using the entire data set off-line.
5.5 Error Analysis
Table 4: F-score of oLDA∞t versus counts, using several sliding window and step sizes.
Olympics
step (hour) 25 50 75 100
window (hour) 50 100 150 200 bcpcount 0.531 0.512 0.472 0.523 bcpoLDA∞t 0.341 0.333 0.340 0.327
ecpcount 0.548 0.489 0.483 0.495
ecpoLDA∞t 0.582 0.555 0.557 0.521
ocpcount 0.353 0.286 0.327 0.346 ocpoLDA∞t 0.521 0.529 0.527 0.561
ocp+count 0.480 0.442 0.400 0.340 ocp+oLDA∞t 0.463 0.472 0.551 0.513
Zika
step (day) 25 50 75 100
window (day) 50 100 150 200
bcpcount 0.254 0.251 0.250 0.250 bcpoLDA∞t 0.169 0.229 0.216 0.213
ecpcount 0.317 0.427 0.392 0.414 ecpoLDA∞t 0.327 0.190 0.218 0.185
ocpcount 0.366 0.395 0.324 0.351 ocpoLDA∞t 0.326 0.321 0.341 0.361
ocp+count 0.409 0.383 0.482 0.405
ocp+oLDA∞t 0.447 0.390 0.346 0.424
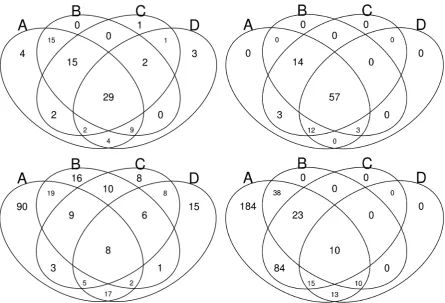
algorithms on the Olympics dataset in the sliding window setting of 100 hours steps and 200 hours window size (Figure 2). From the top true positives (top), we observe that on oLDA∞t topic scores, all change-point detection algorithms agree much more on the detected sub-events (57 out of 89) than using message counts. All reference sub-events are identified by at least two of four CPD methods. This demonstrates that the document distribution from oLDA∞t tracks topic change much better than the raw volume of tweets. In addition, combining the results of four CPD methods might lead to better performance than using any of them alone. Also, looking at the performance of the two off-line and the two off-line methods, we observe that the detected sub-events are more consistent within these two sub-groups than between them, using either counts or oLDA∞t .
False positives, shown at the bottom of Fig. 2 are much less consistent across CPD algorithms. Few false positives are detected by all four CPD algorithms. In addition, it is clear that using either counts or oLDA∞t topic scores, bcp generates many more false positives than the other three methods. In
particular, on oLDA∞t none of the other three method generate a full positive that is not also produced by
bcp. This is reflected in the high recall obtained bybcp(Table 3), at the expense of a very low precision.
ocpalso suffers from a large number of false positives on oLDA∞t . On the contrary,ocp+ generates
few false positives, yielding hogh precision but lower recall. Overall, the combination of oLDA∞t and
ocp+reaches the highest true positive rate and lowest false positive rate on the Olympics dataset.
6 Summary
Our study examined real-time detection of topic changes from document streams. The main outcome from the experiments is that real-time CPD based on the topic change detected by on-line topic models can reach good performance, identifying more than half the unknown reference changes from content alone. We also show that top documents extracted from oLDA∞t match reference change point
descrip-tions better than from LDA. This shows that oLDA∞t captures the dynamic changes inside each topic. We compared four methods of representing topic evolution as time series and evaluated them against reference change points. In the news article stream, the univariate time series based on the JSD distance performed well, while on the large tweet collection, tracking the multivariate document-topic distribution time series performed better. This suggests that selecting the best methods of representing topic evolution for detecting topic changes may depend on the type and genre of documents and remains a challenge.
Our experiments compared off-line with on-line topic models and also off-line CPD with on-line CPD in different settings. The on-line topic model oLDA∞t yields better performance than off-line LDA on the Olympics dataset, but worse performance on the Zika dataset. Also, on-line CPD algorithmsocp
andocp+did better than off-line CPD algorithmsbcpandecpon both datasets. The combination of on-line topic modeling with the on-line change point detection reaches top performance in topic change detection in our simulated real-time conditions. This demonstrates that our method is promising for real document streaming applications.
7 Conclusion
Figure 2: The number of true positives (Top) and false positives (Bottom) detected by A:bcp, B:ecp, C:ocp, D:ocp+on all sub-events of the Olympics data, using counts (Left) and oLDA∞t (Right).
representing topic change time series were explored, and several off-line and on-line modes were ex-plored. Extensive experiments with off-line and on-line topic models and with retrospective and on-line change point detection on one Twitter dataset and one news article dataset confirm that the combination of oLDA∞t andocp+yield top performance, identifying up to 56% of reference changes in real-time mode on our large twitter collection. Although some off-line combinations yield similar, and sometimes slightly higher performance, the fully on-line combination is always competitive, while offering the ben-efit of true real-time detection. The CPD algorithms can also be applied to detect changes in other aspect of document streams such as sentiment or emotion.
Acknowledgments
We would like to thank Zachary Zanussi’s contribution to develop theonlineCPDpackage and Fang-ming Liao’s contribution to part of the experiments and for Figure 1.
References
Ryan Prescott Adams and David J.C. MacKay. 2007. Bayesian online changepoint detection. arXiv:0710.3742.
Daniel Barry and J. A. Hartigan. 1993. A Bayesian Analysis for Change Point Problems. Journal of the American Statistical Association, 88(421):309–319.
David M. Blei and John D. Lafferty. 2006. Dynamic topic models. InProceedings of the 23rd International Conference on Machine Learning, pages 113–120, New York, NY. ACM.
Daniel Bruggermann, Yannik Hermey, Carsten Orth, Darius Schneider, Stefan Selzer, and Gerasimos Spanakis. 2016. Storyline detection and tracking using dynamic latent dirichlet allocation. InProceedings of the 2nd Workshop on Computing News Storylines (CNS 2016), pages 9–19, Austin, Texas, November. ACM.
Dave Carter. 2018. Revitalizing the Global Public Health Intelligence Network (GPHIN).Online journal of public health informatics, 10(1).
Chandra Erdman and John Emerson. 2007. bcp: An R package for performing a bayesian analysis of change point problems. Journal of Statistical Software, 23(1):1–13.
Thomas Ertl, Junghoon Chae, Ross Maciejewski, Harald Bosch, Dennis Thom, Yun Jang, and David S. Ebert. 2012. Spatiotemporal social media analytics for abnormal event detection and examination using seasonal-trend decomposition. InProceedings of the 2012 IEEE Conference on Visual Analytics Science and Technology (VAST), pages 143–152, Washington, DC. IEEE Computer Society.
Cyril Goutte, Yunli Wang, Fangming Liao, Zachary Zanussi, Samuel Larkin, and Yuri Grinberg. 2018. Eu-rogames16: Evaluating change detection in online conversation. InProceedings of the 11th Language Resource and Evaluation Conference.
Valery Guralnik and Jaideep Srivastava. 1999. Event detection from time series data. InProceedings of the Fifth ACM SIGKDD International Conference on Knowledge Discovery and Data Mining, pages 33–42, New York, NY. ACM.
Mahmud Hasan, Mehmet A. Orgun, and Rolf Schwitter. 2017. A survey on real-time event detection from the twitter data stream. Journal of Information Science.
Matthew D. Hoffman, David M. Blei, and Francis Bach. 2010. Online learning for latent dirichlet allocation. In
Proceedings of the 23rd International Conference on Neural Information Processing Systems, pages 856–864. Curran Associates Inc.
Nicholas A. James and David Matteson. 2015. ecp: An R package for nonparametric multiple change point analysis of multivariate data. Journal of Statistical Software, 62(1):1–25.
Nicholas A. James, A. Kejariwal, and David S. Matteson. 2016. Leveraging cloud data to mitigate user experience from ”breaking bad”. In2016 IEEE International Conference on Big Data (Big Data), pages 3499–3508, Dec.
Jey Han Lau, Nigel Collier, and Timothy Baldwin. 2012. On-line trend analysis with topic models: #twitter trends detection topic model online. InProceedings of COLING 2012, pages 1519–1534, Mumbai, India, December.
Alexei Pozdnoukhov and Christian Kaiser. 2011. Space-time dynamics of topics in streaming text. InProceedings of the 3rd ACM SIGSPATIAL International Workshop on Location-Based Social Networks, pages 1–8, New York, NY. ACM.
Dmitriy Selivanov, 2016.text2vec: Modern Text Mining Framework for R. R package version 0.4.0.
G´abor J. Sz´ekely and Maria L. Rizzo. 2005. Hierarchical clustering via joint between-within distances: Extending ward’s minimum variance method. Journal of Classification, 22(2):151–183.
Konstantinos N. Vavliakis, Fani A. Tzima, and Pericles A. Mitkas. 2012. Event detection via LDA for the MediaEval 2012 SED task. InProc. MediaEval.
Yunli Wang and Cyril Goutte. 2017. Detecting changes in twitter streams using temporal clusters of hashtags. InProceedings of the Events and Stories in the News Workshop, pages 10–14. Association for Computational Linguistics.
Ke Zhai and Jordan Boyd-Graber. 2013. Online latent dirichlet allocation with infinite vocabulary. InProceedings of the 30th International Conference on International Conference on Machine Learning, pages I–561–569.