Pressure dependence of the static structure of
liquid GeTe based on
ab initio
molecular
dynamics simulations
Akihide Koura1,*, and Fuyuki Shimojo1
1Depertment of Physics, Kumamoto University, Kumamoto 860-8555, Japan
Abstract. We have investigated the pressure dependence of the static structure of liquid GeTe based on ab initio molecular dynamics simulations. The pressure range is between ambient pressure and 250 GPa, and their temperatures between 1000 K and 4000 K, which keep the liquid state. In this study, we found two transition stages caused by the compression. At the first stage, below 12 GPa, atomic distances elongate and Peierls-type distortion is dissolved with increasing pressure. At the second stage, above 12 GPa, atomic distances shorten and the electronic states shows metallic.
1 Introduction
Germanium tellurides (GeTe) are interesting materials because of their semi-conducting properties and the fast phase transition, e.g., Ge-Sb-Te. Crystalline GeTe at room temperature has A7 structure, which is distorted from fcc rocksalt (B1) to expand (111) direction. This distortion is named as Peierls distortion. In this state, Ge atoms and Te atoms are threefold coordinated each other. When the temperature increases up to about 700 K, GeTe changes from A7 to B1 structure, where Ge and Te atoms are sixfold coordinated each other. When the temperature increases up to about 1000 K, crystalline GeTe melts and its coordination number becomes approximately 3-4, i.e., the Peierls-type A7 structure appears again [1].
On the other hand, compression also induces the structural change of crystalline GeTe. When pressure increases up to around 3 GPa, GeTe changes from A7 to rocksalt structure. It has been suggested that, under further compression, GeTe eventually becomes bcc (CsCl-type) structure at 40-50 GPa, through several structural changes [2]. The pressure dependence of the structure of the liquid state was also reported by X-ray diffraction measurements [3], which suggest that the structural change in the liquid state is different from that in the crystalline state. However, the details are not clarified yet.
In this study, we investigate the pressure dependence of the static structure of liquid GeTe based on ab initio molecular dynamics (AIMD) simulations, in which the electronic structure is calculated in the framework of the density functional theory with the generalized gradient approximation. The temperature and pressure ranges are from 1000 to 4000 K and from 0 to 250 GPa, respectively.
2 Numerical details
We have carried out the calculations by using AIMD simulations, in which the electronic states were calculated by the projector-augmented-wave (PAW) method [4,5] within the framework of the density functional theory (DFT) in which the generalized gradient approximation (GGA) [6] was used for the exchange-correlation energy. The plane wave cutoff energies are 9 and 90 Ry for the electronic wave functions and the pseudo-charge density, respectively. The energy functional was minimized using an iterative scheme [7,8]. The point was used for Brillouin-zone sampling. Projector functions of the s, p, and
d types were generated for the 4s, 4p, and 4d states of Ge, and the 5s, 5p, and 5d states of Te. By investigating the energy dependence of the logarithmic derivatives of the pseudo-wave functions, we verified that our data sets have good transferability, and do not possess any ghost states in the energy range considered.
Molecular-dynamics simulations were carried out at pressures from approximately 0 to 250 GPa and the temperature T = 1000-4000 K. The number densities ȡ, the pressures P
and the temperature T used in our simulations are listed in Table I. They were determined from the averaging result of the isothermal-isobaric MD simulations at least 1500 MD steps (4.35 ps). We used a 128-atom systems in a cubic supercell with periodic boundary conditions. Using Nosé-Hoover thermostat technique [9,10], the equations of motion were solved via an explicit reversible integrator [111] with a time step of t
= 2.9 fs. The quantities of interest were obtained by averaging over 29 ps after an initial equilibration taking at least 1.5 ps.
3 Results and discussion
3.1 Static structure factors
Figure 1 shows the pressure dependence of the static structure
Table 1. Calculated conditions. Pressure P,
temperature T, number density ȡ, and the ratio of volume V/V0, where V0 is the volume at ambient condition.
P (GPa) T (K) ȡ (10-2 Å-3) V/V 0
0.0 1000 2.99 1.000
1.4 1000 3.35 0.892
4.1 1000 3.72 0.803
5.9 1000 3.89 0.769
11.9 1000 4.32 0.692
23.9 1500 4.80 0.623
47.8 2000 5.50 0.542
96.0 2500 6.49 0.460
129.4 2500 7.04 0.424
211.9 3500 7.99 0.374
factors (a) SX(k) using X-ray form factor and (b) Sn(k) neutron scattering length. Our results
shown by solid lines are in good agreement with experimental results [3] illustrated by circles at wide pressure range.
The height of the first sharp diffraction peak (FSDP) of Sn(k) at about k = 1.0 Å-1 decreases
with increasing pressure, and the FSDP disappears at 4.1 GPa. The disappearance of the FSDP suggests the change of the medium range order. The first peak position shifts from k
= 2.2 to 3.0 Å-1 with increasing pressure.
3.2 Pair distribution functions
The pressure dependence of the total and partial pair distribution functions g(r) and g(r) are
shown in Fig. 1(c) and 1(d)-(f), respectively.
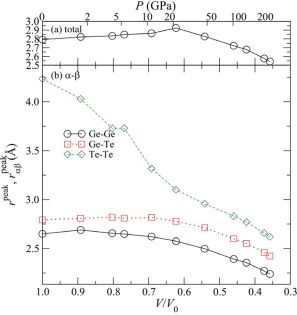
The first and second peaks of g(r) exist at approximately r = 2.8 and 4.2 Å. The second peak shifts toward smaller r with increasing pressure, and it becomes a shoulder of the first peak between 4.1-5.9 GPa. Under further compression, the first peak position shifts toward smaller r. The partial correlation functions gGeGe(r) and gGeTe(r) have their first peaks at about r = 2.6 and 2.8 Å.
Figure 1. The pressure dependence of the static structure factors (a) SX(k) and (b) Sn(k) using X-ray form factor and neutron scattering length, respectively. Circles show the result of experiment [3]. The pressure dependence of the (c) total and (d)-(f) partial pair distribution functions g(r) and
The pressure dependence of the first peak positions of g(r) and gDE(r) is shown in Fig. 2. Figure 2 suggests that there are two stages compression process. The first stage appears below 12 GPa. In this stage, the peak position of g(r) elongates from r = 2.8 to 2.9 Å. While peak positions of gGeGe(r) and gGeTe(r) do not change so much. On the other hand, that of gTeTe(r)
shortens drastically, however, this change is caused by the difficulty to determine precisely the peak position of gTeTe(r) and growth of the first peak at around r = 3 Å. In the second
stage, above 12 GPa, all positions of the first peaks shift monotonically to smaller r with increasing pressure. The temperature effect of the change between 12-24 GPa is discussed in the section 3.8.
3.3 Coordination numbers
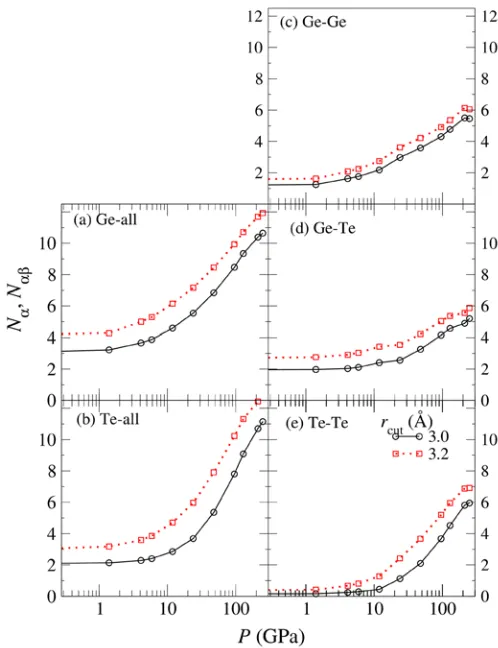
Figure 3 shows the pressure dependence of the coordination numbers (a)-(b) ND and (c)-(e)
NDE. Solid lines with circles and dotted lines with squares correspond to cutoff distances rc =
3.0 and 3.2 Å, respectively. The former, rc = 3.0 Å, and the latter, rc = 3.2 Å, correspond to
the short bond length caused by Peierls distortion in the crystalline state, where the coordination number should be 3, and the first minimum position of g(r), respectively. Dashed lines with diamonds show values obtained by integration of gDE(r) until the first peak position rpeak, and then the values are doubled, i.e., if the shape of first peak of gDE(r) would
be symmetric, the pressure dependence of dashed lines would show a similar tendency as that of the other lines.
In Fig. 3(a), the solid line shows that NGe at ambient pressure is almost 3, however, NGeTe
at ambient pressure is 2. If GeTe is in the crystalline state, NGeTe should be 3. While, in the
liquid state, although NGeTe is only 2, Ge-Ge homopolar bond appears (NGeGe = 1) and this
supplements the lack of Ge-Te bonds. With increasing pressure, ND and NDE does not change Figure 3. The pressure dependence of coordination numbers (a)-(b) ND
much below 12 GPa. However, above 12 GPa, both ND and NDE increase rapidly with compression. The appearance of a difference between NDE using rpeak and other rc suggests
the existence of a new local order at high pressure.
3.4 Three-body bond angle distributions
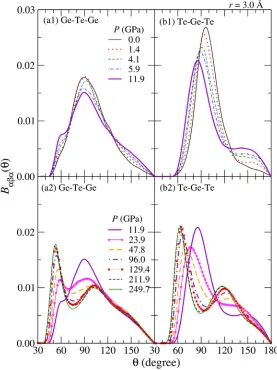
Figure 4 shows the pressure dependence of the three-body bond angle distributions BDED(T). A cutoff distance of rc = 3.0 Å is used. The top panels (a1) and (b1) correspond to the pressure
range from 0.0 to 11.9 GPa, and the bottom panels (a2) and (b2) show BDED(T) at the pressures above 11.9 GPa, respectively.
At ambient pressure, which shown by black solid lines in the top panels, BGeTeGe(T) and BTeGeTe(T) have each peak at about T = 90°. The profile of BGeTeGe(T) is slightly wider than
that of BTeGeTe(T). This is a result of high mobility of Ge atoms. With increasing pressure, the
Figure 4. The pressure dependence of three-body bond angle distributions (a1)-(a2)
height of the main peak of BDED(T~90°) decreases, and the peak position of BTeGeTe(T) shifts
toward smaller T. Under further compression, the height of the main peak at approximate T = 90° decreases and a new peak atT = 60° appears above 24 GPa. The bond angle T = 60° suggests that the liquid GeTe at 250 GPa is similar to bcc crystalline state.
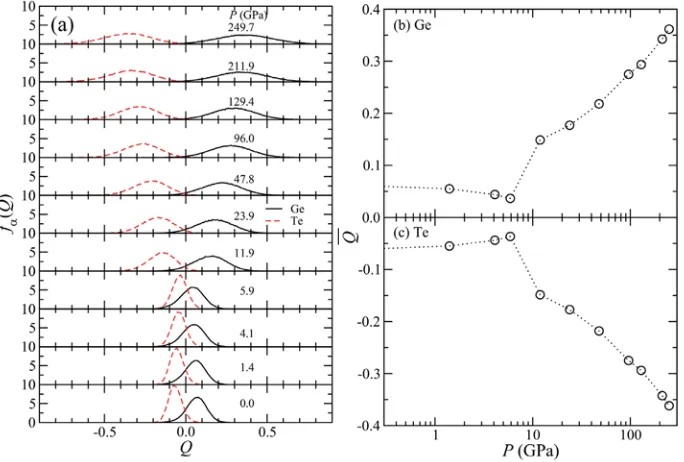
3.5 Mulliken charges
Figure 5 shows the pressure dependence of (a) the charge distribution fD(Q) and (b)-(c) their average values . At ambient and low pressure range, fGe(Q) and fTe(Q) exist at almost Q =
0. With increasing pressure, the distribution fD(Q) and their averages do not change so much below 12 GPa. However, for furthermore compression, fD(Q) become wider and leave the range of Q 0. In other words, covalent type liquid GeTe changes to more ionic type at approximately 12 GPa.
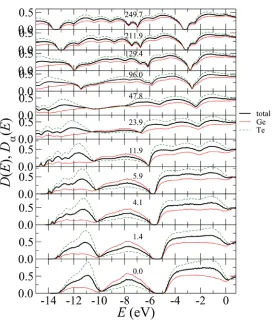
3.6 Electronic density of states
At ambient pressure, the total electronic density of states D(E) shows that liquid GeTe has semiconductor-type properties because D(E) at E = 0 (Fermi energy) has a dip in Fig.6. With increasing pressure, the dip at E = 0 becomes shallow, and it completely vanishes at 12GPa, i.e., a semiconductor-metal transition occurs at about 12 GPa.
3.7 Bond overlap populations
Figure 7(a)-(c) shows the time averaged bond overlap populations(). This figure focuses on the conditions which the structural and/or electronical properties changed
drastically. Here, the positive and negative regions of the horizontal axis show the covalent and anti bondings, respectively.
At ambient pressure, Ge-Te covalent bonds exist and Ge-Ge homopolar covalent bonds also appear in the liquid state. The average of the bond strength of Ge-Ge atoms is in the same order as that of Ge-Te atoms, while the number of Te-Te homopolar bonds is small. With increasing pressure, Ge-Ge and Ge-Te anti-bondings clearly appear at approximately 12 GPa. The number of Te-Te covalent bonds increases during the compression process.
In crystalline GeTe, Ge atoms and Te atoms have three short bonds to each other. The strength of the short bonds is much stronger than that of the other three long bonds. In the liquid state, the numbers of strong bond SB are estimated by integration of () for
>0.2, where GeTe() has a minimum at ambient pressure. The result of the estimation SB is shown by triangles with dashed-dotted lines in Figs.7(d)-(f). Focusing on numbers SB at ambient conditions, GeTeSB is 2.49 which is less than 3. However, there are Ge-Ge and Te-Te homopolar bonds, whose numbers SB and SB are 1.08 and 0.29, respectively. As a
Figure 6. Pressure dependence of the total and partial electornic densities of states D(E) and D(E), respectively. The bold line shows D(E). The thin solid
result, GeSB and TeSBare 3.57 and 2.78, i.e., environments around Ge and Te atoms are mostly kept as Peierls-type in the liquid state at ambient pressure. With increasing pressure, GeTeSB does not change much except for a small hump at about 12 GPa. The numbers of homopolar bonds GeGeSB and TeTeSB also do not change below about 12 GPa. However, both of them increase with increasing pressure above approximately 12 GPa. On the other hand, the numbers of covalent and anti bonding are calculated by integration of () for
> 0 and < 0, respectively. The former, CB, and the latter, AB, are shown by closed circles withdashed lines and open circles with solid lines in Figs.7(d)-(f), respectively. With increasing pressure, GeTeCB do not change below about 12 GPa. Under further compression, GeTeCB decreases with increasing pressure. Hence, the difference between GeTeCB and GeTeSB decreases in the high pressure region. This difference corresponds to the weak bonding in the type distortion, i.e., the decrease of the difference means the disappearance of the Peierls-type distortion in the high pressure region, where strong bonding is not distinguishable from
weak one (see Figs.7(a)-(c)). While, GeGeCB increases gently in this pressure range, the difference between GeGeCB and GeGeSB slightly decreases. For Te-Te bonding, TeTeCB increases monotonically below about 12 GPa. However, it becomes constant above 12 GPa. Above 12 GPa, the numbers of covalent bonding CB for all - pairs are almost 4, i.e., Ge and Te atoms have 8 covalent bonds, which is similar to the bcc crystalline structure. Numbers of anti
Figure 7. (a)-(c) Pressure dependence of the time averaged bond overlap populations
bonding AB slightly increase with increasing pressure below 12 GPa. At about 12 GPa, and TeTeAB jump up to 2.49 and 4.00, respectively. Under further compression,
AB increase with increasing pressure.
3.8 Temperature dependence
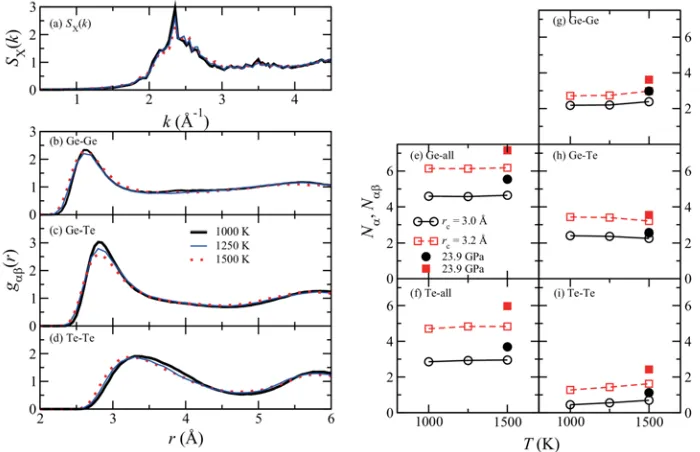
In order to discuss the pressure dependence of the structure carefully, additional calculations were performed using the same volume as 12 for GPa. The temperature increases from 1000 to 1250 K, and further to 1500 K. Static structure factors SX(k), partial correlation functions gDE(r), and coordination numbers ND and NDE were obtained by averaging 5000 MD steps (14.2 ps) after an initial equilibration taking at least 1.5 ps.
In Figs. 8(a)-(d), solid and dotted lines show the results at T = 1250 K and 1500 K, respectively. It is found that SX(k) at 1250 and 1500 K are quite similar with that at 1000 K
in Fig.8(a). On the other hand, for gDE(r), the heights of the first peaks seem to be slightly lower and the width of gGeGe(r) becomes slightly wider than that at T = 1000 K. Positions of gGeTe(r) and gTeTe(r) at high temperatures slightly shift toward smaller r. However, the
temperature effect for SX(k) and gDE(r) is considerably smaller than the pressure induced
structural change.
The temperature dependence of the coordination numbers ND and NDE at about 12 GPa is shown in Fig.8(e)-(i). The solid line with open circles and dashed line with open squares
Figure 8. (a) Temperature dependence of the static structure factors SX(k) and (b)-(d)
that of partial distribution functions gDE(r). Bold solid lines show the same as shown in Fig.1. Thin solid and dotted lines indicate the result at T = 1250 and 1500 K, respectivaly. (e)-(i) Temperature dependence of coordination numbers ND and NDE at about 12 GPa. Circles and squares correspond to cutoff distances rc = 3.0 and 3.2Å, respectively. Closed
show coordination numbers at about 12 GPa using cutoff distances rc = 3.0 and 3.2 Å,
respectively. Closed symbols indicate results at about 24 GPa. It is clearly seen that the temperature effect is much smaller than the pressure effect.
4 Conclusion
We have investigated the pressure dependence of the static structure of liquid GeTe under pressure based on ab initio molecular dynamics simulations. Our simulation shows that the structure of the liquid changes in two stages under pressure. In the first stage below 12 GPa, the Peierls-type distortion in the liquid state was completely dissolved. In this pressure range, the nearest neighbour distance becomes longer, and the semiconducting properties are maintained. It seems that semiconductor-metallic transition occurs at approximately 12 GPa. In the second stage above 12 GPa, the nearest neighbour distance shortens. The coordination number reaches about 13.7 at 250 GPa, which is quite similar to that of CsCl-type crystalline state with taking the second neighbour into account.
Acknowledgements
One of the authors (A.K.) thanks the Murata Science Foundation for the financial support to attend the LAM-16 conference. This work was supported by JSPS KAKENHI Grant Number JP16K05478. The authors acknowledge the Supercomputer Center, Institute for Solid State Physics, University of Tokyo and the Research Institute for Information Technology, Kyushu University for the use of their facilities.
References
1. J. Y. Raty, V. Godlevsky, P. Ghosez, C. Bichara, J. P. Gaspard, and J. R. Chelikowsky, Phys. Rev. Lett. 85, 1950 (2000).
2. Gap-Soek Do, et al., Phys. Rev. B 82, 054121 (2010).
3. M. Tomomasa, T. Higaki, T. Hayakawa, A. Chiba, and K. Tsuji, J. Phys.: Conf. Ser. 121, 022007 (2008).
4. P. E. Blöchl, Phys. Rev. B 50, 17953 (1994).
5. G. Kresse and D. Joubert, Phys. Rev. B 59, 1758 (1999).
6. J. P. Perdew, K. Bruke, and M. Ernzerhof, Phys. Rev. Lett. 77, 3865 (1996).
7. F. Shimojo, R. K. Kalia, A. Nakano, and P. Vashishta, Comput. Phys. Commun. 140, 303 (2001).
8. G. Kresse and J. Hafner, Phys. Rev. B 49, 14251 (1994). 9. S. Nosé, Molecular Physics 52, 255 (1984).
10. W. G. Hoover, Phys. Rev. A 31, 1695 (1985).

![Figure 1. The pressure dependence of the static structure factors (a) g[3]. The pressure dependence of the (c) total and (d)-(f) partial pair distribution functions SX(k) and (b) Sn(k) using X-ray form factor and neutron scattering length, respectively](https://thumb-us.123doks.com/thumbv2/123dok_us/8133919.1355623/3.482.71.410.178.428/pressure-dependence-structure-dependence-distribution-functions-scattering-respectively.webp)