DEVELOPMENT OF EVALUATION METHOD FOR SEISMIC
ISOLATION SYSTEMS OF NUCLEAR POWER FACILITIES
-
PROPOSAL FOR A BASE-ISOLATED DESIGN METHODOLOGY TO
INSTALL NPP’S FACILITIES
-Hiroshi Shimizu1, Kotoyo Mizuno2, Masakazu Jimbo3, Shinji Kosugi4, Tsutomu Hirotani5, Takemi Norimono6 and Yasuo Ookouchi7
1
Research Manager, Structure No.1 Lab., Strength Research Dept., Research & Innovation Center, Mitsubishi Heavy Industries, Ltd., Japan
2 Staff, Structure No.1 Lab., Strength Research Dept., Research & Innovation Center, Mitsubishi Heavy
Industries, Ltd., Japan
3 Chief Specialist, Plant Design & Engineering Dept., Isogo Nuclear Engineering Center, Toshiba Corporation
Power Systems Company, Japan
4 Researcher, Aseismic Engineering Sec., Nuclear Plant Engineering Dept., Hitachi-GE Nuclear Energy, Ltd,
Japan 5
Manager, Technology Dept., Nuclear Projects Div., Shimizu Corporation, Japan 6
Senior Manager, Power Facilities, Engineering Dept., Takenaka Corporation, Japan 7
Assistant Manager, Nuclear Power Plant Architectural Engineering Section, Civle & Architectural Dept., Chubu Electric Power Co. Inc., Japan
ABSTRACT
Since the 1995 Hyogo-ken Nanbu (Kobe) Earthquake, base isolation systems have been installed in many buildings in Japan. In the 2011 off the Pacific coast of Tohoku Earthquake, it could be confirmed that many base-isolated buildings had enough seismic resistance and succeeded in functional maintenance against the huge earthquake. Nuclear power plants in Japan have partly installed base-isolation systems to maintain the function of the nuclear facilities against a huge earthquake; however, a base-isolated reactor building has never been seen in Japan.
In order to maintain the integrity of reactor buildings against huge earthquakes in the future, base isolation systems are effective approaches. Therefore, under the auspices of the Ministry of Economy, Trade and Industry of Japan (METI), domestic power companies and reactor venders have been engaged in promoting a development project of seismic isolation systems for NPPs through 2008 to 2015.
This paper proposes a base isolation design methodology to install NPP’s facilities, based on the results in the characteristic tests of full-scale isolators that adopted the Lead Rubber Bearing (LRB), the demonstration of a base-isolation pedestal, and the seismic response analysis by the three-dimensional finite element method (3D FEM) and a multi-degree-of-freedom (MDOF) stick model, all of which have been implemented in this development project.
INTRODUCTION
Not many seismic isolated buildings are used for domestic NPP facilities. However, application of the seismic isolation technology to important anti-seismic buildings is important as one of fundamental technologies to enhance earthquake-proof safety and realize standard design that doesn’t depend of conditions of the site.
In order to maintain the integrity of reactor buildings against huge earthquakes expected to occur in the future, base isolation systems are effective approaches. Therefore, as part of this study, domestic power companies and reactor venders have been promoting a development project of seismic isolation systems for NPP facilities through 2008 to 2015 under the auspices of METI.
design methodology sophisticated by seismic response analyses and various types of characteristic tests
with isolators. Especially, this project adopted a full-scale breaking test using LRB with a diameter ! of
1600 mm, where a huge scale event was assumed for the first time in the world.
Based on the results obtained in this project, this paper describes earthquake design motion, fundamental design properties, modeling approaches of isolators, seismic response analysis, and evaluation of seismic integrity as part of the seismic isolation design methodology to be applied to NPP facilities.
OUTLINE OF SEISMIC ISOLATION DESIGN
Target facilities
Figure 1 shows schematic views of light-water reactor building into which base-isolation systems are adopted. There are two major types of light-water reactors in Japan: pressurized-water reactors (PWR) and boiling-water reactors (BWR). With a target of these types of nuclear reactor buildings, this paper discusses the seismic isolation design methodology to install NPP facilities. Just to make sure, depending on the design seismic response, it is necessary to take into consideration a scope of applying seismic isolation not only a reactor building but also common base isolation including a turbine building.
Seismic isolation design flow
Figure 2 shows a seismic isolation design flow to apply to NPP facilities. The seismic isolation design begins with overall planning and proceeds to implementation of basic design and engineering for each division of a plant, namely seismic isolation systems, buildings, and equipment/piping. Earthquake-proof safety should be evaluated through a seismic response analysis to be made after modeling each division based on results of these basic design and engineering tasks. Furthermore, by adding evaluation on external events other than earthquakes, safety of NPP facilities where base isolation systems are applied should be confirmed to complete seismic isolation design.
Next, in order to deal with events beyond postulated ones used in design, an earthquake probabilistic risk assessment(PRA) should be made. The earthquake hazard curves should be formulated and fragility indices should be set. Based on information from them, a seismic response analysis should be made to calculate fragility of each division. Safety of the seismic isolation plant should be evaluated through calculation of a core damage frequency using results of the fragility calculation.
Items marked with green were actually the verification tests carried out in this project, and results of these
tests have been reported in 13th World Conference on Seismic Isolation㸪ASME PVP-2014 and other
international conferences. Based on the results of these demonstrations/tests, design methods of the seismic isolation systems, buildings, and equipment/piping have been constructed. Among these design methods, this paper intends to organize and describes the seismic isolation design methodology targeting design items marked with yellow in Figure 2.
STUDY ON SEISMIC ISOLATION DESIGN
Based on results from this project, this section describes earthquake design motion, fundamental design Figure 1. Schematic views of light-water reactor building
Division V
properties, modeling approaches of isolators, seismic response analysis, and evaluation of seismic integrity as part of the seismic isolation design methodology to be applied to NPP facilities.
Earthquake design grand motions
As for earthquake motions to be used in seismic isolation design, it is necessary to adopt and set motions with a long cycle and relatively long duration, assuming that they will have an influence on the natural period in a range of 2 to 4 seconds that is dominant in earthquake response.
From this point of view, the design earthquake ground motion (called the standard wave) shown in Figure 3 was adopted for setting. Specifically, in setting up the standard wave, the response acceleration on the short cycle side was set at 800 Gal, and the pseudo velocity response spectrum (h = 0.05) on the long cycle side was set at 200cm/sec (kine). Then three standard waves, Ss-H1, Ss-H2, and Ss-H3, were designed as artificial seismic waves in the horizontal direction with different phases. The earthquake wave motion in the vertical direction was set so as to be 2/3 times the motion in the horizontal direction.
Figure 2. Seismic isolation design flow to NPP facilities
Overall planning of a base-isolated building
Basic design of building Basic design of equipment/piping
Earthquake design grand motion
Seismic response analysis
Building models (MDOF stick model, 3D FE-model) Thermal effect of LRB
Evaluation of seismic integrity Allowable limit of LRB Tensile axial-force combination
Assessment of other external events (tsunami, tornado, etc.)
Fragility evaluation index㻌
Basic design of isolators Fundametal design properties Modeling approaches of isolators
䠖Scope covered by this paper Core damage frequency
Fragility of building Fragility of
equipment/piping Fragility of seismic isolation
systems
Evaluation of plant safety㻌 Seismic hazard curves㻌
Base-isolation pedestal scaled test㻌
Basic characteristics test of scaled LRBs Hardening test of quasi-full-scaled LRBs
Breaking test of full-scale LRBs
䠖Verification test made in this PJ Crossover piping scaled test
Earthquake PRA evaluation
Fundamental design properties
(1) Basic features and response targets of seismic isolators
A horizontal two-dimensional base isolation system consisting of Lead Rubber Bearing (LRB) with the largest diameter that could be manufactured in Japan was chosen as our seismic isolation system, as shown in Figure 4, taking into account scales of assumed nuclear reactor facilities and supporting performance of the system.
When designing specifications of a seismic isolation system, it is necessary to decide a quake absorbing
period in reference to the natural period of each piece of nuclear equipment. Accordingly, fundamental
design properties of our isolators were specified as shown in Table 1, in accord with requirements for typical equipment. Response targets of the isolators were also set as indicated in Table 2.
Taking into account these requirements and assumed nuclear reactor facilities, LRB with a diameter ! of
1600 mm, was adopted for the isolators to be applied to a nuclear reactor building.
(2) Evaluation of crossover piping’s relative displacement
In order to confirm adequacy of relative displacement set as a response target of the isolators, the Table 2: Response targets of our
seismic isolation system
Table 1: Fundamentarl design properties of seismic isolators
Rubber diameter !1600 mm
(Maximum available at the market in Japan)
Rubber type G4 rubber, G6 rubber
The first cycle T1
T1=T2/䌮(K1/KH)*
G4 rubber: (K1/KH) = 13,
G6 rubber: (K1/KH) = 10
Quake absorbing
period T2 0.2 to 0.4 sec < T2 < 4.0 to 5.0 sec Yield seismic
intensity " 0.05 or more
Dominant vertical
frequency about 10 to 20 Hz
* K1/KH: the ratio between the first and the second rigidity of the seismic isolation system
Relative displacement between buildings
40 cm or less
Building response
acceleration 300 Gal or less
Design limit 1/1.5 of the linear limit Figure 3. Target spectrum and time history waveforms of design
earthquake ground motion
7,0(VHF $ & &( / (5 $ 7, 2 1 J D O
$&& 0$; (JDOVHF
7,0(VHF 9 ( /2 & ,7 < NL Q H
9(/ 0$; (NLQHVHF
7,0(VHF ' , 63 / $& ( 0( 1 7 FP
',6 0$; (FPVHF
7,0(VHF $ & &( / (5 $ 7 ,2 1 J D O
$&& 0$; (JDOVHF
7,0(VHF 9( / 2& , 7 < N LQ H
9(/ 0$; (NLQHVHF
' , 63 / $& ( 0 (1 7 FP
',6 0$; (FPVHF
㸺Ỉᖹᆅ㟈ື㸼
㸺㖄┤ᆅ㟈ື㸼
<Horizontal earthquake motion>
<Vertical earthquake motion>
Figure 4. Schematic view of Lead Rubber Bearing (LRB) Lead plug Internal steel
plate㻌
Division V
crossover piping design was evaluated. The evaluation target was the steam piping running between a nuclear reactor building (R/B) with base isolation and a turbine building (T/B) without base isolation. As shown in Figure 5, the evaluation result of crossover piping design led to confirmation of design soundness even under an influence of relative displacement between the buildings.
Modeling approaches of the isolators (1) Seismic isolator design
A seismic response analysis was made by the 1-degree-of-freedom (1-DOF) beam model with yield
seismic intensity " and secondary frequency T2 as parameters, in order to make the specifications of the
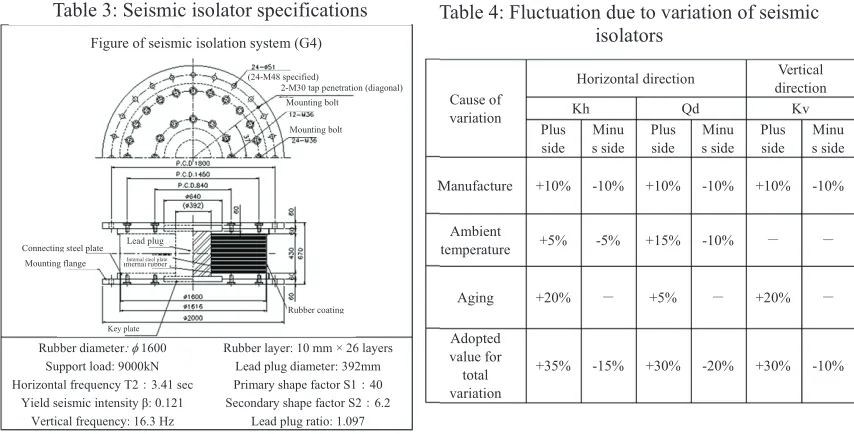
isolators optimal for a nuclear reactor building. And then, the specifications of the isolators to which G4 rubber was applied were formulated based on maximum response displacement and maximum response acceleration of the base isolated layer, as shown in Table 3. In addition, as the diameter of the lead plug became thick, specifically 392 mm accounting for about 25% of the laminated rubber’s diameter, another isolators was designed where the lead plug was divided into four.
(2) Examination of seismic isolators variation
The stiffness and the yield load of the LRB undergo fluctuation due to variation in manufacture, ambient temperature, and aging. Study was made on the LRB that has been designed in Sub-section (1) about fluctuation range of the stiffness and yield load caused by such variety.
Table 4 shows fluctuation ranges caused by variation of the isolators. First, for the fluctuation caused by Anchor from
Non-Isolated Bld. (T/B) Main Steam (M/S)
Crossover Piping
Isolators Anchor from Isolated Bld. (R/B)
~
Bender
Bender No.2
Bender No.3 R/B
T/B
M/S piping model Supported from㻌 : Isolated Bld. (R/B)㻌 : Non-Isolated Bld. (T/B)
Figure 5. Evaluation of crossover piping (PWR plant)
Cause of variation
Horizontal direction Vertical direction
Kh Qd Kv
Plus side
Minu s side
Plus side
Minu s side
Plus side
Minu s side
Manufacture +10% -10% +10% -10% +10% -10%
Ambient
temperature +5% -5% +15% -10% 㸫 㸫
Aging +20% 㸫 +5% 㸫 +20% 㸫
Adopted value for total variation
+35% -15% +30% -20% +30% -10%
Table 4: Fluctuation due to variation of seismic isolators
Figure of seismic isolation system (G4)
Rubber diameter!"# 1600 Support load: 9000kN Horizontal frequency T2㸸3.41 sec
Yield seismic intensity ": 0.121 Vertical frequency: 16.3 Hz
Rubber layer: 10 mm × 26 layers Lead plug diameter: 392mm Primary shape factor S1㸸40 Secondary shape factor S2㸸6.2
Lead plug ratio: 1.097 Table 3: Seismic isolator specifications
Mounting flange Connecting steel plate
Key plate
(24-M48 specified)
2-M30 tap penetration (diagonal) Mounting bolt
Rubber coating Lead plug
Internal rubberInternal steel plate
manufacture was used by a laminated rubber manufacturer, was adopted. For the fluctuation by ambient temperature, a range of ± 10 ºC was set against the standard temperature of 15 ºC used in the design formula specified by a laminated rubber manufacturer. As for the aging-induced fluctuation, the change in stiffness corresponding to 80 years was adopted in characteristics of the laminated rubber.
(3) Spring model of the seismic isolators
Candidate methods for modeling hysteretic behaviors of the entire seismic isolators (called the base isolated layer) arranged in a building are a modeling method of consolidating the layer into one spring, another modeling method of replacing the layer with two or more springs, and a multi-spring (MS) modeling method where multidirectional behaviors can be reproduced as shown in Figure 6.
(4) Hysteretic behaviors of the seismic isolators
Figure 7 shows hysteretic behaviors at the design phase. A seismic response analysis at the design level can be made by using a horizontal spring for modeling the laminated rubber and the lead plug and by
using vertical spring for modeling the laminated rubber. The parameter " related to initial rigidity of the
lead plug and the damping constant of the laminated rubber were set by taking into account results of the characteristics test conducted in this project as well as recommended values of manufacturers concerned. Figure 8 shows hysteretic behaviors at the beyond-design phase in the horizontal direction. Hardening characteristics were specified based on results of past studies. It was confirmed that this modeling could
be expanded to apply to large-diameter isolators, from a hardening test with a diameter ! of 1200 mm.
Figure 6. Overview of modelling the base isolated
layer(PWR plant)
ච㟈ᒙỈᖹ䜀䛽
3D spring model of the base isolated layer㻌
ච㟈ᒙ㖄┤䜀䛽
Dἲ䛻䜘䜛ᆅ┙
㖄┤䜀䛽 ୗ㒊ᇶ♏∧
Base isolated layer spring
Consolidated spring model
㻌
MDOF stick model㻌
Figure 7. Hysteretic behaviors at the design phase
Horizontal spring of the lead plug㻌
Vertical spring of the laminated rubber Horizontal spring of the
laminated rubber
㻌
Lami -nated rubber
Vertical spring Horizontal spring
Lead plug
Horizontal spring for the base isolated layer
Vertical spring for the base isolated layer
Foundation board of the lower part Vertical spring for the ground
Mass point Node point
Stiffness of rubber
(Horizontal displacement)
(Horizontal displacement)
(Compression)
(Vertical displacement) Q (Shearing force)
Q (Shearing force)
Yield force of lead plug
Compression stiffness Tension stiffness Yield axial force N (Axial force)
Stiffness of rubber
Division V
Seismic response analysis
(1) Overview of seismic response analysis
One of typical models used in seicmic response analysis is the MDOF stick model as shown in Figure 6. In order to evaluate seismic integrity of a building and isolators, their responses should be calculated, as shown in Figure 9, by making a seismic response analysis with the MDOF stick model based on time history. For evaluation of the seismic margin, it is necessary to confirm the ultimate limit of a building and
isolators by response analysis using the design wave multiplied by a coefficient (#).
(2) Comparison of MDOF stick model and 3D FE-model
Figure 10 shows results of comparison between the MDOF stick model and the 3D FE-model. In order to verify adequacy of the MDOF stick model, a seismic response analysis was made in the case of receiving two inputs simultaneously from the horizontally 45-degree direction and the vertical direction. Both the models showed almost identical building response acceleration, while the MDOF stick model produced more conservative results in terms of tensile axial stress of isolators. From these results, it was verified that the MDOF stick model enabled a high-accuracy analysis in despite of 2D or 3D spring model of the base isolatede layer.
Figure 8. Hysteretic behaviors at the beyond-design phase (horizontal direction) Comparison with the hardening test㻌
㻙㻝㻞㻜㻜 㻙㻥㻜㻜 㻙㻢㻜㻜 㻙㻟㻜㻜 㻜 㻟㻜㻜 㻢㻜㻜 㻥㻜㻜 㻝㻞㻜㻜 㻙㻢㻜㻜 㻙㻠㻜㻜 㻙㻞㻜㻜 㻜 㻞㻜㻜 㻠㻜㻜 㻢㻜㻜 㻺㼛㻚㻝㻝 㻺㼛㻚㻠 㻺㼛㻚㻡 㻺㼛㻚㻢 㻹㼛㼐㼑㼘㻙㻝 㻹㼛㼐㼑㼘㻙㻞 ỈᖹⲴ㔜㻔㼗㻺㻕 Ỉᖹኚ㻔㼙㼙㻕 㻠㻜㻜㻑⧞㏉䛧㍕Ⲵ䠄ヨ㦂䛿㻟䝹䞊䝥┠䠅
Hardening characteristics㻌
㻌
Figure 9. Results of seismic response analysis (PWR plant) Floor response spectrum(FRS) at
the operating floor㻌 0 1000 2000 3000 4000 5000
0.01 0.10 1.00 10.00
Period [sec] A C C .R .S . 1 % [ c m /s ^ 2 ] SsH1 IC07 SsH2 IC07 SsH3 IC07 ᶆ‽ἼH
Seismic isolator to the design waves multiplied by #
0 10 20 30 40 50 60 70
0 100 200 300 400 500 600 700 800
䛫 䜣 ᩿ ຊ [× 1 0 5 k N ] 䛫䜣᩿ṍ[%] ⥺ᙧ㝈⏺ 㾂1.5䠙 Ssチᐜ㝈⏺ ⥺ᙧ㝈⏺ ◚ቯ㝈⏺ 㻿㼟㻴㻝㻗㻿㼟㼂㻝 㻿㼟㻴㻞㻗㻿㼟㼂㻞 㻿㼟㻴㻟㻗㻿㼟㼂㻟 㻝㻚㻜㽢㻿㼟 㻝㻚㻡㽢㻿㼟 㻞㻚㻜㽢㻿㼟 㻞㻚㻡㽢㻿㼟 㻟㻚㻜㽢㻿㼟 S h ea r fo rc e [× 1 0 5 k N ] 㻌
Shearing strain [%]㻌 Linear limit /
1.5 = Allowable
limit㻌
Linear limit Breakdown limit㻌
Input motion㻌
Horizontal displacement (mm)
Q (Shearing force)
Stiffness of base-isolated part Hardening characteristics
Shift of a hardening area due to large deformation (a slip phenomenon)
(Horizontal displacement)
(3) Thermal effect of LRB
Figure 11 shows results of a study on thermal effect of LRB (PWR plant). A focus has been on an increase in deformation of the seismic isolators due to a decrease in the yield caused by heat generation of the lead plug receiving a long earthquake motion. Therefore, thermal effect study was conducted with a seismic response analysis.
As the results, response displacement to the design wave was about 10 % increase at most, even if the temperature rise was taken in consideration. Accordingly, it was confirmed that there was no significant thermal effect.
Evaluation of seismic integrity (1) Allowable limit of LRB
Based on the basic characteristics test, the hardening test, and the full-scale breaking test, it is thought that 275% of shearing strain, which becomes almost a lower limit, can be used as the linear limit in the compression domain. Based on the linear limit of shearing strain, the allowable limit can be set at 183% of shearing strain, which is 2/3 times the linear limit. For the linear limit of tensile-shear, the lower limit value in the test results was adopted just like in the compression domain.
Figure 10. Comparison results between the MDOF stick model and the 3D FEM model (PWR plant) 㻙㻝㻜
㻜 㻝㻜 㻞㻜 㻟㻜 㻠㻜 㻡㻜 㻢㻜 㻣㻜 㻤㻜
㻜 㻞 㻠 㻢 㻤 㻝㻜
45ᗘ᪉ྥຍ㏿ᗘ㻔㼙㻛㼟㼑㼏㻞㻕 㻯㼂
㻙㻝㻜 㻜 㻝㻜 㻞㻜 㻟㻜 㻠㻜 㻡㻜
㻜 㻞 㻠 㻢 㻤 㻝㻜
㻵㻛㻯
45ᗘ᪉ྥຍ㏿ᗘ㻔㼙㻛㼟㼑㼏㻞㻕
(Unit㸸MPa) 3D FEM MDOF
SRSS -0.49 0.34
Combination
coefficient method -0.19 0.62
Simultaneous inputs 0.04 0.05
Envelope value*1
0.04 0.62
*1: An envelope value of SRSS, a coefficient method, and simultaneous inputs
*2: Above positive values mean tension.
Acceleration in the 45-degree direction (m/sec2)㻌
Acceleration in the 45-degree direction (m/sec2
)㻌
310 Isolators㻌
80m
90m㻌
3D FEM model㻌
Tensile axial stress of isolators
㖄㝆అᛂຊȫ1PP
㖄 ᗘΥ ᥦᘧ
タィ್1PP
[N1
FP
[N1
FP
ᗘୖ᪼㠀⪃៖ ᗘୖ᪼ࠉ⪃៖
Figure 11. Thermal effect of LRB (PWR plant)
Lead yield stress $ (N/mm2)
Lead temperature (ºC)
Non thermal effect㻌
Design value: 8.33 N/mm2㻌
Proposed equation㻌
On thermal effect㻌
Lead temperature vs yield stress㻌 Response results
Division V
With reference to the Seismic Design Guidelines for Base-Isolated Structures of Nuclear Power
Plant,(JEAG4614-2013), the allowable limit of the seismic isolators specified based on the above discussion is shown in Figure 12. This figure shows results of design seismic response in the MDOF stick model at PWR and BWR. the results were within the allowable limit of the design nominal value that was 2/3 times the linear limit.
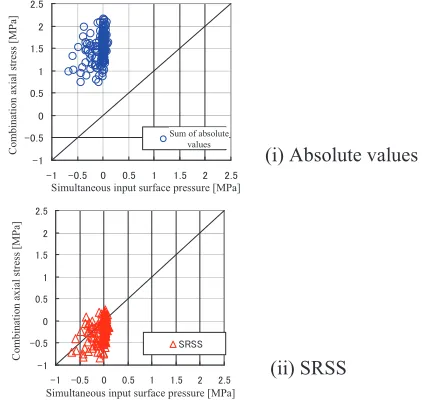
(2) Evaluation of tensile axial force combination
On the laminated rubber at the peripheral part of the base isolated layer, axial forces caused by overturning moment and vertical seismic force, in addition to long-term axial force. Judging from the seismic response where horizontal and vertical inputs were applied simultaneously, designing these axial forces using an absolute sum would result in too much conservative. Accordingly, a study was made on a method of combining axial forces that would provide relatively conservative results and enable rationalization of the design.
Figure 13 shows axial force evaluation results on the peripheral LRB using earthquake motions consisting of 200 waves. From results of a seismic response analysis using the 1-DOF stick model with input of these seismic waves, it was confirmed that envelopes of a simultaneous input analysis, SRSS, the combination coefficient method, etc. could be used as a practical evaluation method that could replace the absolute sum method.
Study other external events
In reference to various examples and sources such as the nuclear accident of the Fukushima Daiichi Nuclear Power Plant, nuclear regulations in foreign countries, etc.. Japan put into force new regulatory standards for NPPs in July 2013. The standards not only adopt more severe assumption of earthquakes and tsunamis but also require new measures to be taken against volcanos, tornados, and internal flooding. Against the above background, the following four categories of events were chosen as the external events to be considered in this study, from a result of examination of external events that could have an impact on base-isolated buildings: (i) earthquakes, (ii) tsunamis, (iii) tornados, and (iv) airplane crashes. It is necessary to properly make an assessment on these four external events to confirm integrity of base-isolated buildings. ᐇつᶍ◚᩿ヨ㦂䠄ኴᚄ䝥䝷䜾ヨ㦂య䠖༢ㄪ㍕Ⲵ䠅 㖄┤᪉ྥ䝋䝣䝖䝙䞁䜾ヨ㦂䠄ኴᚄ䝥䝷䜾ヨ㦂య䠖༢ㄪ㍕Ⲵ䠅 䝯䞊䜹䞊ᥦ♧್䠄䛫䜣᩿䜂䛪䜏100%) !=275% ᘬᙇ䛫䜣᩿⥺ᙧ㝈⏺䠄ୗ㝈್䠅 チᐜ㝈⏺䐠
チᐜ㝈⏺䠄⥺ᙧ㝈⏺䛾2/3䠅 チᐜ㝈⏺䐟
PWR"Ỉᖹ45ᗘ䠇㖄┤ධຊᛂ⟅
BWR"Ỉᖹ45ᗘ䠇㖄┤ධຊᛂ⟅
0.00 0.20 0.40 0.60 0.80 1.00 1.20 1.40
0 200 400 600
㠃 ᅽ (N /m m 2) 䛫䜣᩿䜂䛪䜏䠄䠂䠅
Figure 12. Allowable limit of LRB Figure 13. Axial force evaluation results on peripheral
LRB using 200-wave-based earthquake motions 㻙㻝 㻙㻜㻚㻡 㻜 㻜㻚㻡 㻝 㻝㻚㻡 㻞 㻞㻚㻡 㻙㻝 㻙㻜㻚㻡 㻜 㻜㻚㻡 㻝 㻝㻚㻡 㻞 㻞㻚㻡 ⤯ᑐ್
(i) Absolute values
(ii) SRSS 㻙㻝 㻙㻜㻚㻡 㻜 㻜㻚㻡 㻝 㻝㻚㻡 㻞 㻞㻚㻡 㻙㻝 㻙㻜㻚㻡 㻜 㻜㻚㻡 㻝 㻝㻚㻡 㻞 㻞㻚㻡 㻿㻾㻿㻿
Sheare strain (%)㻌
Full-scale breaking test
Softening test on vertical direction
Manufacturer proposed value
Tensile sheer linear limit (lower limit) allowable limit ղ
Allowable limit (2/3 of linear limit) allowable limit ձ
Design seismic response (PWR)
Design seismic response (BWR)
T en si le a x ia l st re ss ( N /m m 2) Com b ination a x ial stress [MP a]
Simultaneous input surface pressure [MPa]
Sum of absolute values C o m b in at io n a x ia l st re ss [ M P a]
CONCLUSIONS
Through this study, the authors have constructed a seismic isolation design methodology to install NPP’s
facilities, leveraging achievements of the seismic isolation system development project carried out from
2008 to 2015. Major achievements on base-isolated design of this project are as follows:
࣭It has designed the lead rubber bearig (LRB) of ȭ1600mm as full-scale isolators to install NPP’s
facilities, which is maximum available at the market in Japan.
࣭It has verified the modeling approaches of isolators from design phase to beyond-design phase based
on hardning and beaking test of isolators.
࣭It has confirmed MDOF stick model can be available for the seismic response analysis with
comparison to 3D FE-model.
࣭It has developed the seismic evaluation with related in allowable limit, combinated tensile axial stress
and so on as a seismic integrity method.
A part of the achievements of this project was reflected in the Seismic Design Guidelines for Base-Isolated
Structures of Nuclear Power Plant (JEAG4614-2013) issued by the Japan Electric Association.
We plan to continue this project to complete it in 2015. Our efforts will be aimed at preparation necessary for revision of related standards such as JEAG4614-2013, while building a new seismic isolation design methodology thoroughly covering all the steps from design evaluation to earthquake PRA evaluation.
ACKNOWLEDGMENT
This technology development has been carried out as Japan national project “Development for Evaluation Methods of Seismic Isolation Systems” with the participation of Chubu Electric Power, Japan Atomic Power, Hokkaido Electric Power, Tohoku Electric Power, Tokyo Electric Power, Hokuriku Electric Power, Kansai Electric Power, Chugoku Electric Power, Shikoku Electric Power, Kyushu Electric Power, J Power, Toshiba, Hitachi-GE Nuclear Energy, Mitsubishi Heavy Industries, and the Institute of Applied Energy. We thank Dr. Nishikawa, a Professor Emeritus at Tokyo Metropolitan University, Dr. Kubo, a Professor Emeritus at the University of Tokyo, Dr. Fujita, a Professor Emeritus at the University of Tokyo, Dr. Kasahara, a Professor at the University of Tokyo, Dr. Yabana, the Central Research Institute of Electric Power Industry for their advice.
REFERENCES
Nuclear Standard Committee. (2013). “Seismic Design Guidelines for Base-Isolated Structures of Nuclear
Power Plant (JEAG4614-2013),” Japan Electric Association, Japan.
Nuclear Standard Committee. (2009). “Technical Code for Structure design of Nuclear Power Plants
(JEAC4601-2008),” Japan Electric Association, Japan.
Japan Society of Seismic Isolation (2009).”Design guideline for connection between structure and devices” S. Matsuoka, Y. Takeuchi, et al.(2013). “Development of an Evaluation Method for Seismic Isolation
Systems (Part 1 to 2)” 13th World Conference on Seismic Isolation, Energy Dissipation and Active
Vibration Control of Structures
T. Hirotani, et al.(2014).“Development of an Evaluation Method for Seismic Isolation Systems of Nuclear
Power Facilities (Part 6 to 11),” Proceedings of the ASME 2014 Pressure Vessels & Piping Division