ISSN(Online): 2320-9801
ISSN (Print): 2320-9798
I
nternational
J
ournal of
I
nnovative
R
esearch in
C
omputer
and
C
ommunication
E
ngineering
(An ISO 3297: 2007 Certified Organization)
Vol. 4, Issue 4, April 2016
STF- Energy Efficient Scheduling Algorithm
for WSN
Shourya Khare1, Nishi Yadav2, Nishant Behar3
B.Tech VIII Semester, Dept. of Computer Science & Engineering, Central University, ITGGV, Bilaspur, Chhattisgarh, India1
Assistant Professor, Dept. of Computer Science &Engineering, Central University, ITGGV, Bilaspur, Chhattisgarh India2,3
ABSTRACT: As it is well known that sensors are deployed to perform an important task of gathering sensory information from its surrounding which may be very crucial for monitoring and analysis purpose, thus it should be taken care that sensors remain alive for a long time to sense data. All the sensor nodes have a limited supply of power which keeps them alive. Therefore, it is very necessary to reduce the energy consumed by sensors. This paper aims at increasing the lifetime of sensor nodes by adopting an efficient scheduling algorithm named ShortestTime First (STF).Merging this concept with the existing “intelligent sleeping mechanism” of Low Energy Adaptive Clustering Hierarchy Centralised Sleeping (LEACH CS)[3]protocolhelps to increase the network lifetime as it allows sensor nodes to sleep for some more time that has been saved using our new scheduling mechanism. According to STF, all the cluster heads will be scheduled to send their aggregated data on the basis of time taken for their signal to reach base station, which would help in reducing the waiting time of other cluster heads in a particular round and ultimately conserve energy.Simulation Results show that proposed STF schedule in LEACH CS increases the energy efficiency by approximately 20% more than LEACH CS [3] algorithm.
KEYWORDS: STF (Shortest Time First), Network Lifetime, QoS (Quality Of Service), Average waiting time, Sleepingtime, Threshold value.
I.INTRODUCTION
With advances in micro-electronics and communication technology, it is now possible to manufacture low cost sensors. These sensors are used by the sensor nodes to capture data from their surroundings. A Wireless Sensor Network is comprised of a large number of sensor nodes which may vary from a few to several hundreds. Each of these sensor nodes have limited energy as power is supplied through a battery which discharge after a certain period of time. Also, these sensors are usually placed in remote areas, where battery cannot be replaced regularly .Thus, our main aim should be to conserve the energy of sensors which would extend the lifetime of sensors and the network as well. It is necessary to keep these sensor nodes alive for a longer duration so that they could sense values and transmit it to the base station. [9]
ISSN(Online): 2320-9801
ISSN (Print): 2320-9798
I
nternational
J
ournal of
I
nnovative
R
esearch in
C
omputer
and
C
ommunication
E
ngineering
(An ISO 3297: 2007 Certified Organization)
Vol. 4, Issue 4, April 2016
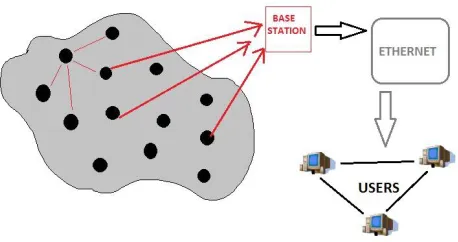
Fig 1: A wireless sensor network
There are different routing protocols which can be used for routing in a wireless sensor network. These can be categorised into hierarchical[12][13][14][15]based or data centric or location based protocols [4] [5].In this paper, we have worked on a hierarchy based protocol called as Low Energy Adaptive Clustering Hierarchy Centralised(LEACH C) protocol [2], in which cluster formation takes place and the cluster head after receiving the data from its nearby nodes, interacts directly with the base station [11].This helps in saving the energy of remaining nodes in that cluster. LEACH CS [3] protocol has been proposed which uses centralised cluster formation technique and intelligent sleeping mechanism for deciding which nodes to be switched to sleep mode on the basis of the significance of data. It has been explained in detail in Section III of this paper. Actually, LEACH CS protocol uses TDMAschedule for communication between cluster head of the nodes and the base station. In this paper, we have suggested a new scheduling algorithm STF(Shortest Time First) which helps to increase the lifetime of sensors by increasing their sleep time,based on the concepts of CPU scheduling (SJF-Shortest Job First) in Operating System [6].The proposed algorithm mainly focuses on the scheduling mechanism adopted by the cluster heads to transmit signals to the base station.
According to STF, the sensors will send their data according to a specific schedule which uses time and energy level of sensors to sort them is ascending order. This schedule will reduce the time for which a sensor may have to wait for its turn to send signal, called as waiting time. The life time of sensors can be increased by allowing sensors to sleep for more time and also helps to conserve energy of sensors.
A lot of research work has been done to minimise the energy consumption by sensors to prolong the lifetime of networks. This paper aims at conserving the energy of sensors by using an improved scheduling technique which has been explained in detail in Section III of this paper.Section II provides details of the related works which we have studied to propose our algorithm.
II.RELATED WORKS
Low Energy Adaptive Clustering hierarchy (LEACH)
Many research papers have been published for improving the efficiency of wireless sensor networks. HierarchicalBased protocol has always been considered as an efficient method of routing as it in involves cluster formation which helps in saving the energy of sensor nodes [8].
The working of LEACH [1] can be divided into two phases, the Setup phase and the Steady –State phase. The selection of cluster head and the formation of clusters are done in the setup phase. Some of the sensor nodes are selected to serve as cluster head (CH )for the current round, and the remaining nodes form clusters by joining the proper cluster head on the basis of signal strength form CH’s .In the setup phase, only a fraction of nodes, elect themselves as the cluster head for the current round. After that the cluster head has been selected, the remaining sensor nodes can start transmitting data to their corresponding cluster headaccording to TDMA schedule. All this comes under the Steady state operation
LEACHCentralized (LEACH C)
ISSN(Online): 2320-9801
ISSN (Print): 2320-9798
I
nternational
J
ournal of
I
nnovative
R
esearch in
C
omputer
and
C
ommunication
E
ngineering
(An ISO 3297: 2007 Certified Organization)
Vol. 4, Issue 4, April 2016
selected CHs will be concentrated only in some part of network while the remaining nodes may not have any CH nearby to them.
This problem is solved by CentralizedLEACH which ensures uniform distribution of CHs throughout the network. LEACH C [2] also performs operation similar to LEACH except for selection procedure of cluster heads .This means that only the setup phase of centralized LEACH is different from LEACH. In the setup phase, all the nodes send the information about their location and energy level to the base station. Now, the base station has a Global knowledge of all the nodes in the network. It then calculates the average node energy value and the nodes having energy value less than this value will not be allowed to become cluster head for the current round.Now, the base station uses remaining nodes as possible CH and finds optimal clusters using simulated annealing algorithm [2]. It minimizes the amount of energy thatnon-cluster head nodes require to transmit their data to the cluster head, by minimizing the total sum of ‘squared distances’ betweenall the non-cluster head nodes and the closest clusterhead. After selection of cluster head and formation of clusters, the Base Station (BS) sends a message to each node to tell its cluster head ID. If it matches its own ID, then it is a cluster head and creates TDMA schedule to send to its member nodes.The Steady state phaseis identical to that of LEACH.
LEACH CS (Centralized Sleeping)
LEACH CS [3] is an extension to centralizedLEACH which makes use of Intelligent Sleeping Mechanism(ISM), for choosing nodes that should be switched to the sleeping mode. This choice is based on the quality of data sensed by sensor nodes. The cluster heads aggregates the data after collecting it from nodes in the cluster. If this data appears insignificant in a period of time, these clusters are set to sleep mode till the next dataround.
The nodes in the sleeping mode do not sense any data, hence a lot of energy is conserved which increase the lifetime of sensors. Before this algorithm, the choice of sleep nodes was done on the basis of node density in a region or the number of neighboring nodes. Thus, most of them were based on redundancy of data. Hence, ISM adds quality of service toLEACHC.
Intelligent sleeping mechanism:
1) After the cluster head has been selected by the base station and optimal clusters have been formed using the centralizedLEACH algorithm, the non-cluster head nodes may start sending the data according to the assigned TDMA slot.
2) Cluster head aggregates the data after receiving it from the nodes in its cluster.
3) This average value is sent in the form of packet to base station. The BS after receiving the first packet from a cluster head in the current round analyses this data for its quality.
4) BS compares the data of first frame to a defined threshold value, which may be specified by user. If its value is less than the threshold value, then the data is not going to be significant in this round.
5) This means that all the nodes of the corresponding cluster can be switched to sleeping mode for the remaining time of round.The rest of the clusters continue the round and send their data to the base station in their fixed TDMA slots consequently.
The threshold value can be set by the user according to sensed application. For example, it may be temperature in a cultivation field or level of oxygen in large water bodies or may be the value of humidity in agricultural land, all such parameters will not change instantly and hence if these are under a user defined threshold, then it willnot reach a critical value in given data round and willremain stable for a while.
III.PROPOSED ALGORITHM
The proposed algorithm focuses on the scheduling mechanism used by the cluster heads of each cluster for transmitting signals to the base station. The main problem in a sensor network is the short lifetime of sensors .The energy of sensors keeps on decreasing with time. Sensors need to sleep in order to save their energy. Waiting time is the time for which a sensor waits for its turn to send signals to base station. All sensor nodes follow some schedule which is considered efficient if the waiting time for each sensor is minimum. As the waiting time of sensors decrease, they will get more time to sleep.
ISSN(Online): 2320-9801
ISSN (Print): 2320-9798
I
nternational
J
ournal of
I
nnovative
R
esearch in
C
omputer
and
C
ommunication
E
ngineering
(An ISO 3297: 2007 Certified Organization)
Vol. 4, Issue 4, April 2016
sleeping that was used in LEACH CS [3]based on the threshold value concept but instead of using the TDMA scheduling method for transmitting data, we will adopt Shortest Time First (STF) scheduling for data transmission to base station. The complete algorithm is described below:
STEP 1: This is about selection of cluster head and formation of clusters which is similar to that of LEACH CS algorithm[3].There are several rounds of data transfer that continues until all the nodes in the network are dead. a) Before each round, every node in the network sends its energy level and location to the BS.Depending on theseenergy levels, the base station sorts the nodes in descending order.It also calculates the average node energy value and the nodes having energy value less than this value will not be allowed to become cluster head for the current round. b) So, out of the remaining nodes in descending order of their energies, the BS chooses only 5% of the alive nodesto be the cluster head of the current round.
c) The remaining nodes are assigned by the base station to their corresponding cluster heads by choosing the minimumsquare distance between the node and the cluster heads. This would find optimal clusters in the network. Now, the non cluster head nodes in the cluster can start transmitting the data to their corresponding cluster according to the TDMA schedule sent by CH to its cluster nodes.The CHs aggregates the data sent by other nodes in cluster. All the CHs in the network have a packet to send to base station and some schedule is again required to send these packets. This is the part of algorithm where we adopted an efficient scheduling method explained below:
STEP 2: This step describes the modification done in the existing algorithmLEACH CS [3]in its Scheduling part. In Operating system, when there are more than one process ready for execution at the same time, then a specific schedule is followed. Similarly, in Wireless Sensor Networks, an efficient schedule needs to be followed by the cluster heads to transmit their data turn by turn in a given round. Two CHs cannot send data together as there are chances of collision. We use a technical term in CPU scheduling called as Average Waiting Time (AWT). Average waiting time is the time for which a process or a job waits for its turn to get CPU time for execution. A scheduling is considered efficient if the waiting time for each process is minimum.As we know that in LEACH CS protocol, each cluster head needs to send aggregate data to an external Base Station. This is a high energy transmission as base station are usually far away from sensor nodes [10]. Table 1 shows a list of parameters used in the algorithm.
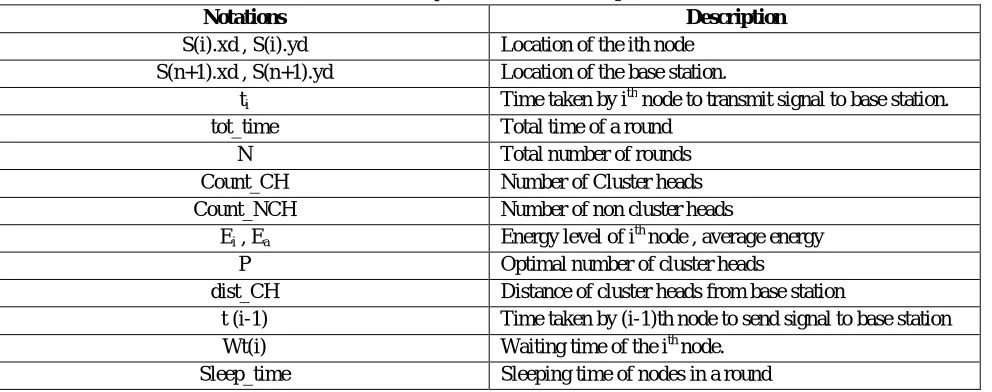
Table 1: Various parameters used in the algorithm
Notations Description
S(i).xd , S(i).yd Location of the ith node S(n+1).xd , S(n+1).yd Location of the base station.
ti Time taken by ith node to transmit signal to base station.
tot_time Total time of a round N Total number of rounds Count_CH Number of Cluster heads Count_NCH Number of non cluster heads
Ei , Ea Energy level of ith node , average energy
P Optimal number of cluster heads
dist_CH Distance of cluster heads from base station
t (i-1) Time taken by (i-1)th node to send signal to base station Wt(i) Waiting time of the ith node.
ISSN(Online): 2320-9801
ISSN (Print): 2320-9798
I
nternational
J
ournal of
I
nnovative
R
esearch in
C
omputer
and
C
ommunication
E
ngineering
(An ISO 3297: 2007 Certified Organization)
Vol. 4, Issue 4, April 2016
SORTcluster headsaccording to the time taken and energy levelinascending order.
a) Shortest distance:The time taken for the signals to reach the base station depends upon the distance of cluster heads from base station. The Cluster Head closest to the base station will take minimum time for its data to reach BS and the Cluster Head farthest from the base station will take maximum time for its data to reach BS. Thus, we can sort the cluster heads according to the time taken for their data to reach base station which is indirectly based on the distance of CHs from BS as:
TimetakenbysignalstoreachBS = distanceofCHsfromBS
Propagationspeedofsignals
Where,propagation speed of wireless signalsis given by speed of radio waves. Radio frequency-based communication is mostly used in WSN applications and Speed of radio waves is equal to the speed of light. Considering the disturbance through space,
Propagation speed = 2*107 m/s and distance is calculated as distance= √( (S(i).xd-(S(n+1).xd) )^2 + (S(i).yd-(S(n+1).yd) )^2 ).
b) Minimum Energy: This is another parameter that can be used to increase energy efficiency of network. If two or more cluster heads have approximate equal or comparable distance from BS, then they will be next sorted according to their energy level. The base station already has the global knowledge of location and energy levels of each sensor nodes, it will ask that cluster head to send data first which has minimum energy as it would minimise its waiting time and hence it can sleep for more time and save energy. We can consider the time taken by CHs to transmit signals to BS similar to the CPU burst time and construct following Gantt chart by taking an example for 5 CHs.
Total time for a round (tot_time )= sum of time taken by all CHs to transmit signal to BS =
t
1+t
2+t
3+t
4+t
5.Waiting time of a cluster head is the time for which it waits for its turn to send signals. Wt (i) = Wt(i-1)+t(i-1)
Average Waiting Timeof cluster heads:
AWTperround =SumofwaitingtimeofallCHs
TotalnumberofCHs
SLEEPING TIME of node i= Amount of time which it gets for sleeping (if it sleeps [step 3]) = tot_time – (waiting time of node i +
t
i )Along with the cluster heads , its member nodes will also go to sleep and have the same sleeping time as their CH.
0 units(start)
Fig2: Gantt Chart showing STF Scheduling mechanism
In Fig 2, the Gantt chart illustrates the time taken by each cluster head node to transmit signal to base station according to STF schedule. All CHs have data to send at time t=0 and are waiting for their time frame. It shows the start and finish time of each signal.
STEP 3: This step is similar to that of LEACH CS[3] protocol. According to the schedule based on minimum distance and energy , the first cluster can transmit its data to base station. Intelligent Sleeping Mechanism of LEACH CS will be used to analyse the data and set the cluster to sleeping mode if the data sensed is insignificant that is if the aggregated value is less than the defined threshold value. The base station broadcasts packets with a flag set to 1 with the address of cluster nodes that will be switched to sleeping mode. The nodes with their address specified as destination receive the packet and stop sending data during this round.These nodes and their cluster heads then send time taken by 1st CH
T1
time taken by 2nd CH T2
time taken by 3rd CH T3
time taken by 4th CH T4
ISSN(Online): 2320-9801
ISSN (Print): 2320-9798
I
nternational
J
ournal of
I
nnovative
R
esearch in
C
omputer
and
C
ommunication
E
ngineering
(An ISO 3297: 2007 Certified Organization)
Vol. 4, Issue 4, April 2016
their energy information to the base station finishing their role in theround.The rest of the clusters continue the round and send their data to the base station consequently.
IV.PSEUDO CODE
Step 1: for i =1 to N do
Send energy_ level and location to BS. // N is total no. of alive nodes Step 2: Compute avg_ energy Ea ;
Step 3: for each node i in network
if ( Ei<Ea) // Ei is the energy level of node i //
thennode ‘i’ is not eligible to become CH for current round.
Step 4: Modify N by removing the above nodes from set of alive nodes. Step 5: Sort remaining alive nodes (N) in descending order of Energies .
Step 6: p = N * 0.05 // only 5% of nodes selected for optimal no. of CHs// Step 7: select first p nodes out of N to be CH.
Count_ CH = p;//Count_CH is no. of cluster heads//
Count _NCH= N−p; //Count_NCH is no. of non cluster heads// Step 8: for i= 1 to Count_CH do
for i = 1 to Count_NCH do
/* non cluster heads are assigned by BS to
If dist( n1 , n2) < Min-square distanceappropriate CHs by finding minimum Min-square distance= dist(n1, n2) square distance between them*/
cluster_head(n1)= n2 Step9: NCHs send data to their CH.
Step 10: CH aggregates data. // all CHs now have to send their data to BS// Step 11: STF Schedule
r = no. of rounds
dist _CH = √( (S(i).xd-(S(n+1).xd) )^2 + (S(i).yd-(S(n+1).yd) )^2 ). /*distance of CHs from BS*/
s = 2* 107 //s is speed of propagation of signals// for every round do
time = t (i) = (dist_CH) / s
Sort((CH nodes) asc_time ) asc_energy /*CHs with equal time will be further sorted Acc. To their energies*/
avg=0
for j=1 to Count_CH CH send data to BS
Wt (i) = Wt (i-1) + t (i-1)/* calculating waiting times of CHs*/ If (CH(aggregate _value) < threshold)
Send flag = 1 /* BS sends flag to CH */ Else
Send flag=0
Step 12: if (flag =1) Sleep CH and cluster nodes
Sleep_time = tot_ time – (waiting time of node i + ti ) /* calculating sleep time of nodes*/
Else Continue for
V.SIMULATION RESULTS
ISSN(Online): 2320-9801
ISSN (Print): 2320-9798
I
nternational
J
ournal of
I
nnovative
R
esearch in
C
omputer
and
C
ommunication
E
ngineering
(An ISO 3297: 2007 Certified Organization)
Vol. 4, Issue 4, April 2016
2) The base station is situated at a far location from the sensor nodes in the network.
3) Speed of propagation of signals has been taken as 2* 107 m/sec which is slightly less than speed of light as we have considered disturbance through space.
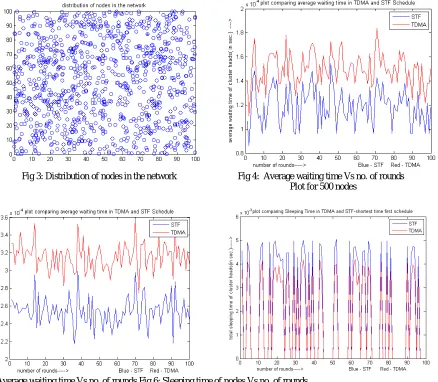
Fig 3 simply shows the distribution of nodes. Fig 4 shows the average waiting time of nodes calculated in TDMA scheduling and STF scheduling. It can be clearly seen that values of average waiting time for STF scheduling are always less or equal as compared to normal TDMA scheduling. Fig 4 is obtained using 500 nodes and same comparison is done for 1000 nodes in Fig 5. Number of rounds equals 100 for every simulation. In Fig 6, we have done a comparison of sleeping time for both schedules TDMA and STF. Results shows that sleeping time of nodes in STF schedule is always more or equal as compared to TDMA schedule and hence it has been proved through simulation that decrease in waiting of sensor nodes certainly increases their sleeping time. Simulation results also showed that on average 100 rounds, the STF scheduling is approx. 20% more efficient as compared to TDMA.
Fig 3: Distribution of nodes in the network Fig 4: Average waiting time Vs no. of rounds Plot for 500 nodes
Fig 5: Average waiting time Vs no. of rounds Fig 6: Sleeping time of nodes Vs no. of rounds Plot for 1000 nodesplot for 500 nodes
VI.CONCLUSION AND FUTURE WORK
ISSN(Online): 2320-9801
ISSN (Print): 2320-9798
I
nternational
J
ournal of
I
nnovative
R
esearch in
C
omputer
and
C
ommunication
E
ngineering
(An ISO 3297: 2007 Certified Organization)
Vol. 4, Issue 4, April 2016
waiting time of sensors greatly affects their sleeping time and also the performance of network. The proposed algorithm STF increases the energy efficiency of wireless sensor network by allowing sensors to sleep for some more time that was wasted in waiting during transmission process that is used in a simple TDMA schedule.
In this paper, we have worked on stationary nodes in a wireless sensor network. In future we will be checking the proposed algorithm for MANET (Mobile Ad hoc network).
REFERENCES
[1] Heinzelman WB. Application-specific protocol architectures for wireless networks. PhD thesis. Massachusetts Institute of Technology; June 2000.
[2] Heinzelman WB, Chandrakasan AP, Balakrishnan H. An application- specific protocol architecture for wireless microsensor networks. IEEE Trans Wire Commun 2002;1(4):660–70.
[3] Anar A. Hady , Sherine M. Abd El-kader, Hussein S. Eissa . “Intelligent Sleeping Mechanism for wireless sensor networks” , in Egyptian Informatics Journal (2013) 14, 109–115.
[4] K. Akkaya and M. Younis, "A Survey of Routing Protocols in Wireless Sensor Networks, " in the Elsevier Ad Hoc Network Journal, Vol. 3/3 pp. 325-349, 2005.
[5] I. Akyildiz, W. Su, Y. Sankarasubramaniam, and E. Cayirci, "A survey on sensor networks," IEEE Communications Magazine, Volume: 40 Issue: 8, pp.102-114, August 2002.
[6] Abraham Silberschatz, Peter Baer Galvin and Greg Gagne (2013). Operating System Concepts 9. John Wiley & Sons,Inc. ISBN 9781118063330.
[7] Paul Krzyzanowski (20140219). "Process Scheduling: Who gets to run next?" cs.rutgers.edu. Retrieved 20150111.
[8] El-Basioni BM, Abd El-kader SM, Eissa HS, Zahra MM. Clustering in wireless sensor network: studying a three wellknown clustering protocols. Book chapter in ‘‘Theory, application, and experimentation of wideband wireless networks’’ IGI global, 2012.
[9] Soleimani M, Ghasemzadeh M, Sarram MA. A new cluster based routing protocol for prolonging network lifetime in wireless sensor networks. Middle-East J Sci Res 2011;7(6):884–90
[10] Manjula SH, Reddy EB, Shaila K, Nalini L, Venugopal KR, Patnaik LM. Base-station controlled clustering scheme in wireless sensor networks. Wireless Days, 2008. WD ‘08. 1st IFIP. November 2008. p. 1–5.
[11] A Survey on Centralized and Distributed Clustering Routing Algorithms for WSNs (PDF). IEEE 81st Vehicular Technology Conference. Glasgow, Scotland: IEEE. Spring 2015. doi:10.1109/VTCSpring.2015.7145650. Retrieved March 4, 2016
[12] Nishi Yadav, PM Khilar,“Hierarchical adaptive distributed fault diagnosis in Mobile ad hoc network using clustering” International Conference on Industrial and Information Systems (ICIIS), IEEE Conference,July2010 Pages7-12.
[13] Kavita Tandon, Neelima Mallela, Nishi Yadav“Novel Approach for Fault Detection in Wireless Sensor Network” International Journal of Computer Science and Information Technologies (IJCSIT), Vol. 5 (2). 2014, 2191-2194
[14] Nishi Yadav, P.M. Khilar” Cluster based distributed diagnosis in MANET”, International Journal of Computer and Information Technology (2277 – 0764) Volume 01– Issue 01, September 2012
[15] Nishi Yadav, P.M. Khilar” An Improved Hierarchically Adaptive Distributed Fault Diagnosis in Mobile Ad Hoc Networks Using Clustering” First International Conference on Integrated Intelligent Computing (ICIIC), IEEE Conference,August2010 Pages 308-313.
BIOGRAPHY
SHOURYA KHAREis a Student of B.tech VIIITH Semester,Computer Science & Engineering, Central University, ITGGV, Bilaspur (Chhattisgarh), INDIA
NISHI YADAV is Assistant Professor at Department of Computer Science & Engineering, Central University,ITGGV, Bilaspur (Chhattisgarh),INDIA.