Studying Water QualityMonitoring System
Basedon Wireless Sensor Networks (WSNs)
Nahed A. Alnahash; Mohamed A. Zohdy
School of Engineering and Computer Science, Oakland UniversityRochester MI, 483309, USA
ABSTRACT:Water is the secret of life for organisms; humans, animals, and plants. It is important to be in good condition and consumed. Today, with the development of sensors and actuators to increase efficiency and the use of wireless networks. The use of this technique facilitates the process of gathering information and getting results in short time, with minimal effort, and low cost. In this paper, we focus on a specific effective set of complementary sensors. Based on different water parameters from bodies of water continuously, such as pH, turbidity, dissolved oxygen(DO) etc.
KEYWORDS:WSN, pH, turbidity, dioxide oxygen(DO)
I. INTRODUCTION
There are many miracles and facts about humans but they are oblivious to it, even if we look at this land, we find that God has made the percentage of water on the surface 71% and the proportion of land is 29%, why? Let us imagine that 71% of surface of earth is land and only 29% is water. In this case, the surface becomes so hot and all the things on land will burn. Nowadays, 2.5% of the 71% is fresh water. 80% of people are without good and clean drink water.
There is a relationship between water and living organisms, which is the more clean and good water there is to drink and to use; the number of diseases and deaths will decrease. Drinking polluted water causes serious and infectious diseases that can be caused by the death of many people, and usually occurs in poor countries.
So, water quality monitoring is considered to be a very important task. As water monitoring system can be used to track water quality over time we should have a good system to do this in a short period of time, that gives reliable data, and has a low cost of production.
From the late 2000s, new sensors were developed to detect different water quality parameters. Such as sensor to utilize biosensors, microelectronic mechanical systems, laser technology, etc. [1].
Wireless sensor network (WSN) is a special kind of wireless networking, consisting of small and especially distributed devices (nodes) which monitor and control physical environments from a remote location with better accuracy [2]. There is a different kind of applications in a variety of fields such as environmental monitoring, disaster monitoring, emergency response, medical diagnostics, and more[3,4,5,6]. One of the environmental monitors is water quality. Each node in wireless sensor networks consists of a battery, as an energy source, radio transceiver, and a small microcontroller.
Because water quality monitoring is considered a very important task and the traditional methods are not only costly but lack the capability for real-time data capture, using WSNs can solve these problems.
II. RELATED WORK
and explanation of different kinds of applications, such as environment monitoring application, disaster monitoring etc. The environmental monitoring application is the important one that we are looking for in our study.
III. SYSTEM DESIGN AND DISTRIBUTION
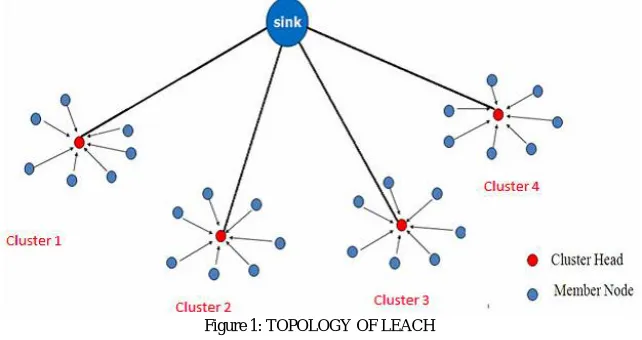
The water quality monitoring system is made up of several sensors and base station (BS). We will distribute the sensors homogeneously or heterogeneously and this depends on the kind of data. In our case, the sensor distribution would be heterogeneous. The WSN system is equipped with sensors and microcontroller units, receivers, power supplies and radio frequency(RF) transceivers. The sensor unit consists of several kinds of sensors to distribute in the water to detect the quality parameters. In this prototype, three sensors for measuring pH, dissolved oxygen (DO), turbidity are in use. After distribution, we will apply LEACH protocol to locating a cluster head. "Each node uses a stochastic algorithm at each round to determine whether it will become a cluster head in this round. LEACH assumes that each node has a radio powerful enough to directly reach the base station or the nearest cluster head, but that using this radio at full power all the time would waste energy" [8], by using LEACH protocol all sensor nodes are designed with the same battery energy [9]. The cluster-head will communicate with a base station by using one of the wireless communication techniques such as ZigBee (IEEE 208.15.4), WiFi and WiFi-Direct. Figure 1 shows a topology of LEACH [10].
Figure 1: TOPOLOGY OF LEACH
IV. SENSORS FOR MEASUREMENT WATER QUALITY AND SENSOR DEPLOYMENT
Most of the previous research has been aimed at identifying the different parameters that measures water quality: table 1 in the appendix provides a summary of water quality parameters along with references. In this section, we will give a briefdescription about the parameters that we have in our study. pH parameter is one of the parameters and the range of pH scale is 0 to 14 [11], with accuracy of 0.05 pH units and the WHO standard for drinking water is 7 – 8.5 (preferably 8). The output voltage of pH is from 0 to 14V (alkalinity and acidity).
pH is a measure of the activity of the solvated hydrogen ion P[H] in chemistry, and mathematically we can calculate the pH by using the following function and it was founded by Danish Biochemist, Soren Peter Lauritz in 1909 [12]. pH = -log[H+] (1)
Where [H+] is hydrogen ion concentration in mol/L.
e.g. in a neutral solution, the [H+] = 1 * 10^7 mol/L which can also be presented as a pH of 7.
Dissolved Oxygen (DO) is another one of the chemical parameters and it measures an important gauge of water quality. The range of measuring DO is 0 to 20 mg/L changesin temperature will affect the rate of DO in the water. Cold water can hold more DO than warm water and this will have an affect on aquatic [13].
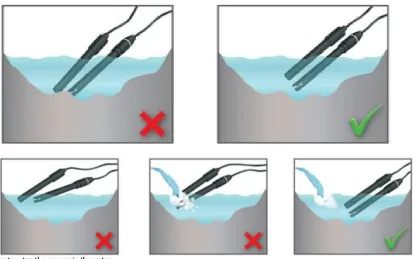
a. SENSOR DEPLOYMENT
The way and the place concerned are the main problems regarding the setup. First of all, it is important to install the sensors in a way which there is no interference between the objects and sensor, also it is important to be sure that the sensing part is not in touch with any objects. The following figures show the correct way to setup the sensors [15].
Figure 2: Way to setup the sensors in the water.
Secondly, it is important to be sure that the sensors are completely submerged in the water all the time.If it is not the sensor may give wrong output data.
V. MONITORING SYSTEM
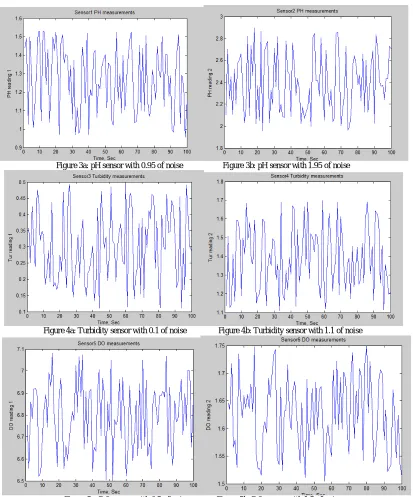
In our proposed system, each sensor will send the data and location to the cluster head to send it to the monitoring system (BS) then to the workstation. In the workstation, the calculations will have occurred to decide if the data is good for water quality or not. If the measurement gives correct data based on WHO standard; the area would be good otherwise, the workstation will figure out which area has a problem and the water is not good to use. At this moment, we will use the fuzzy filter to fix the problem [16]. Figures 3a, 3b shows pH sensor measurement, figures 4a, 4b shows turbidity sensor measurement and the last figures 5a and 5b show the measurement of Dissolved Oxygen DO. We assume that we have two different areas with different conditions.
a. PSEUDO CODE
. . .
calculate sensors reading (Ph, DO, Turbidity) under different conditions. Check the below condition for each node.
If ( output result >= to a specific value from WHO related to the sensor's kind) Display the result of area's water condition (good)
Display the result of area's water condition (bad) Repeat calculating sensors reading.
End.
Figure 3a: pH sensor with 0.95 of noise Figure 3b: pH sensor with 1.95 of noise
Figure 4a: Turbidity sensor with 0.1 of noise Figure 4b: Turbidity sensor with 1.1 of noise
Table 1 displays the result of all sensors and the WHO value of safe drinking water. Where R1, R2 are the first and second reading at area 1 and 2. D1, D2 are decisions; while G, N are a good and not good area for using water.
Table I: Result of all sensors.
VI. CONCLUSION and FUTURE WORKS
In this paper, we suggest measuring the quality of water using wireless sensor networks. We distribute the sensors in an area then we apply LEACH protocol to create a cluster head. After creating the CH, each sensor sends the collected data with the coordinator to the CH to send it to the BS then to the workstation to calculate and make a dissension. The fuzzy filter will be applied only on the sensor/s that present nonacceptable result.
In future works, we will pay attention to: - Extended Kalman filter.
- Study more recent sensors from alert labs. - Stochastic approximation algorithm.
-REFERENCES
1. Adu-Manu, Kofi Sarpong, et al. "Water Quality Monitoring Using Wireless Sensor Networks: Current Trends and Future Research Directions." ACM Transactions on Sensor Networks (TOSN) 13.1 (2017): 4.
2. H. Karl and A. Willig, Protocols and Architectures for Wireless Sensor Networks, John Wiley and Sons Ltd, The Atrium, Southern Gate, Chichester, West Sussex, England, 2005.
3. D. Culler, D. Estrin, and M. Srivastava, “Overview of Sensor Networks”, IEEE Computer, August 2004.
4. K. Martinez, J. K. Hart, and R. Ong, “Environmental sensor networks”, IEEE Computer Journal, Vol. 37 (8), 50-56, August 2004.
5. A. Mainwaring, D. Culler, J. Polastre, R. Szewczyk, and J. Anderson, “Wireless sensor networks for habitat monitoring”, Proceedings of the 1st ACM International workshop on Wireless sensor networks and applications, Atlanta, Georgia, USA, 88-97, 2002.
6. I. F. Akyildiz, D. Pompili and T. Melodia, “Underwater acoustic sensor networks: research challenges”, Ad Hoc Networks, Vol. 3 (3), 257-279, May 2005.
7. http://www.who.int/mediacentre/factsheets/fs107/en/
8. https://en.wikipedia.org/wiki/Lowenergy_adaptive_clustering_hierarchy 9. http://vlab.amrita.edu/?sub=78&brch=256&sim=1558&cnt=1
10. Hayat, Muhammad Noman, et al. "Review of Cluster-based Energy Routing Protocols for WSNs." International Journal of Interdisciplinary Research Centre (2016).
11. http://www.upstatefreshwater.org/NRT-Data/Data-Interpretation/data-interpretation.html 12. http://www.milanco.com/training/fundamen.htm
13. https://water.usgs.gov/edu/dissolvedoxygen.html
14. Yue, Ruan, and Tang Ying. "A water quality monitoring system based on wireless sensor network & solar power supply." Cyber Technology in Automation, Control, and Intelligent Systems (CYBER), 2011 IEEE International Conference on. IEEE, 2011.
15. http://www.libelium.com
16. Dakhlallah, T. K., M. A. Zohdy, and O. M. Salim. "Application of sensor similarity, complementarity and type-2 fuzzy logic to a dynamic security monitoring system." Aerospace and Electronics Conference (NAECON), Proceedings of the 2011 IEEE National. IEEE, 2011.
17. https://alertlabs.com/
Measurement parameter WHO standard R1 D1 R2 D2
pH 7-8.5 7.0941 G 13.4069 N
Turbidity 1-5NTU 0.5030 G 2.3116 G
BIOGRAPHY
Nahed Alnahashis a Ph.D. candidate in Computer Science & Informatics at Oakland University,
Rochester Michigan. Shereceived BS degree in computer science and a minor in mathematics from Pittsburg State University - Kansas and MS degree in computer science from Texas A&M Commerce - Texas. Her research interests are Network Security, Wireless Sensor, and Communication System. Her recent research significant interest has been directed towards the Optimization of Dynamic Sensor Networks in Unattended Environments (ODSNUE).
Dr.Mohamed A. Zohdy is a Professor in Electrical and Computer Engineering Department at Oakland university, Rochester Michigan. He received Ph.D. of Electrical Engineering from University of Waterloo (Canada).He is teaching Signal and Linear Systems Analysis; Optimal Control Theory; Automatic Control Systems, Optimal estimation, Digital control, and his research interests are Advanced control and estimation, intelligent pattern information processing, neural, fuzzy, evolutionary systems, chaos control, smart simulation, hybrid systems. His research contracts with government, industry; recent seed funds on Fuel Cell modeling and control for
APPENDIX