P R O C E E D I N G S
Open Access
A two step Bayesian approach for genomic
prediction of breeding values
Mohammad M Shariati
1,2*, Peter Sørensen
1, Luc Janss
1From
15th European workshop on QTL mapping and marker assisted selection (QTLMAS)
Rennes, France. 19-20 May 2011
Abstract
Background:In genomic models that assign an individual variance to each marker, the contribution of one marker to the posterior distribution of the marker variance is only one degree of freedom (df), which introduces many variance parameters with only little information per variance parameter. A better alternative could be to form clusters of markers with similar effects where markers in a cluster have a common variance. Therefore, the influence of each marker group of sizep on the posterior distribution of the marker variances will bep df.
Methods:The simulated data from the 15thQTL-MAS workshop were analyzed such that SNP markers were ranked based on their effects and markers with similar estimated effects were grouped together. In step 1, all markers with minor allele frequency more than 0.01 were included in a SNP-BLUP prediction model. In step 2, markers were ranked based on their estimated variance on the trait in step 1 and each 150 markers were assigned to one group with a common variance. In further analyses, subsets of 1500 and 450 markers with largest effects in step 2 were kept in the prediction model.
Results:Grouping markers outperformed SNP-BLUP model in terms of accuracy of predicted breeding values. However, the accuracies of predicted breeding values were lower than Bayesian methods with marker specific variances.
Conclusions:Grouping markers is less flexible than allowing each marker to have a specific marker variance but, by grouping, the power to estimate marker variances increases. A prior knowledge of the genetic architecture of the trait is necessary for clustering markers and appropriate prior parameterization.
Background
The statistical methods for genomic selection introduced by Meuwissen et al [1]; i.e. SNP-BLUP, BayesA and BayesB, are still the most popular ones. G-BLUP that exploits SNP genotypes to build genomic relationship matrix emerged some years later and it was shown that G-BLUP and SNP-BLUP are equivalent models [2,3]. From other approaches for genomic prediction of breed-ing values (BV) one can name LASSO [4], Bayesian LASSO [5] and reproducing Hilbert space models [6]. These latter methods have not led to magnificent
improvement over the original methods proposed by Meuwissen et al. [1] in BV prediction.
In BayesA and BayesB the prior distribution of each marker effect is assumed normal with a marker specific variance σ2
i . The marker variances follow a
scaled-inverse Chi-squared distribution with some scale and degrees of freedom (df) hyperparameters, a priori [1]. Therefore, the marginal posterior distribution of marker effects is a t-distribution [7]. In this setting, the resulted drawback is that the contribution of each marker to the posterior distribution of marker variances is only one df, that is very little information for any prior specification [7]. As a remedy, Gianola et al [7] suggested to form clusters of markers where markers in a cluster have a common variance. Therefore, the influence of each marker group of sizepon the posterior distribution of the marker * Correspondence: [email protected]
1
Department of Molecular Biology and Genetics, Faculty of Science and Technology, Aarhus University, DK-8830 Tjele, Denmark
Full list of author information is available at the end of the article
variances will bepdf. Further, they suggested assigning noninformative priors to scale and df parameters of the distribution of marker variance or marker-group variance. In the present study, a strategy for grouping markers with similar effects together was applied to the simulated data from the 15th QTL-MAS workshop [8]. The analysis was performed in two steps, where, in the first step marker effects were estimated in a SNP-BLUP analysis, and in the next step, markers with similar effects were allocated to one group. From complexity point of view, this strategy stands between SNP-BLUP where a single variance is common to all markers, and BayesA-B, where each marker has a variance. The aim of this study was to investigate the performance of this strategy on the accuracy of genomic breeding values. Further, the effect of prior setting for the marker-group variances on the extent of phenotypic var-iance explained by each group of markers was investigated.
Methods Model
First, an animal model BLUP using pedigree and pheno-types was performed to predict breeding values of all animals, and REML estimate of heritability was obtained [9]. Further, the heritability and breeding values were estimated using genomic models [10] and compared with the ones from animal model.
The SNP-BLUP additive genomic model was used to estimate SNP effects in the first step as:
yi=μ+
j
xijβj+ei i= 1,. . .,n and j= 1,. . .,q(1)
whereμis the general mean, bjis the allele
substitu-tion effect of thejth SNP with β∼N(0,Iσβ2), xijis the
genotype covariate of thejth marker for theith animal, associating marker effects bjto the phenotypeyi, andei
is residual or environmental effect with e∼N(0,Iσe2). The genotype covariate is initially coded as 0,1,2 for homozygote, heterozygote and alternate homozygote, and then centered to have mean zero. Flat priors were considered for the residual variance σe2 and marker
var-iance σβ2 to estimate them in a reference Bayesian approach that uses the frequentist likelihood as the Bayesian posterior distribution.
The estimated marker effect βjˆ from model (1) was used to estimate the variance explained by that marker in the population as pj
1−pj
β2
j, wherepj is the
fre-quency of one of the alleles of the jth SNP. Then, all markers were sorted based on their explained variance and each 150 marker were grouped together. We tried a grid of different SNP-group sizes and among them a
SNP-group size of 150 yielded the highest accuracy of PBV in the validation dataset (explained in results and discussion).The model for the second step (ALL-SNP) with grouped SNP and group specific SNP variance was:
yi=μ+
j
xijβjk+ei i= 1,. . .,n, j= 1,. . .,q and k= 1,. . .,g (2)
where bjk denotes the effect of the jth marker that
belong to groupk, and gis the total number of groups. A model was used with a variance parameter per group, and the group variances are jointly modeled to have an inverse chi-square distribution in which the scale is trea-ted as a model parameter. The prior specification was as follows:
μ~uniform; βjk∼N(0,σk2); σk2∼χ−2(scale,df);
σ2
e ∼uniform(>0); σe2∼uniform(>0); scale~uniform
(>0); anddf: a fixed number as hyperparameter.
The fully conditional posterior distributions were as follows:
where nk is the group size for SNP-group k. In this
studynkwas equal to pfor all SNP-groups;
σ2
In further analyses, respectively, 1500 (SNP1500) and 450 (SNP450a, SNP450b) markers with the largest effects from model (2) were selected and were allocated to groups of size 150 (for 1500 markers), and 75 or 50 (for 450 markers). Then, breeding values of animals without records were predicted using the marker effects from these subsets of markers.
Gibbs sampling
Results and discussion
The challenge was to predict the breeding values of 1000 genotyped animals with no phenotypes. The available data comprised of 2000 animals with both genotype and phenotype. We validated the models using 200 animals such that the last progeny with genotype and phenotype record from each dam was taken out of the data and used for validation. The remaining 1800 animals were used to train the model. Based on this validation the size of the SNP-groups was chosen to be 150 and the scale and df of the prior distribution of marker variances were set to zero because this resulted in the highest accuracy for the validation animals. A scale and df setting of zero corresponds to the so-called Jeffreys or non-informative prior for variances. After the true breeding values of the other 1000 animals were provided, it turned out that other prior specification for the marker variances can give better predictive abilities. Perhaps, the reason was that the 200 validation animals were not enough to represent the whole population. Further, there was an imprinted QTL where the effect is expressed if it has been transmitted from one of the parents only. It is likely that among these 200 animals most of them or all of them have got the paternal (maternal) imprinted QTL. Further details of the impact of prior specification of the marker variances on estimation of SNP effects and breed-ing values will be discussed.
Accuracy of predicted breeding values
The accuracies of predicted breeding values (PBV) from the two-step method were higher than PBV from animal model BLUP and SNP-BLUP (Table 1). Among the two-step strategies, including all SNP in the model yielded highest accuracy followed by, respectively, including 1500 and 450 markers. Animal model BLUP yielded the lowest accuracy of PBV because it takes only parent average BV to predict BV of offspring. Clustering SNP in groups with similar effects improved the accuracy compared to SNP-BLUP by around 4%, but the accuracy was still 7% lower than BayesB method [11,12]. Given that only eight makers were causative QTL, it is natural that BayesB
performs best because it has been invented to locate the marker variance efficiently for few QTL with large effects [1]. In the two-step approaches, all of causative SNP were allocated to the first group with largest effect but the group size was much larger than the true number of cau-sative SNP. This can lead to some discrepancy in estimat-ing SNP effects that is described later in this paper.
Variance components and heritability
Table 2 shows the estimates of heritability of the trait using animal model BLUP (REML), SNP-BLUP and grouping scenarios. The REML estimate of (narrow sense) heritability was very close to the simulated (broad sense) heritability. This indicates that the non-additive variance due to one pair of epistatic QTL has been neg-ligible. SNP-BLUP underestimated heritability by 1% meaning that it has captured most of additive variance despite the fact that genetic values were due to few QTL with large effects. Several studies have shown that SNP-BLUP can capture relationship; i,e, genetic similari-ties between animals, and this is independent of the number of QTL and the distribution of QTL effects affecting the trait [13,14]. This characteristic of SNP-BLUP has led to the use of genomic relationship matrix in genetic evaluation programs based on SNP markers [2]. On the other hand, all two-step scenarios overesti-mated heritability by around 5.5%. This shows that they were not able to separate the signal from the noise perfectly.
Prior distribution for variances
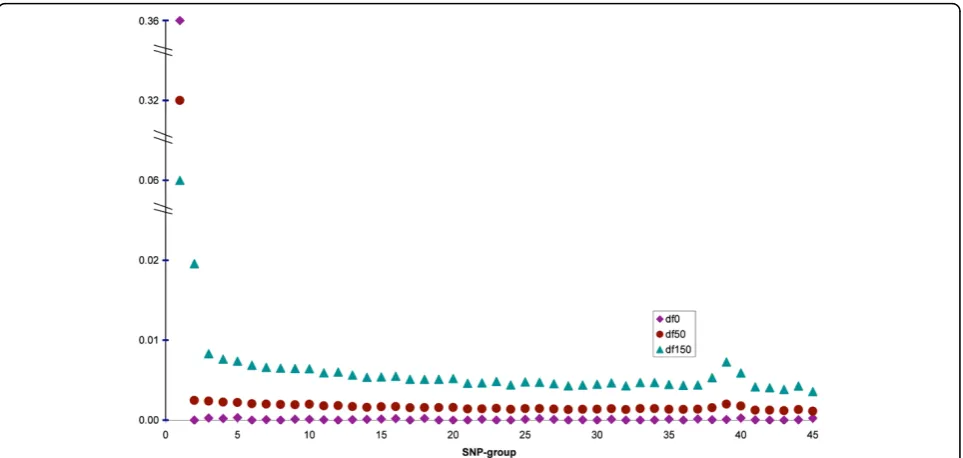
Overestimation of the heritability in the two-step method was mainly due to the prior setting for the SNP-group var-iances (scale = 0, df = 0, corresponding to the Jeffreys or non-informative prior). In order to investigate the effect of prior df, two other analyses with either 50 or 150 degrees of freedom were run with all markers (extensions of ALL-SNP), where, the scale parameter was updated using equa-tion (3). Figure 1 shows the SNP-group heritabilities for different df for the prior distribution of marker variances. The overall heritabilities were 0.355, 0.351 and 0.305, respectively, for the df of 0, 50 and 150. When both scale
Table 1 Correlation between predicted breeding values of unphenotyped animals and their true genetic values or expected genetic values of their progeny
Method Genetic value Progeny value
BLUP 0.608 0.595
SNP-BLUP 0.825 0.822
All_SNP1 0.862 0.841
SNP15001 0.861 0.840
SNP450a2 0.856 0.830
SNP450b3 0.854 0.823
1, 2, 3
Group sizes were 150, 75 and 50, respectively.
Table 2 Estimates of heritability from different methods
Method Heritability
True 0.300
REML 0.297
SNP-BLUP 0.289
All_SNP1 0.355
SNP15001 0.355
SNP450a2 0.357
SNP450b3 0.356
1, 2, 3
and df were set to zero, which is the non-informative prior distribution σk2∼1/σk2), the first SNP-group with largest QTL had a huge variance that explained all the genetic variation plus a large fraction of noise. This setting resem-bles a fixed regression scenario were in the first group, the large variance induces very little shrinkage for 150 SNP in this group. Because the SNP in the first group were not all the real QTL, the model overestimated the genetic var-iance. For df of 150, a priori, the posterior df was equal to 300 and the impact of 150 SNP within a group in deter-mining the group variance reduced to half and the other half was the share of prior. Therefore, a harder shrinkage on the first group and less shrinkage on the rest of groups was performed. It can be said that there is a trade off between the accuracy of PBV and unbiased estimation of heritability. A model with high df for the prior distribution of group variances performs similar to a SNP-BLUP model; it yields unbiased estimate of the heritability but due to strong shrinkage on all markers, the accuracy of PBV will not be high. On the other hand, a very small df can lead to a regression with fixed marker effects that is prone to capture noise.
Conclusions
Grouping markers is less flexible than allowing each mar-ker to have a specific marmar-ker variance but, by grouping, the power to estimate marker variances increases. A prior knowledge of the genetic architecture of the trait is neces-sary in order to clustering markers and appropriate prior parameterization. In the workshop data set, the presented
approach to group SNPs gave better predictions than a SNP-BLUP model, but worse predictions than a mixture (BayesB type) model. However, the workshop data set had a limited amount of QTL, which may not be representative for many real data sets. In real data often little advantages are seen for mixture models compared to SNP-BLUP, and as our method clearly outperformed SNP-BLUP our method could be of interest for further study in real data.
Acknowledgements
MMS was funded by The Danish Research Agency grant no. 274-08-0068. This article has been published as part ofBMC ProceedingsVolume 6 Supplement 2, 2012: Proceedings of the 15th European workshop on QTL mapping and marker assisted selection (QTL-MAS). The full contents of the supplement are available online at http://www.biomedcentral.com/bmcproc/ supplements/6/S2.
Author details 1
Department of Molecular Biology and Genetics, Faculty of Science and Technology, Aarhus University, DK-8830 Tjele, Denmark.2Department of Animal Science, Faculty of Agriculture, Ferdowsi University of Mashhad, 91775 Mashhad, Iran.
Authors’contributions
MMS analyzed the data and drafted the paper. All authors contributed in planning the study, discussing the results and reading and editing the paper.
Competing interests
The authors declare that they have no competing interests.
Published: 21 May 2012
References
1. Meuwissen T, Hayes B, Goddard M:Prediction of total genetic value using genome-wide dense marker maps.Genetics2001,157:1819-1829.
Figure 1Marker-group heritabilities for different prior degrees of freedom for the group variances. Grouping was such that the first
2. VanRaden PM:Efficient methods to compute genomic predictions.J Dairy Sci2008,91:4414-4423.
3. Strandén I, Garrick DJ:Technical note: Derivation of equivalent computing algorithms for genomic predictions and reliabilities of animal merit.J Dairy Sci2009,92:2971-2975.
4. Usai MG, Goddard ME, Hayes BJ:LASSO with cross-validation for genomic selection.Genet Res2009,91:427-436.
5. Mutshinda CM, Sillanpaa MJ:Extended Bayesian LASSO for multiple quantitative trait loci mapping and unobserved phenotype prediction. Genetics2010,186:1067-1075.
6. de los Campos G, Gianola D, Rosa GJM, Weigel KA, Crossa J: Semi-parametric genomic-enabled prediction of genetic values using reproducing kernel Hilbert spaces methods.Genet Res2010,92:295-308. 7. Gianola D, de los Campos G, Hill WG, Manfredi E, Fernando R:Additive
genetic variability and the Bayesian alphabet.Genetics2009,183:347-363. 8. Elsen JM, Tesseydre S, Filangi O, Le Roy P, Demeure O:XVthQTLMAS:
simulated dataset.InProceedings of the XVth QTLMAS Workshop: 19-20 May 2011; Rennes FranceDemeure O, Elsen JM, Filangi O, Le Roy P 2012. 9. Lynch M, Walsh B:Genetics and Analysis of Quantitative TraitsSinauer; 1998. 10. Janss L, Shariati MM:Genomic estimation of heritability under different
gene action scenarios.Proceedings of the 9th Congress on Genetics applied to Livestock Production: 1-6 August 2010; Leipzig2010, 904.
11. Zeng J, Pszczola M, Wolc A, Strabel T, Fernando RL, Garrick DJ, Dekkers JCM:
Genomic Breeding Value Prediction and QTL mapping of QTLMAS2011 data using Bayesian and GBLUP methods.InProceedings of the XVth QTLMAS Workshop: 19-20 May 2011; Rennes FranceDemeure O, Elsen JM, Filangi O, Le Roy P 2012.
12. Wang CL, Ma PP, Zhang Z, Ding XD, Liu JF, Fu WX, Weng ZQ, Zhang Q:
Comparison of five methods for genomic breeding value estimation for the common dataset of the 15th QTL-MAS Workshop.InProceedings of the XVth QTLMAS Workshop: 19-20 May 2011; Rennes FranceDemeure O, Elsen JM, Filangi O, Le Roy P 2012.
13. Habier D, Fernando RL, Dekkers JCM:The impact of genetic relationship information on genome-assisted breeding values.Genetics2007,
177:2389-2397.
14. Clark SA, Hickey JM, van der Werf JHJ:Different models of genetic variation and their effect on genomic evaluation.Genet Sel Evol2011,
43:18.
doi:10.1186/1753-6561-6-S2-S12
Cite this article as:Shariatiet al.:A two step Bayesian approach for genomic prediction of breeding values.BMC Proceedings20126(Suppl 2): S12.
Submit your next manuscript to BioMed Central and take full advantage of:
• Convenient online submission
• Thorough peer review
• No space constraints or color figure charges
• Immediate publication on acceptance
• Inclusion in PubMed, CAS, Scopus and Google Scholar
• Research which is freely available for redistribution