CHAPTER THREE
1Phase Two: Pilot Study One
23.1 INTRODUCTION
3In order to answer the research question posed in Phase Four of this research, a 4
method of recording and measuring the effects of Neuro-Developmental 5
Treatment (NDT) on function during task performance was developed. This 6
chapter reports on the first of two pilot studies that were conducted to: 7
a) Identify suitable functional activities during which the impact of NDT on 8
children with different types of cerebral palsy (CP) could be studied. 9
b) Break down each activity into measurable motor phases using biomechanical 10
task analysis. 11
c) Generate Goal Attainment Scaling (GAS) that reflected increments of the 12
desired change in performance. 13
14
This Pilot Study One was guided by the research sub-question: “How can Goal 15
Attainment Scaling (GAS) be used to reliably evaluate change in task 16
performance from video taped pre-test and post-test data of two children with 17
cerebral palsy (CP) who had each received a one hour session of NDT?” The 18
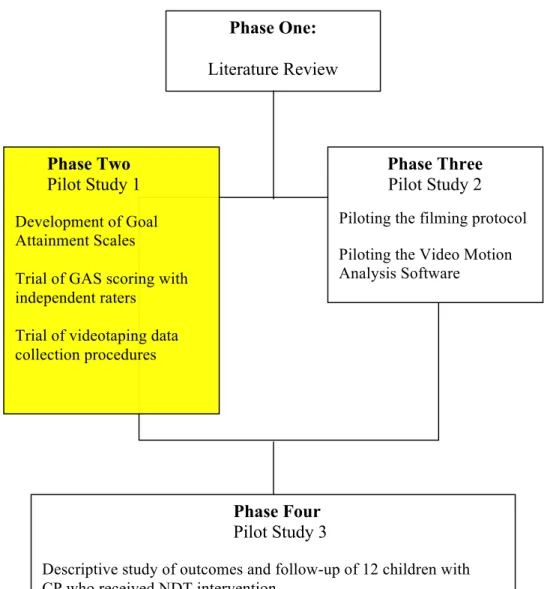
contribution of this pilot study in the overall research is highlighted in Figure 3.1. 19
20 21
1 3 5 7 9 11 13 15 17 19 21 23 25 27 29 31 33 35 37 39 41 43 45 47 49 51 53 55 57 59 61 63 65
Figure 3.1: Visual representation of the four phases of the study, with Phase Two 66
highlighted. 67
68
Pilot Study One was directed by two aims. First, the use of GAS as an outcome 69
measure of performance in daily living tasks was trialed. Expert NDT 70
practitioners, who were blinded to the stage of intervention, evaluated change in 71
the performance of two children with CP who had received a one hour session of 72
NDT. They used GAS scales developed by the researcher from videotaped pre- 73
and post-performances of daily living tasks. Second, this part of the research 74
Phase One: Literature Review
w
Phase Four Pilot Study 3
Descriptive study of outcomes and follow-up of 12 children with CP who received NDT intervention.
Trial of NDT Measurement model
Phase Three Pilot Study 2 Piloting the filming protocol Piloting the Video Motion Analysis Software Phase Two
Pilot Study 1 Development of Goal Attainment Scales
Trial of GAS scoring with independent raters
Trial of videotaping data collection procedures
represented the first of two training periods for independent raters in using these 1
outcome measures, preparing them for rating the final phase of the study that is 2
reported in Chapter Five. 3
4
3.2 METHODOLOGY
53.2.1 Design
6A modified critical case study was used to trial the use of Goal Attainment 7
Scaling (GAS) to describe the functional and motor changes that were evident 8
after one hour of NDT intervention in two children. Case study design is 9
particularly suited to situations where little is known about phenomena, or when a 10
number of human factors are involved (Salminen, Harra, & Lautamo, 2006). In 11
this part of the research, little is known about the impact of the phenomenon of 12
NDT upon task performance. The number of human factors that are involved 13
include classification of cerebral palsy, type of activity performed, intervention 14
time, motor function (system-based, task-related posture and movement 15
behaviours as well as associated non-motor behaviours, such as vision and self- 16
regulation) and level of functional performance in specific tasks. Case study 17
research has contributed important information about the functional changes 18
experienced by children after occupational therapy intervention (Case-Smith, 19
1996; Hoare, Imms, Rawicki, & Carey, 2010; Uyanįk, Bumin, & Kayihan, 2003), 20
and after NDT intervention specifically (Arndt, Chandler, Sweeney, Sharkey, & 21
McElroy, 2008; Bar-Haim et al., 2006; Girolami & Campbell, 1994; Tsorlakis, 22
Evaggelinou, & Tsorbatzoudis, 2004; Uyanįk, Bumin, & Kayihan, 2003; Yin, 23
of GAS for use in the final phase of the research, and b) as a means to train expert 1
independent raters in its use for the final phase of the research. 2
3
3.2.2 Participants and recruitment methods
4In critical case study research, ‘typical’ subjects, deemed to represent the essential 5
propositions under study (Yin, 2002) and the target subject group for future 6
research are selected (Miles & Huberman, 1994; Yin, 2003). In this study, there 7
were two groups of participants: the child participants and the instructor 8
participants. 9
10
3.2.2.1 Child participants 11
The videotaped performances of functional tasks of two children with cerebral 12
palsy were chosen from a ‘bank’ of videotapes that are available for educational 13
use by NDT Course Instructors. The videotaped material consisted of pre- and 14
post- treatment videotapes of two children who had received ‘demonstration NDT 15
treatments’ by two NDTA Instructors during an NDTATM eight week Paediatric 16
Certification Courses in the USA. The treatments had been recorded on mini- 17
digital videotapes, for which parents had given consent. 18
19
The two children selected for the study, from the range of videotaped data, met 20
the following criteria which reflected the major variables under study in this 21
research: a history of referral to occupational therapy for difficulties in motor 22
aspects of daily activities, diagnosis of cerebral palsy and associated co- 23
morbidities, receiving NDT intervention, and family consent for use of videotaped 24
One of the children (J) had been selected to receive NDT intervention that was to 1
be videotaped from a group of children whose parents had ‘volunteered’ them to 2
be participants in regular treatment practicums of an NDT Certificate course. A 3
demonstration treatment session by the Coordinator Instructor (Physical 4
Therapist) for the course was recorded. The second child (S) was receiving 5
intervention at the facility where an NDT certificate course was being held. The 6
NDTA TM Occupational Therapy Instructor for the course selected him for an 7
NDT demonstration treatment session. 8
9
Children are generally selected for demonstration treatment sessions on the basis 10
of differences in age, severity, type of cerebral palsy, and comfort with 11
observation by a small number of therapists. The purpose of the demonstrations 12
was to show therapists who were receiving postgraduate training in NDT how 13
intervention can be directed towards improved function in a nominated daily task. 14
Consent was obtained for use of videotaped material collected during the course 15
by the Coordinator Instructor. 16
17
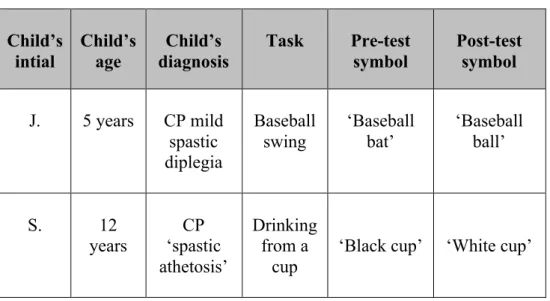
Individual characteristics available for each child are summarized in Table 3.1. 18
Child J was five years of age and his diagnosis was CP characterised by mild 19
spastic diplegia. While no other co-morbidity was known, he did have an 20
orthopaedic physician monitoring ongoing lower extremity development. He 21
lived at home with his family, attended mainstream school and functioned at an 22
age appropriate level in his learning ability. He required some assistance in 23
activities of daily living. However, he was able to ambulate independently in the 24
1
Child S was twelve years of age with a diagnosis of CP with spastic athetosis and 2
cognitive impairment and reduced expressive language. He was able to answer 3
yes / no questions and follow verbal instructions. In addition, he had a visual 4
impairment. He lived at home with his family and attended a special class for 5
children with disabilities. He required full physical assistance for all daily care. 6
7
Table 3.1: Children, tasks and task symbols 8
Child’s intial Child’s age Child’s diagnosis Task Pre-test symbol Post-test symbol J. 5 years CP mild spastic diplegia Baseball swing ‘Baseball bat’ ‘Baseball ball’ S. 12 years CP ‘spastic athetosis’ Drinking from a cup
‘Black cup’ ‘White cup’
9
3.2.2.2 Instructor participants 10
Thirteen of the total cohort of American NDT ‘Coordinator Instructors’ (n=17) 11
were invited to participate in the study through an emailed letter from the 12
researchers (Appendix I). Consent was either returned by email or personally 13
delivered to the researcher at an Instructor Group meeting. Ten of the 14
Coordinator Instructors (CIs) agreed to participate, with the remaining three 15
instructors not available to participate. 16
17
Participant instructors met the following criteria: membership of the NDTA 18
skill in evaluation of motor aspects of functional performance, consent to 1
participation (See Appendix I), experience as paediatric therapists, and were not 2
known to the two child participants described above. 3
4
3.2.3 Functional tasks chosen for measurement pre- and post-
5Neuro-Developmental Treatment
6Child J, the first of the children described previously, played in the community T- 7
ball team, but with difficulty. He was motivated to improve his ‘baseball’ (T ball) 8
swing (Figure 3.2). The second child, (S), was only able to drink from an ‘infant’ 9
closed cup independently. Child S and his family wanted him to drink from an 10
open cup independently, particularly when he was drinking in community 11
contexts. These tasks became the designated intervention goals for the children, 12
and are included in Table 3.1. The task symbol names referred to in Table 3.1 13
were used as ‘identifiers’ of either the pre-test or the post-test performance which 14
was viewed by ‘blind’ raters and scored as described below. 15
16
17
Figure 3.2: Pre-test of baseball swing 18
3.2.4 Data collection instruments
13.2.4.1 Biomechanical task analysis 2
As stated in Chapter Two, task analysis is an initial part of the NDT process. The 3
process of task analysis involves breaking a skill or activity down into its 4
component parts and sequencing those parts into a progression. Biomechanical 5
task analysis involves further identification of motor components or ‘focal points’ 6
of the activity that assist or hinder task performance (Short, 2005). Use of 7
biomechanical task analysis within a natural environment yields information 8
about the steps of the task that may or may not be difficult, the actions which are 9
either present, missing, or inhibitive to task performance, and the impact of 10
environmental variables (such as people and objects) on each part of the task. In 11
this study, biomechanical task analysis was performed on each child’s task 12
performances, and a sequence of steps of the tasks, and the actions that were 13
strengths or difficulties were identified. Generally, this information is used by 14
therapists in making decisions about which steps or movements within the task 15
performance to target in NDT intervention, and to set goals relative to those 16
decisions. Information from the biomechanical task analyses was used by the 17
therapists who treated the two child participants in this study to assist them in 18
choosing NDT intervention strategies in the form of physical and verbal prompts 19
which were subsequently applied to generate more effective performance, and 20
hence, meet the designated session goal. 21
22
In this study, the biomechanical analysis was utilized to generate a specific Goal 23
Attainment Scale for each of the two child participants, relative to their functional 24
in viewing the video footage of child J’s T-Ball biomechanical task analysis prior 1
to intervention, it was noted that child J was unable to maintain an aligned right 2
hip over a semi-flexed knee as he rotated to swing the bat and, as a result, he 3
required three steps to regain his balance post-swing. This was recorded at the 4
GAS -2 level, reflecting the baseline performance below a nominated desired 5
performance, which was set at 0. During later stages of the NDT session, he was 6
able to maintain hip alignment (closed chain abduction) for balance, and as a 7
result, he only required one step post-swing, to regain his balance. This was 8
recorded at the GAS +2 level, reflecting the extent to which intervention exceeded 9
the desired outcome of 0. This process is further described in the following 10
section. 11
12
3.2.4.2 Goal Attainment Scaling (GAS) 13
Goal Attainment Scaling (Kiresuk et al, 1994) was chosen as a way to measure 14
change between pre- and post-NDT intervention, as it is reported to have the 15
capacity to measure specific and targeted change in a range of daily living tasks. 16
GAS is a reliable, sensitive, and valid intervention outcome measure in paediatric 17
practice, and has been widely used in situations where individual and unique 18
outcomes are the focus of intervention (Cardillo & Smith, 1994; Ottenbacher & 19
Cusick, 1989; Wallen, O'Flaherty, & Waugh, 2004). GAS was piloted in this part 20
of the research to evaluate its effectiveness as a measure of immediate change 21
after short periods of NDT intervention. 22
23
Support for the use of GAS in this research includes the following rationale. 24
which can be clearly placed on a scale (Maloney, Mirrett, Brooks, & Johannes, 1
1978; McLaren & Rodger, 2003). Second, it is able to measure outcomes despite 2
diagnosis, severity or the treatment program being used (Lannin, 2003; Maloney, 3
Mirrett, Brooks, & Johannes, 1978; McLaren & Rodger, 2003). It is able to 4
measure small functional changes, especially by children who have severe and 5
profound disabilities (Lannin, 2003). Third, valid conclusions can be drawn from 6
functional changes recorded on the GAS scale (McLaren & Rodger, 2003). 7
Fourth, it is a viable clinical practice, allowing for collaborative goal setting with, 8
for example, parents and children. Once the scaled goal statements are recorded, 9
it can be quickly scored in clinical situations (Lannin, 2003; McLaren & Rodger, 10
2003). Finally, individual goal setting is an inherent part of accepted NDT 11
practice and is therefore paramount to include in any study that aims to 12
demonstrate NDT effectiveness. 13
14
As discussed in the previous chapter, while there is significant support for the use 15
of GAS, the literature also cites difficulties that must be addressed when using it 16
for research purposes. Of significance, is the situation where the commonly used 17
-2 to +2 scale is no longer useful, such as when a person’s condition either 18
deteriorates, or becomes exceptionally good (Law, Oi-Sheung, & Sui, 2004). 19
However, an extra score level can be added (- 3 and +3) to allow for floor and 20
ceiling effects (See Table 3.2; Novak & MacIntyre, 2006; Steenbeek, Ketelaar, 21
Galama, & Gorter, 2007). The expanded scale was used in this first pilot study to 22
allow for a larger than expected response, with the intention of reviewing it's 23
usefulness before the next phase. 24
1
Table 3.2: Seven level Goal Attainment Scale (Novak & MacIntyre, 2006) 2
Seven Level Goal Attainment Scale Representing Performance Outcomes: + 3 exceeded expected performance on at least three dimensions + 2 exceeded expected performance in two dimensions
+ 1 exceeded expected outcome in one dimension
0 represents expected performance outcome, as expressed in goal, following e.g. one session of NDT
- 1 represents one dimension from completely reaching expected outcome
- 2 represents the pre-test performance
-3 represents a lower than expected performance on at least three dimensions
3
While GAS has been shown to be a reliable outcome measure, the degree of 4
reliability is somewhat dependent upon three variables: use by experienced ‘goal 5
setters’, precision in goals set, and multiple measurement periods (Lannin, 2003; 6
Law, Oi-Sheung, & Sui; McLaren & Rodger, 2003). The first two of these 7
variables has been addressed in this phase of the research. All three variables 8
have been addressed in the last phase of the research, described in Chapter Five. 9
10
3.2.4.3 Development of individual GAS tables 11
As displayed in Tables 3.3, 3.4, 3.5 and 3.6, each GAS score sheet included the 12
that is, the motor difficulty each child had in carrying out the nominated task (T- 1
Ball and drinking from a cup); and second, a realistic functional measurable goal. 2
This goal related to the functional limitation and aimed for a measurable change 3
following intervention. A seven point GAS scale was generated utilizing the 4
process described below. The goal, or expected outcome level for the two 5
children, was written according to the GAS method, with 0 reflecting the desired 6
goal, and progress in excess of the desired goal located at +1, +2 or +3 level and 7
performance less than the desired goal at -1, -2 or -3 level (Kiresuk, Smith, & 8
Cardillo, 1994). 9
10
For the purposes of this study, the ‘pre- and post-test behaviours’ were then set 11
using a modification of the GAS scale, to capture floor and ceiling effects (Novak 12
& MacIntyre, 2006). Extensions of the nominated ‘pre-test behaviours’ were set 13
at ‘below expected level’ (-3) and post-test behaviours were set at ‘above 14
expected level’ (+3) by the researcher (Table 3.2). In preparation for later studies, 15
a way to express functional change in maximum numerical terms was sought. 16
The scale was written using this GAS scale modification to determine whether it 17
would be possible for expert NDT practitioners to accurately observe, and mark 18
on a seven point scale (-3 to +3), the details of performance criteria change after 19
treatment (Marson & Dran, 2008). 20
21
The GAS scales for the two children were ‘broken down’ and documented in the 22
following way. 23
First, the two videotapes, each of a one hour NDT demonstration treatment, were 1
observed in full. Then, for each tape, the pre-test and post-test periods of task 2
performances only, were selected for repeated ‘step by step’ observation. A 3
biomechanical analysis was derived from the filmed data at both pre- and post- 4
test. Comparisons were made to determine the type and scope of motor and 5
functional change noted during task performance. 6
7
Second, using the information from biomechanical analysis and additional 8
observations, descriptive words that related to each child’s actions were written 9
into GAS levels. Intervening GAS levels (-2 to +2) were ‘filled’ by entering 10
hypothetical one point differences in one or more potentially measurable 11
parameters of change, such as weight distribution, alignment of hip with knee and 12
foot, pelvic femoral rotation and stance / step. Changes towards improved 13
function were included in ascending order within statements. The actual pre- and 14
post-test levels, allowing for ceiling effects such as the child performing better 15
than expected, were added to these levels and described respectively as 16
“Performance at a lower (-3) or higher (+3) level than -2 (or +2)”, without the 17
‘descriptive words’ for the reasons described (as stated in Tables 3.3 and 3.4). 18
The format of pre-test and post-test scales was identical for both tasks (‘swinging 19
the bat’ or ‘drinking from a cup’). 20
21
Slow play, ‘step by step’ playing, replays and editing continued, to ensure all 22
written observations were accurate in describing the visual data for each child. 23
functional measurable goal. For example, lower extremity actions in the task of 1
hitting the ball were described in detail (See Tables 3.3 and 3.4). 2
3
Finally, each pre- and post-test scale was assigned a code that nominated them as 4
either pre- or post-test video footage. The codes were ‘baseball bat’ and baseball 5
ball’ for child J, and ‘black cup’ and ‘white cup’ for child S. 6
7
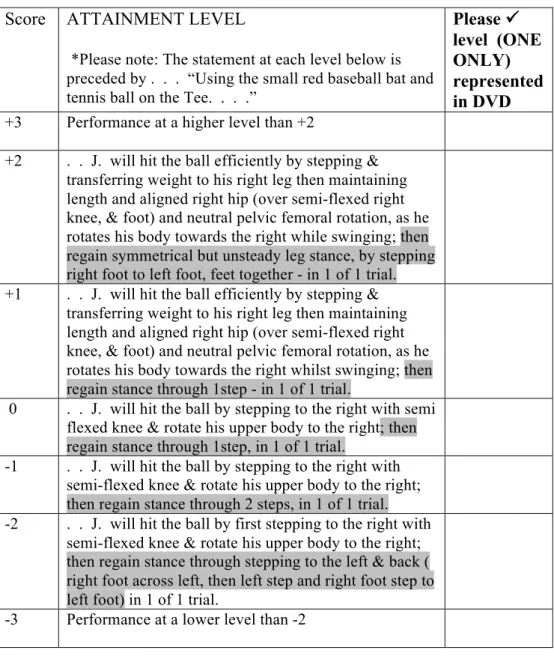
The GAS levels are outlined in Tables 3.3 and 3.4. In each table, the relevant 8
functional difficulty is labeled “Activity limitation”. The functional goal 9
nominated as an intervention outcome is labeled “Functional Goal”. For ease in 10
reading this report, some differences that were used to nominate performance 11
level are highlighted in child J’s GAS scale (Table 3.3). These relate to his ability 12
to regain stance. In the GAS scale for child J, the seven parameters of potential 13
change were combined in the levels of the scale. The performance level of all 14
parameters is not described at every level. For example, there was no description 15
of ‘length and alignment’ at the right hip at -2, though it was described (and 16
indicated positive change in function) by the +1 level. The seven parameters of 17
movement were: 18
1. Initiate with a step (mentioned all levels). 19
2. Transfer weight. 20
3. Neutral pelvic femoral rotation. 21
4. Rotate upper body to right (after the fact, there should also have been mention 22
of pelvic rotation). 23
5. Maintain length and alignment: right hip. 24
6. (and) swing at the same time. 25
Four separate GAS charts were developed: two each for the two children. The 1
pre-test charts for child J and child S were respectively labeled for the CI raters: 2
‘Baseball bat’ and ‘Black cup’ and the post-test charts ‘baseball ball’ and ‘White 3
cup’. Even though the charts contained identical descriptions at each GAS level 4
for each child, separately labeled charts were created for both ease of 5
identification for the researcher for accuracy in randomization and packaging and 6
charting the results returned from the CIs. The labels chosen were neutral words 7
to avoid indication to CIs of the accompanying DVD pre- or post-test video 8
footage. 9
Table 3.3: GAS score sheet for child J with differences between each level 1
highlighted. 2
3
CHILD J: “BASEBALL BAT” / “BASEBALL BALL” 4
Activity limitation: Hitting with a baseball bat. 5
Functional goal: Using the small red baseball bat and tennis ball on the Tee* ‘J.’ 6
will hit the ball by stepping to the right with semi flexed knee and rotate his upper 7
body to the right; then regain stance through one step in one trial. 8
9 Score ATTAINMENT LEVEL
*Please note: The statement at each level below is preceded by . . . “Using the small red baseball bat and tennis ball on the Tee. . . .”
Please level (ONE ONLY) represented in DVD +3 Performance at a higher level than +2
+2 . . J. will hit the ball efficiently by stepping & transferring weight to his right leg then maintaining length and aligned right hip (over semi-flexed right knee, & foot) and neutral pelvic femoral rotation, as he rotates his body towards the right while swinging; then regain symmetrical but unsteady leg stance, by stepping right foot to left foot, feet together - in 1 of 1 trial. +1 . . J. will hit the ball efficiently by stepping &
transferring weight to his right leg then maintaining length and aligned right hip (over semi-flexed right knee, & foot) and neutral pelvic femoral rotation, as he rotates his body towards the right whilst swinging; then regain stance through 1step - in 1 of 1 trial.
0 . . J. will hit the ball by stepping to the right with semi flexed knee & rotate his upper body to the right; then regain stance through 1step, in 1 of 1 trial.
-1 . . J. will hit the ball by stepping to the right with semi-flexed knee & rotate his upper body to the right; then regain stance through 2 steps, in 1 of 1 trial. -2 . . J. will hit the ball by first stepping to the right with
semi-flexed knee & rotate his upper body to the right; then regain stance through stepping to the left & back ( right foot across left, then left step and right foot step to left foot) in 1 of 1 trial.
-3 Performance at a lower level than -2
10 11
Table 3.4: GAS score sheet for child S. 1 2
CHILD S. “BLACK CUP” / “WHITE CUP” 3
Activity limitation: Drinking independently from his cup during family outings. 4
Functional measurable goal: Seated in his wheelchair, with support under both 5
elbows & verbal encouragement*, S. will take his spout cup towards his mouth, 6
by moving his head forwards in the midline, looking towards his cup, & holding 7
his cup (need not be symmetrically held) with 2 fingers & thumbs (both hands), in 8
two of two trials. 9
10 Score ATTAINMENT LEVEL
*Please note: to save space, the statement at each level below is preceded by “Seated in his wheelchair, with support under both elbows & verbal encouragement,” . . Please level (ONE ONLY) represented in DVD
+3 Performance at a higher level than +2
+2 . . S. will drink from his spout cup by moving his head forwards in the midline, looking towards his cup & holding it symmetrically with 3 fingers & thumbs (both hands), for the duration of 1 sip, in 1 of 2 trials. +1 . . S. will take his spout cup to his mouth by moving
his head forwards in the midline, looking towards his cup & holding it symmetrically with 3 fingers & thumbs (both hands), in 1 of 2 trials.
0 . . S. will take his spout cup towards his mouth, by moving his head forwards in the midline, looking towards his cup, & holding his cup (need not be symmetrically held) with 2 fingers & thumbs (both hands), in 2 of 2 trials.
-1 . . S. will take his spout cup towards his mouth, with his head in the midline, by holding his cup ( need not be symmetrically held) with index fingers & thumbs, in 2 of 2 trials
-2 . . S. will take his spout cup towards his mouth by holding his cup (need not be symmetrically held) with index fingers & thumbs, in 1 of 2 trials
-3 Performance at a lower level than -2
11 12
1
3.2.4.4 Goal Attainment Scaling video editing process 2
A video camera was used to edit the original videotapes of the two children’s 3
performances, by means of a cable link to imovie™ on a Macintosh PowerBook 4
G4 laptop. The videos were edited to include only the pre- and post-performances 5
by both children from the ‘one hour’ treatment tapes. 6
7
The video footage that was chosen for inclusion on the DVDs best portrayed the 8
same performance conditions and same camera angles in both pre-test and post- 9
performance. 10
11
To enhance accuracy in the CI raters’ observations, ‘repeat, play and slow play’ 12
performance sequences of task performance were also included in each edited 13
video clip, and followed the ‘real time’ performance. 14
15
All footage was then exported to create pre- or post-DVDs in both PAL and 16
NTSC formats for viewing in both Australia and the USA. The DVDs were 17
labeled to maintain the ‘blinded’ condition when viewed by raters. 18
19
3.3 DATA COLLECTION PROCEDURES
20Following receipt of consent from the instructor participants, the researcher sent 21
them a follow up letter and an attached example of a GAS NDT scale and 22
explanation of what would be expected of them in the rating process (Appendices 23
II & III). After the video editing process of the two children was complete, the 24
children’s performances. Included in each DVD package were viewing and 1
scoring instructions (Table 3.5), and the appropriate GAS score sheet for each 2
child (Tables 3.3 and 3.4). They returned the DVDs and the completed associated 3
scoring sheets to the researcher. 4
5
Table 3.5: Rater instructions for viewing and scoring DVDs. 6
7
8
INSTRUCTIONS FOR VIEWING AND SCORING DVDs 9
1. Load DVD into DVD player or computer with DVD Drive 10
11
2. Press ‘play’ in center of black DVD frame OR ‘enter’ on remote control, 12
on computer keyboard or on onscreen controls. 13
14
3. Each clip will run, then repeat/s will follow and finally slow play 15
version/s, all of the same clip. 16
17
4. Check one (only!) statement that corresponds with your assessment of 18
performance on the GAS chart. 19
20
5. The charts & DVDs can be matched up by the correct symbols of two 21
different baseball pictures and two different cup pictures! 22
23
6. Simply return email me the symbol name on each DVD and your 24
25
7. Score (-3 to +3 ) which goes with it. E.g. “baseball bat -2” 26
27
8. Return the DVD to the address provided. 28
29
9. Could you please email this by 15th June, or sooner if you like! 30
31
10. I will then mail you the next two DVDs, which will be viewed and scored 32
in the same symbol name and scoring format and returned to me by 6th 33
July. 34
35 36
Thank you, Kate Bain 37
38 39
After one month, the CIs viewed the third and fourth assigned DVDs, of the two 1
children. They were again blinded to whether each DVD they received comprised 2
video footage of a pre- or post-intervention performance. 3
4
The estimated scoring time in the Pilot Study was 10 minutes per child or less for 5
the short clips, which were of one to seven minutes duration. At the conclusion of 6
the pilot study, the 10 CIs each returned the final two scores by email. Following 7
analysis, the CIs were sent a feedback letter of thanks for participation and some 8
information about the results and potential relevance of the rating scale as an 9
outcome measure for further studies (Appendix IV). 10
11
3.4 DATA ANALYSIS AND RESULTS
123.4.1 Goal Attainment Scales
133.4.1.1 Analysis 14
Four sets of GAS scores were obtained from each of the 10 raters (See Figure 15
3.3). 16
17
The GAS scores generated by the researcher were calculated by assigning a score 18
of -3 or +3 respectively to the two pre-test and post-test videos. Individual GAS 19
scores from each of the participating CI raters, ranging from between -3 to +3 20
were recorded from each of score sheets returned. All sets of scores from the CI 21
raters were entered into a Microsoft EXCEL™ spreadsheet from which bar graphs 22
were generated to allow for visual comparison between and among scores (See 23
Figure 3.3 and Table 3.8). 24
The CIs’ total rating scores were ranked to determine which of the CIs obtained a 1
total GAS score closest to that of the researcher. The scores were ranked using 2
the following ratings: three points were assigned to a rater for an appropriate + 3 3
or – 3 score, two points for an appropriate + 2 or – 2 score, one point for an 4
appropriate + 1 or – 1 score, 0 points for a 0 score, 0 points if the + or – rating was 5
in the wrong ‘direction’. Therefore higher scores were ranked from one being the 6
highest score to eight being the lowest score. 7
8
Visual analysis of graphs enabled data sets to be interpreted by visually exploring 9
patterns, structure, and exceptions. Visual inspection and graph analysis are 10
accepted methods of data reduction in applied behaviour research where the 11
number of subjects is very small, or when the research is in the pilot phase 12
(Ottenbacher, 1986). 13
14
One of the criticisms of visual analysis of graphed data has been the lack of 15
formal ‘decision rules or guidelines’ (Ottenbacher, 1986. p.164), and poor 16
agreement between visual and statistical inference (Fish, 1998). However, these 17
criticisms have been applied primarily to visual analysis of a series of data. 18
19
3.4.1.2 Results 20
Comparison of CI GAS scores with researcher GAS scores 21
The pre- and post-test GAS scores generated by the researcher are presented in 22
Tables 3.6 – 3.7. Each of the scores obtained from the CIs was compared against 23
the researcher’s pre-performance score of -3.0 for both tasks, and post 24
performance scores of +3.0 for both tasks. 25
1
Table 3.6: Pre- and Post-test GAS scores generated by the researcher for Child J. 2
Pre-test GAS level highlighted in yellow and post-test GAS level highlighted in 3
turquoise. 4
5 Score ATTAINMENT LEVEL
*Please note: To save space, the statement at each level below is preceded by . . . “Using the small red
baseball bat and tennis ball on the Tee. . . .”
Please
level (ONE ONLY) represented in DVD
+3 Performance at a higher level than +2
+2 . . J. will hit the ball efficiently by stepping & transferring weight to his right leg then maintaining length and aligned right hip (over semi-flexed right knee, & foot) and neutral pelvic femoral rotation, as he rotates his body towards the right whilst swinging; then regain symmetrical but unsteady leg stance, by stepping right foot to left foot, feet together - in 1 of 1 trial. +1 . . J. will hit the ball efficiently by stepping &
transferring weight to his right leg then maintaining length and aligned right hip (over semi-flexed right knee, & foot) and neutral pelvic femoral rotation, as he rotates his body towards the right whilst swinging; then regain stance through 1step in 1 of 1 trial.
0 . . J. will hit the ball by stepping to the right with semi-flexed knee & rotate his upper body to the right; then regain stance through 1step, in 1 of 1 trial. -1 . . J. will hit the ball by stepping to the right with
semi-flexed knee & rotate his upper body to the right; then regain stance through 2 steps, in 1 of 1 trial. -2 . . J. will hit the ball by first stepping to the right with
semi flexed knee & rotate his upper body to the right; then regain stance through stepping to the left & back ( right foot across left, then left step and right foot step to left foot) in 1 of 1 trial.
-3 Performance at a lower level than -2
6 7
Table 3.7: Pre- and Post-test GAS scores generated by the researcher for Child S. 1
Pre-test GAS level highlighted in yellow and post-test level GAS highlighted in 2
turquoise. 3
4 Score ATTAINMENT LEVEL
*Please note: to save space, the statement at each level below is preceded by “Seated in his wheelchair, with support under both elbows & verbal encouragement,” . . Please level (ONE ONLY) represented in DVD
+3 Performance at a higher level than +2
+2 . . S. will drink from his spout cup by moving his head forwards in the midline, looking towards his cup & holding it symmetrically with 3 fingers & thumbs (both hands), for the duration of 1 sip, in 1 of 2 trials. +1 . . S. will take his spout cup to his mouth by moving
his head forwards in the midline, looking towards his cup & holding it symmetrically with 3 fingers & thumbs (both hands), in 1 of 2 trials.
0 . . S. will take his spout cup towards his mouth, by moving his head forwards in the midline, looking towards his cup, & holding his cup (need not be symmetrically held) with 2 fingers & thumbs (both hands), in 2 of 2 trials.
-1 . . S. will take his spout cup towards his mouth, with his head in the midline, by holding his cup ( need not be symmetrically held) with index fingers & thumbs, in 2 of 2 trials
-2 . . S. will take his spout cup towards his mouth by holding his cup (need not be symmetrically held) with index fingers & thumbs, in 1 of 2 trials
-3 Performance at a lower level than -2
5
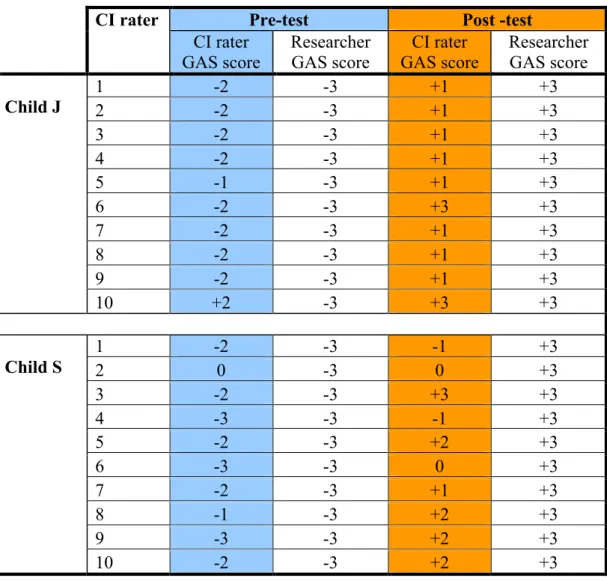
None of the CIs were in perfect agreement with the researcher’s GAS rating of 6
both pre- and post-performance scores (Table 3.8 and Table 3.9). Overall, total 7
agreement was achieved for six of the 40 GAS scores, or 15% of cases. The 8
majority of CI raters scored at least one GAS level score from the researcher’s 9
GAS score of either -3 (pre-test) or +3 (post-test). While there was some 10
difference in the degree of goal attainment, visual analysis of the graphed data 11
indicated that there was, however, agreement between CI raters and the researcher 12
1
Table 3.8: Comparison of the pre- and post-test GAS scores generated by the CIs 2
for each child with the scores assigned by the researcher. (Missing scores denoted 3
by 0). 4
5
Pre-test Post -test
CI rater CI rater GAS score Researcher GAS score CI rater GAS score Researcher GAS score 1 -2 -3 +1 +3 2 -2 -3 +1 +3 3 -2 -3 +1 +3 4 -2 -3 +1 +3 5 -1 -3 +1 +3 6 -2 -3 +3 +3 7 -2 -3 +1 +3 8 -2 -3 +1 +3 9 -2 -3 +1 +3 Child J 10 +2 -3 +3 +3 1 -2 -3 -1 +3 2 0 -3 0 +3 3 -2 -3 +3 +3 4 -3 -3 -1 +3 5 -2 -3 +2 +3 6 -3 -3 0 +3 7 -2 -3 +1 +3 8 -1 -3 +2 +3 9 -3 -3 +2 +3 Child S 10 -2 -3 +2 +3 6
Percentage agreement of each Coordinator Instructor (CI) rater with the researcher 7
for their four GAS scores are recorded in Table 3.9. This analysis was carried out 8
to determine the proximity of the CI GAS scores to those of the researcher for the 9
two children at pre- and post-test, in the performance of their two daily tasks. 10
Data was obtained from analysis of the four DVDs of the pre-test DVD and post- 11
test DVD for each of the two children who were each evaluated by each CI rater. 12
test GAS level (–3) or post-test GAS level (+3) were tallied. In Table 3.9, 1
percentage agreement is recorded in column two, with no agreements by the CI 2
with the researcher recorded as 0% agreement; similarly, 25% represented one 3
agreement and 50% represented two agreements. No CI agreed with the 4
researcher beyond 50%. The overall level of agreement between the CI raters and 5
the researcher 15% ± 10.8 at the 95% confidence level (0.05, SD =17.5, n = 10). 6
That is, of a possible 100% agreement by each of the ten raters (if each rater 7
agreed with the researcher on all 4 scores) there was only a 15% agreement, or 6 8
scores that were in complete agreement with the researcher’s -3 or +3 scores. 9
10
Table 3.9: Percentage Agreement of the CI raters with the researcher. 11
12 CI Rater Percentage Agreement 1. 0% 2. 0% 3. 25% 4. 25% 5. 0% 6. 50% 7. 0% 8. 0% 9. 25% 10. 25% 13
In summary, there was agreement in the direction of post-performance goal 14
attainment in both children between CI raters and the researcher (see Table 3.8). 15
Agreement with the researcher did not exceed two of four of the GAS levels, as 16
1
3.4.2 Coordinator Instructor (CI) rater rankings
2Of the 10 raters, eight raters were retained for the second pilot study based on the 3
ranking and the percent agreement between the researcher and CI. This was 4
achieved by visual analysis of the scores as ranked in Table 3.10 and was based 5
on those raters who scored within six points of the researcher’s score. 6
7
Table 3.10: Visual analysis of raters’ scores compared with researcher’s scores. 8
Key: 3 points for an appropriate + or – 3 score, 2 points for an appropriate + or – 2 score, 9
1 point for an appropriate + or – 1 score, 0 points for a 0 score, 0 points if + or – in wrong 10
‘direction’ 11 12 13 14 15 16 17 18 19 20 21 22 23 24 25 RATER
NUMBER RESEARCHER’S TOTAL SCORES
RATER’S TOTAL SCORES RANKING 1 12 5 6 2 12 3 7 3 12 8 1 4 12 6 5 5 12 6 5 6 12 8 1 7 12 6 5 8 12 6 5 9 12 8 1 10 12 7 4
1
3.4.3 Identification of changes to the measurement model to
2better accommodate variables to be measured in future
3phases of the research
4The videotaped data utilized in this study were generated by instructors for 5
teaching, rather than for research purposes. There were few controls put in place 6
to make sure the pre- and post-filmed performances occurred under exactly the 7
same conditions. Therefore, the last part of this pilot study utilized a second 8
detailed biomechanical analysis of the pre- and post-performance data of the two 9
child participants to determine: a) the performance variables that may need to be 10
considered or controlled as measurement variables in later phases of the research 11
which aimed to use pre- and post-videotaping of performance, and b) changes to 12
filming procedures that may lead to improved visual analysis. 13
14
Additional quantitative parameters of movements required for hitting a baseball or 15
drinking from a cup were identified and measured. These are listed in Table 3.11 16
and represented additional movement parameters during task performance that 17
might have been required to measure changes in function and movement in further 18
phases in the research. 19
20
During this second biomechanical analysis, it was noted that aspects of motor 21
performance could not be clearly viewed onscreen. For example, raters were 22
unable to clearly judge a change in rotation around the body axis from pre- to 23
post-test swinging the baseball bat, although this had occurred. An example of 24
conditions that differed was shoes being worn at the pre-test phase but not during 25
It was clear that the ‘onscreen’ measurements used in this pilot study were not 1
always suitable for the type of task analysis used in GAS, and that comparison 2
between the pre and post-test performances of children required a more 3
sophisticated filming procedure that could be used within a clinical setting. This 4
investigation became the target of Pilot Study Two, reported in the Chapter Four. 5
6
Table 3.11: Further quantitative outcome measures, by ‘onscreen’ observation 7
and measurement. 8
9 Further Quantitative Outcome Measures,
‘Onscreen’ Observation and Measurement Numerical Value
1. Time taken to perform task. % change
2. Goniometric range of movement changes in task component/s (Hough & Hughes, 2006).
Degrees 3. Assistance given:
• More distal or proximal on body part • More or less time hands on (same body
part).
Millimetres (mms) Seconds
4. Task component performance measures e.g. number of steps taken, number of grasps / re-grasp in task within a certain time frame.
Numerical score 5. Number of trials in a given number, performed
successfully. % correct
6. Number of environmental manipulations – examples:
• Verbal encouragement.
% change 7. Presence or absence of certain task related
movements (refer to written functional outcome conditions) Examples:
• Vision directed to task
• One limb moves independent of other • Rotation from midline
• Two hands used
• Intra or inter limb coordination (e.g.
requirement for humeral flexion and elbow extension) • Mirroring • Involuntary movement. Numerical score applied to yes (1) or no (0)
8. Percentage of hand surface used to assist child’s movement e.g. grasp versus fingertip assist.
Surface area in mms converted to %
1
3.5 SUMMARY OF RESULTS AND OUTCOMES
2Pilot Study One addressed the use of GAS by expert NDT practitioners in the 3
measurement of changes in functional performance of a target task by two 4
children with cerebral palsy and in particular the question: 5
“Could Goal Attainment Scaling (GAS) be used to reliably evaluate change in 6
performance from video taped pre-test and post-test data of two children with 7
cerebral palsy, who had each received a one hour session of NDT?” 8
9
The following findings and their contributions to the subsequent phases of the 10
study are summarised below: 11
12
3.5.1 Finding One:
13GAS scaling was found to be an outcome measurement that could be used to 14
evaluate change in performance. The GAS scaling process described small, 15
clinically meaningful steps of change in performance from pre-test to post-test for 16
both these children with cerebral palsy. 17
18
The researcher included more than one parameter for measurement per GAS 19
scale, making it difficult for raters to nominate the extent to which performance 20
could be exactly matched to a particular level in the GAS. For example, in the 21
GAS scale for child J, the seven parameters observed and scaled for goal related 22
potential change, were listed and combined in the various levels of the scale. The 23
disadvantage for this incorrect GAS scale formation is that a progression of 24
rating, through the levels. An example of this is the description “then regain 1
stance through 1 step”, which is identical at two levels, 0 and +1 (Table 3.3). 2
Each parameter of potential measured change should have been allotted to a 3
separate GAS subscale for each of the children. Following further study, 4
including correspondence with a GAS author, (Marson & Dran, 2008), GAS scale 5
construction was amended for the final Pilot Study Three. 6
7
3.5.2 Finding Two:
8Eight expert CI raters who had practiced rating videotaped task performance using 9
GAS as an outcome measure were selected for the next phase of the research, 10
Pilot Study Two on the basis of the proximity of their GAS ratings. 11
12
3.5.3 Finding Three:
13Percentage Agreement of ‘exact agreement’ between the 10 CI raters with the 14
researcher for a -3 GAS score at pre-test or a +3 at post-test was, at best 50% for 15
one rater, with five raters having no exact agreement on the four data points. To 16
increase precision and reliability in quantitative measurement the following 17
changes to the measurement model were suggested: use of the standard -2 to +2 18
GAS scale, improvement in clarity of the video footage (by, for example, 19
incorporating three camera angles), and the use of a filming protocol to include 20
precise replication of conditions for pre- to post-test filming. 21
22 23 24 25
3.5.4 Finding Four:
1Compilation of a detailed list of other potential ‘onscreen’ quantitative 2
measurements that could be utilized in future phases of the research, such as 3
change in time taken and joint range of motion. 4
5
3.5.5 Finding Five:
6Use of this ‘list’ for visual analysis and onscreen measurement from pre- to post- 7
test video footage only resulted in rudimentary calculations, as ‘apparent’ change 8
was often difficult to view and measure: for example, a positive change in trunk 9
rotation pre- to post-test. It was determined to further investigate and pilot 10
suitable video motion analysis software for onscreen measurements to be utilized 11
in further phases of the research. 12
13
Further discussion of the outcomes of this Pilot Study One and its links to the 14
studies which followed, will be addressed in the final chapter of this thesis. 15