CMC Senior Theses CMC Student Scholarship
2016
Peer Misbehavior Effects in the Classroom
Alex Hwung
Claremont McKenna college
This Open Access Senior Thesis is brought to you by Scholarship@Claremont. It has been accepted for inclusion in this collection by an authorized administrator. For more information, please [email protected].
Recommended Citation
Hwung, Alex, "Peer Misbehavior Effects in the Classroom" (2016).CMC Senior Theses.Paper 1345. http://scholarship.claremont.edu/cmc_theses/1345
Peer Misbehavior Effects in the Classroom
submitted to Professor David Bjerk
by Alex Hwung for Senior Thesis Spring 2016 4/25/2016
E F F E C T S I N T H E
C L A S S R O O M
a l e x
h w u n g
4
/
25
/
2016
This paper seeks to evaluate the effects of peer misbehavior in the classroom on student learning outcomes–namely, if there is any truth behind the old saying that “one bad apple ruins the bunch”. Using experimental data, I show that there is a strong initial relationship between the level of misbehavior in a given classroom and performance on a mathematics evaluation; however, the inclusion of lagged peer achievement in the model causes most of that relationship to be absorbed away, suggesting that the bulk of peer effects stem more from the academic performance of other students than from their behavior.
c o n t e n t s
1 Introduction 5
2 Literature Review 6
2.1 Teacher Characteristics 7
2.2 Student Peer Effects 9
2.2.1 Peer Achievement Effects 9
2.2.2 Peer Misbehavior Effects 13
3 Empirical Framework 16
3.1 Data 16
3.1.1 Overview 16
3.1.2 Limitations 22
3.2 Methodology 22
3.2.1 Construction of the Misbehavior Indices 23
4 Results 25
4.1 Teacher Characteristics 25
4.2 Student Peer Effects 28
4.2.1 Achievement Peer Effects 28
4.2.2 Misbehavior Peer Effects 29
5 Conclusion 31
References 33
6 Appendix 35
6.1 Teacher Characteristics 35
6.2 Peer Achievement 35
6.3 Peer Misbehavior (General) 35
6.4 Peer Misbehavior (Weekly) 35
1 i n t r o d u c t i o n
Economists have long been interested in classroom learning. From a hu-man capital standpoint, the education system in the United States presents itself as a target of change; the stark disparity in educational quality across the nation renders a significant proportion of our population an untapped resource of potential. If we were better able to understand how to establish an efficient teaching environment, there would be considerable benefits to society. The difficult question is, “What kinds of variables can improve edu-cational outcomes?”, and to that end much study has been devoted to topics such as peer achievement effects, teacher qualifications, teacher pay, and the like. However, an important variable that is rarely included in these kinds of analyses is misbehavior–a fairly intuitive predictor of any given classroom’s learning outcomes. This paper will explore the role of misbehavior using truly randomized data , applying it to previous research into peer effects and teacher characteristic analyses, as well as studying it on its own.
Researchers have attempted to tease out some compelling trends that can lead to better education policies, but it is difficult to do so with so many different datasets and limitations. There have been numerous studies which aim to clarify how the breakdown in ability of students in any given classroom can either benefit or harm under-achieving students. Other studies have tried to shed light on which variables on the teacher’s side can positively influence their students’ performance: salary, advanced degrees, race, and gender have all been analyzed, but there are typically only modest relationships if any. This paper focuses on student misbehavior in the classroom because–at least within the field of
economics–it has received less attention. This may be because data collection in the past has been more concerned with test scores, race dynamics, and gender; however, improved data on misbehavior in particular can potentially give incredible insight to the old saying that “one bad apple spoils the bunch”. By uncovering to what extent troublesome students’ disruptions in class affect their peers’ learning, we can consider investing into more efficient disciplinary practices and improve the classroom learning environment.
Although the initial model shows that there is some truth to the hypothesis that classes with higher concentrations of misbehavior do suffer from lower learning outcomes, much of this relationship can be explained by the omission of lagged peer performance as a variable. In subsequent models which account for that, the significance of misbehavior disappears while peer achievement is significant to the 1% level across the board. The negative trend observed
initially between misbehavior and student learning outcomes may very well have been influenced by underlying peer achievement effects.
2 l i t e r at u r e r e v i e w
This paper seeks to further understand the underlying mechanisms that in-fluence learning in the classroom, but with an emphasis on the role that misbehavior may play in peer effects. This section presents a brief overview of relevant studies regarding teacher characteristics, peer achievement effects, and the newer literature surrounding peer misbehavior effects.
2.1 Teacher Characteristics
There is already a sizeable body of work investigating a variety of key teacher characteristics: gender, education, age, experience, race, pay, etc., but most determinate studies exhibit modest results at best. One interesting study by Antecol, Eren, and Ozbeklik (2015) looks specifically into the effect on student
math scores from having a female versus male math teacher. The authors were motivated by the educational psychology literature which had previously cited that there were potential drawbacks to having female teachers in STEM fields. The study finds that there is evidence of a significant effect from the gender of a math teacher only for female students, which prompts discussion into gender stereotypes and cultural norms. The paper provides a plausible explanation for this phenomenon; perhaps it is female teachers with weaker backgrounds in mathematics who are driving this negative effect on their female students. To control for potential “math anxiety” of these less-prepared teachers, they classify teachers in their dataset as either having strong or weak math backgrounds based on their undergraduate majors (majors in math or math-related fields such as engineering or economics are sorted into the strong background group). The study finds that after accounting for this distinction, female math teachers with strong backgrounds are no less effective than their male counterparts. Despite potential data limitations, this study emphasizes the importance of teacher preparation in the subjects that they teach.
Additional studies in the literature investigate other measures of teacher preparedness in the form of coursework and college selectivity. Wayne and
Youngs (2003) conducted a meta-analysis regarding teacher characteristics,
and they find that there is some modest relationship between the rating of a teacher’s undergraduate institution and the performance of their students when looking at both the Gourman and Barron’s ratings. As for the benefit of having advanced degrees, the authors initially conclude that most studies are indeterminate. The key, however, is that by using newer data that clarifies whether advanced degrees are related to the taught subject, they find that there is a positive coefficient for relevant advanced degrees.
One final topic of debate in the teacher characteristics literature involves the credentialing process and consequently Teach for America. Darling-Hammond (2005) argues that teachers need to understand how children learn and how
to make material accessible for different students. The traditional way of achieving this important skill is to have a credentialing process that trains teachers and ensures that they are ready to perform in the classroom. Some oppose this point of view and believe that high general academic ability alone is enough to predict a teacher’s efficacy. In this study, teachers who went through a traditional credentialing process are compared to their Teach for America counterparts who receive relatively less preparation in this key area. The general takeaway is that students of teachers who are either uncertified or who went through non-standard certification procedures perform worse than those of traditional teachers. The study essentially refutes the hypothesis that TFA’s “bright college graduates” do not require additional professional preparation for teaching, and the paper presents a potential explanation for this result. Given that Teach for America corps members are only committed to
two year teaching stints, the majority of them exit the field within three years. There is generally a positive relationship between teaching efficacy and years of experience, and these corps members are dropping out before they are able to really get comfortable with teaching. Clearly we cannot only concern ourselves with the academic preparation of teachers, but we must consider the important skills that they gain on the job, such as the ability to lead a classroom and deal with misbehavior.
2.2 Student Peer Effects
2.2.1 Peer Achievement Effects
On the student side, many studies have attempted to confirm the existence of peer achievement effects, and it is accepted in the literature that this mechanism exists; however, consensus on a model for the underlying mechanism of peer achievement effects has not been reached. Peer achievement effects have been studied so extensively in the past because they point to potential policy changes that can influence school organization, the distribution of students of varying levels of achievement, and ultimately overall social welfare. In other words, if an efficient method for distributing peers can be determined, then policy changes can effectively increase student learning outcomes–an end result that should be enticing to administrators and researchers alike. The intuition behind peer achievement effects is that the innate ability of a higher-performing student can influence the learning of other students in the classroom through a variety of channels: a child who understands the material better may be able to teach
or mentor others who have a less than perfect grasp of the topic at hand, or perhaps a star student’s achievements cause her peers to think of her as a role model, motivating them to work harder in the classroom (Hoxby,2000).
Unfortunately, there are substantial obstacles that stand in the way of con-clusive relationships. A lack of randomization and the prevalence of selection bias is perhaps one of the most frustrating and persistent issues that inhibits a researcher’s ability to draw conclusions on peer effects. Hoxby lays out some examples of how data can be corrupted by selection bias. A family with a very capable child may choose to live near a school that has a program for gifted children, or parents may try to get their children into the class of a teacher that they know has a reputation for being more effective. In other words, Hoxby cautions that “one should assume that a child’s being in a school is associated with unobserved variables that affect his achievement. One should also assume that there are unobserved variables associated with a child’s being in a particular classroom, within his grade within his school.”
To combat this issue, Hoxby exploits idiosyncratic changes in gender and racial composition of student cohorts to mitigate the influence on results that selection bias usually has. Sacerdote (2001) also identifies selection bias as a
key issue in the estimation of peer effects. Using a novel dataset compiled by Dartmouth’s Office of Residential Life, the study is able to estimate the effect that the academic performance of a college freshman’s roommate has on the first student’s own academic record. Put simply, Sacerdote accounts for the prior academic record and grade point averages of both the student and roommate. Although this study does contribute significantly to the literature by
utilizing a semi-random dataset, it cannot be considered truly random because incoming students are asked a series of four yes/no questions in a housing survey:
1. I smoke.
2. I listen to music while studying.
3. I keep late hours.
4. I am more neat than messy.
Although it has been reduced by a significant degree, selection bias still plays a part in this study, and its effect is arguably more pronounced because it is done at the level of an elite university–it can be assumed that most of the freshmen at Dartmouth are very high-achieving prior to their acceptance to the school.
Both Hoxby (2000) and Sacerdote (2001) find modest positive relationships
between peer performance and own student performance. Hoxby’s results have interesting implications on race dynamics; the idiosyncratic reading achieve-ment of Asian students is positively and significantly correlated with the reading achievement of Black, Hispanic, and White students. The study also finds that the share of Hispanics in a cohort positively affects the scores of some Hispanic students–this cannot possibly be the result of an increase in mean peer achievement since an increasing share of Hispanic students actually decreases mean test scores. Sacerdote finds that a1 point increase in the GPA
of a freshman’s roommate increases that own student’s GPA by 0.11, though
On the other hand, many have also looked into the effect that students have on each other in the classroom, whether it be a positive effect from higher-achieving students motivating their less-prepared counterparts into scoring better, or a negative effect with lower-achieving students being left behind in a classroom of more successful peers. Antecol, Eren, and Ozbeklik (2013)
consider how different quantiles of students are affected by their peers, actually finding evidence for adverse peer effects that contradicts the literature. They cite the invidious comparison model and the frame of reference model to explain this peer effects relationship. The invidious model claims that higher ability peers negatively influence the outcomes of other students who are moved to a lower position in the local achievement distribution. The frame of reference model states that exposure to higher ability peers has a negative effect on other students because this lowers their academic self-concept.
However in this literature for peer effects, rarely is there any discussion of the importance of a given class’s level of misbehavior, and even if there is it is often with non-experimental data that leads to some limitations in interpretation. To my knowledge, there have been no papers that use data similar to mine which actually surveys teachers and requires them to report levels of specific kinds of misbehavior. With this unique dataset, I will be able to shed more light on a crucial aspect of classroom learning.
2.2.2 Peer Misbehavior Effects
Finally, administrators should not only concern themselves with the effect that students’ academic achievement has on their peers, but also how their behavior contributes to the overall learning environment. To this end, Carrell and Hoekstra (2010) address the common belief that there is a “bad apple”
peer effect wherein certain troublemakers in class are responsible for negatively impacting the learning of their classmates. According to this paper, 85%
of teachers and 73% of parents believe that the “school experience of most
students suffers at the expense of a few chronic offenders”, so evidence of this phenomenon would allow administrators to deal with the problematic students before their influence hinders the education of their peers.
In their paper on externalities in the classroom, Carrell and Hoekstra seek an explanatory variable for the propensity of students to misbehave in class, and their solution is quite clever. By working with the local courthouse, the researchers are able to identify which students have parents who filed domestic violence cases against each other. In other words, they can determine which students are likely to have behavioral issues by observing a key aspect of their home life.
It turns out that 4.6% of children in the sample are linked to a domestic
violence case filed by one of their parents. The peer effect of this “troubled” group of students with respect to academic achievement is found by regressing the reading and math composite score of students on the proportion of peers with family violence. The study also includes similar regressions for the number of disciplinary incidents in a given classroom. Even after the inclusion
of school-grade fixed effects, individual controls, and cohort controls, there is a significant negative relationship between the proportion of troubled students in the classroom and the reading and math composite score of their peers. In addition, classrooms with more troubled students experience a higher number of disciplinary incidents. A particularly compelling piece of evidence from the study compares siblings who are in different grade cohorts with differing proportions of troubled students. A sibling who is exposed to a greater number of troubled peers does significantly worse than one with fewer of those peers in the same cohort.
A few explanations of these trends are offered: one possibility is that the presence of troubled students who tend to misbehave more than their peers causes a greater number of disruptions which take away from class time and distract other students. Related to the peer achievement effects literature, a higher proportion of troubled students in the classroom indicates a lack of high-achieving students who may otherwise be able to positively benefit their peers and serve as mentors. Finally, the troubled students may learn more slowly than the rest of their cohort, thus forcing teachers to slow down their classes for fear of leaving them behind. All of this evidence seems to demonstrate that the “bad apple” peer effect is a very serious problem, but are there any flaws to the study?
There are definite limitations to the data used in this particular study, one of which is that self-selection of troubled students into the same schools as other disadvantaged children cannot really be accounted for. This flaw makes the case for the “bad apple” peer effect being exogenous to other explanatory variables
somewhat weaker. Another potential criticism is that analysis is carried out on a grade cohort level, rather than class-by-class, and the data is not experimental. However despite these limitations, the paper serves as a great starting point for additional insight into how the misbehavior of some students can affect the learning of others.
Moving from whether or not the “bad apple” peer effect exists to addressing how to solve the problem, Marvul (2012) offers one solution to troubled
stu-dents in the classroom. The paper pilots an experimental truancy intervention program that identifies a lack of student engagement as the main cause of truancy. The experimental group of students was called every morning before school, participated in an additional moral issues class, and was sponsored for club football and basketball teams. According to this study,
“a program that provides respect and support for its male students, guidance, a venue to discuss and evaluate the morality of various behaviors, and participation in competitive team sports can sig-nificantly reduce student absenteeism, anti-social and anti-school behaviors, and increase attitudes and commitment toward school and educational aspirations.”
Essentially, troubled students need to be shown that there are positive reasons for attending school and that they can expect the adults there to be caring and supportive. This paper presents convincing evidence that “bad apples” can be reformed through specially designed curricula. Programs like this one are of interest because they are potential solutions if peer misbehavior can be identified as a significant obstacle to classroom learning.
3 e m p i r i c a l f r a m e w o r k
3.1 Data
3.1.1 Overview
For the purposes of this analysis, there are some key variables that must be included. On the teacher side, race, sex, age, and certification status (TFA or non-TFA) are used. As for student variables, race and sex are also observed. Furthermore, a proxy for socioeconomic status (free lunch), and the dependent variable (performance on a national math exam) are key.
All of the above variables are standard in the literature, but analysis of misbehavior’s effect in the classroom necessitates some descriptors to convey the level of misbehavior in a classroom. In addition, most existing studies face selection bias, so experimental data that removes the worry surrounding non-random sorting of students would be preferred to make a stronger conclusion on resulting trends.
This paper is able to contribute a unique perspective to the literature because this particular dataset from Mathematica Policy Research fulfills all of the criteria stated above. Not only are the students who participated in the study randomly assigned to teachers and classrooms, but the dataset includes a survey of several types of misbehavior at the classroom level, which enables flexibility in running a whole suite of regressions testing for the effect of different types of misbehavior as well as that of a general misbehavior index.
This paper’s empirical approach relies heavily on the randomization of students to Teach for America versus non-TFA teachers. Although this paper does not intend to focus on the efficacy of Teach for America (as numerous other papers have already done), it exploits the TFA randomization to explore other key areas of interest. What this means is that we can eliminate any worry of students being non-randomly sorted into classrooms, allowing our analysis of peer effects, teacher characteristics, and misbehavior to be free from that bias which often cannot be accounted for in the literature. Of course, since the data is incredibly specific (all schools observed are from lower-income neighborhoods), it is important to note that any conclusions drawn from these analyses are not generalizable to the nation as a whole, but regardless they provide insight into educational outcomes for schools in which improvement is sorely needed. Some descriptive statistics are provided below:
3 e m p i r i c a l f r a m e w o r k 18 0 10 20 30 40 50 60 Percent of Students Black Hispanic
Other White (Non−Hispanic)
0 5 10 15 20 25 30 35 40 Percent of Teachers Black Hispanic
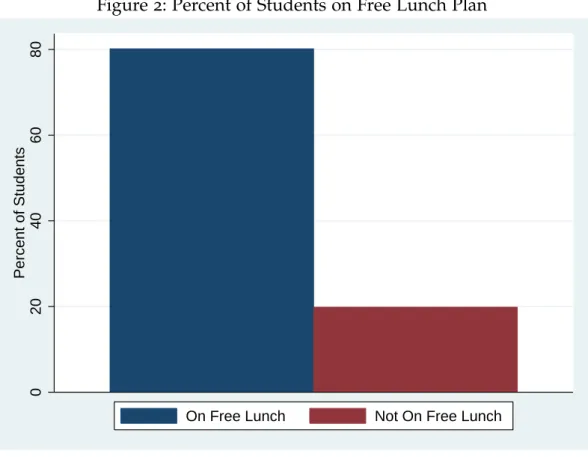
Figure2: Percent of Students on Free Lunch Plan 0 20 40 60 80 Percent of Students
On Free Lunch Not On Free Lunch
As is clear in the above figures, the schools we draw our sample fromdo not
have the typical characteristics of the average American public school; there is an overwhelming majority of Black and Hispanic students (more than90%
of the sample) as compared to Whites, and Asian or other racial identities are nearly non-existent. Demographics are intimately linked to the socioeconomic level of the surrounding neighborhood, and the proportion of students who are on a free or reduced lunch program confirms this. Again, this is not a nationally representative sample, but it allows conclusions about teaching in lower-income neighborhoods to be made.
Before moving on to methodology, I check the distributions of key variables within the data:
3 e m p i r i c a l f r a m e w o r k 20 0 .2 .4 .6 Density 1 2 3 4
Misbehavior Index (General)
0 .01 .02 .03 Density 0 50 100 150 200
Figure4: Distribution of Class Averages on Pre-test 0 .02 .04 .06 .08 Density 0 20 40 60 80
Class Average on Pretest
Since the students are randomly assigned to teachers in this dataset, there is a possibility that the class averages for pretest scores and misbehavior will be concentrated around some mean, leaving uniform data that is useless in analysis. However, Figure (4) above displays significant variation of test scores
across classes. Although most of the class averages fall within the 10th and 30th percentiles, there are some classes that have rather high concentrations
of better-performing students, leading to a reasonable distribution of scores. Variation in the class average allows for the measurement of differential peer achievement effects.
In Figure (3) I also observe some level of variation in both the general and
weekly misbehavior indices, though it should be noted that the weekly misbe-havior index is far more susceptible to outliers due to how the data is reported. The general misbehavior index has a restricted range of responses from 1to4,
3.1.2 Limitations
There are definite limitations to this dataset despite its randomization, particu-larly when it comes to the reporting of student race. There are very few White (non-Hispanic) students in this sample, so the coefficients of race variables will be biased.
As for misbehavior indicator variables, the validity of the absence and atten-dance variables is called into question. The sum of these two categories should be180 (the number of days in a school year), but many observations are wildly
inaccurate. For this reason, these two variables will be used sparingly in the analysis.
3.2 Methodology
Analysis in this paper will capitalize on the experimental nature of the data to show the effect of different levels of misbehavior in classrooms on student learn-ing outcomes. It will rely heavily on regression analysis, and most regressions will be some variation of the form
y= βtxt+βsxs+βcxc+e (1)
where xt represents teacher characteristics such as gender, race, credential status, an advanced degree dummy variable, years of experience, etc. xs is the individual student’s traits which may include gender, race, free lunch eligibility, days of absence, etc. The last set of independent variables, xc, represents class
characteristics, which can be average pretest scores or various misbehavior indices. The dependent variable in all regressions is the student’s percentile on a national mathematics examafter randomization. I ignore reading and writing test scores in this paper.
This dataset includes an extensive survey on teacher characteristicsand class-room behavior in the form of disruptions, absenteeism, incidence of students being sent out of the classroom, etc., which allows for the construction of “mis-behavior indices” that will serve as independent variables in regression analysis, and this process will be detailed in the following section. The randomized blocks in addition to the comprehensive data allow for most intuitive factors to be controlled for when running regressions with this experimental data.
3.2.1 Construction of the Misbehavior Indices
The survey sent out to teachers with regard to misbehavior in the classroom was split into two sections: a general 1-4rating of specific incidents (from “Not
at all a problem” to “Serious problem”) and a count of how many specific incidents occurred in the most recent full week of teaching. Accordingly the misbehavior indices are also divided into the general and weekly sections.
The general misbehavior index covers the following:
1. Student tardiness
2. Student absenteeism/class cutting
3. Physical conflicts among students
5. General misbehavior (e.g., students talking in class, refusal to follow
classroom rules)
Each of these can be rated from 1-4, and the General Misbehavior Index is the
average of the five categories of misbehavior.
As for the Weekly Misbehavior Index, teachers were asked to report a count of the following incidents:
1. How many students in your class were tardy, or had an unexcused absence
from school?
2. How many times did you have to interrupt your class to deal with student
misbehavior or disruption?
3. How many times did you have to send a child out of the classroom (i.e.,
to the principal’s or guidance counselor’s office) because of misbehavior or disruption?
The Weekly Misbehavior Index is simply the sum of the reported counts in the previous three questions.
An additional factor to be wary of within this dataset is the objectivity of the measures of student behavior. As with any self-reporting survey, the reliability of the numbers is somewhat called into question. Some variables like the number of students sent out of the classroom present obstacles to interpretation because of the nature of the measure; even if these instances are reliably recorded, the variable is inextricably tied to the particular teacher doling out the punishments. In other words, we have a reporting issue that stems from different teachers having different tolerances for misbehaving students,
and we observe significant variation across teachers for reported misbehavior. One possibility is that younger, less experienced teachers are less accustomed to disciplining misbehaving students, so they send more students out of the classroom than their more experienced peers.
4 r e s u lt s
This analysis will first attempt to replicate the results from the existing literature on teacher characteristics and peer effects then discern the implications that classroom misbehavior may have on them.
This paper will rely on regression analysis to verify that teacher characteristics as well as peer achievement effects are important predictors of the individual student’s learning outcomes. Since peer effects in the classroom have already been studied extensively, the purpose of this paper is to augment past research by adding in different measures of misbehavior into regressions of learning outcomes. By including peer misbehavior as a variable, it may be possible to further understand the mechanisms that drive observed peer achievement effects.
4.1 Teacher Characteristics
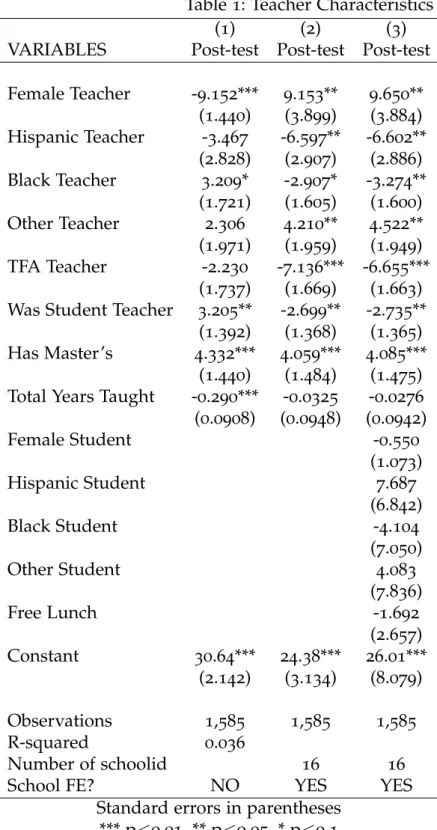
Table (1) regresses student learning outcomes on a set of teacher characteristics
(race, TFA status, advanced degree, and years of experience) and also includes controls for student characteristics and school fixed effects. With this table,
we try to understand how certain aspects of teachers can benefit or harm the performance of their students. Consistent with Antecol, Eren, and Ozbeklik (2013), I initially observe a negative effect on the test scores of students whose
math teacher is female. However, when adding in school fixed effects in specification 2, this coefficient switches signs to be significant and positive,
implying that students with female math teachers have test scores 9percentiles
higher on average than their peers with male math teachers. This curious effect may be due to uneven distribution of female teachers across schools. In other words, female teachers are more highly concentrated in lower-performing schools, butwithin the same school, female math teachers outperform males. This relationship is fairly robust; even after the inclusion of student characteristics in specification3, the coefficient on the Female Teacher variable remains largely
unchanged.
Although due to data restrictions we are unable to comment on the theory that more coursework related to the subject taught by the teacher increases student performance, data on the highest degree achieved by teachers does lead to some interesting discussion. Across all three specifications, a teacher possessing a Master’s degree is associated with approximately a 4point gain
in math test percentile for students. I do not control for whether or not the advanced degree is in a field related to the teacher’s subject as in Wayne and Youngs (2003), but it is still possible to offer some explanation. This relationship
may very well be due to additional training in pedagogical techniques, better handling of misbehavior or disruptions in the classroom, or greater familiarity with taught subjects. Regardless of the exact influence on test scores, the
experience of a teacher plays a very important role in the learning outcomes of these students.
A variable that is very closely related to the topic of teacher experience is “TFA Teacher”, which is a binary variable indicating whether or not a teacher is a Teach for America corps member. There is a vast literature surrounding the influence of TFA corps members, with many of the studies showing no effect or a very slight effect from these teachers on their students. Comparable to Darling-Hammond (2005), the coefficient on TFA Teacher is negative in all three
specifications of Table (1). One potential caveat is that TFA corps members are
exclusively assigned to lower-income and lower-performing school districts, but most of the schools in this dataset fit that profile. Consequently, even after controlling for school fixed effects, students of TFA teachers have math test percentiles 6points lower than that of their peers. As explained previously in
the literature, a teacher’s experience (or lack thereof in this case) can have a large impact on the learning outcomes of their students. The observed effect seems reasonable in light of the short two-year commitment that these teachers are held to; despite being smart students coming from elite universities, corps members fail to reap the benefit of greater teaching efficacy that comes from more experience in the classroom.
4.2 Student Peer Effects
4.2.1 Achievement Peer Effects
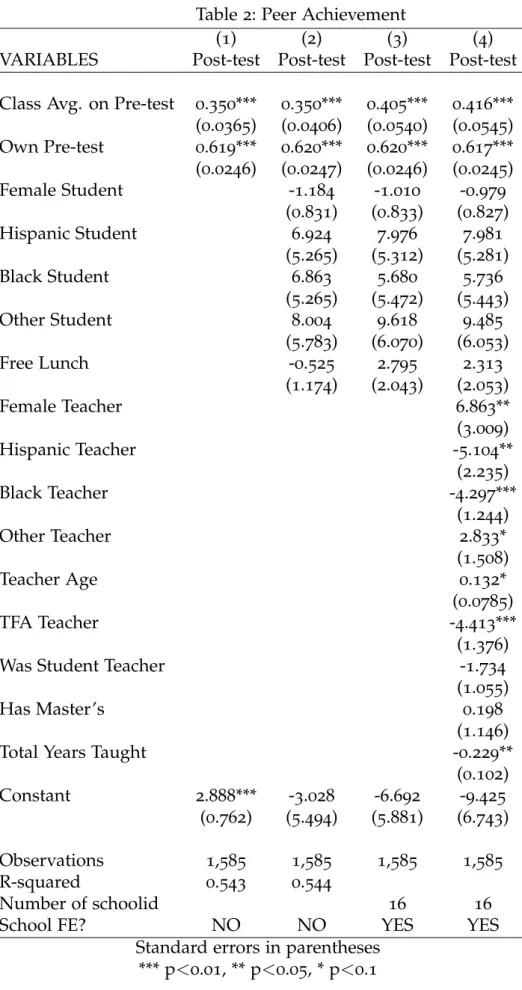
The literature points to evidence of both positive and negative peer achievement effects. The purpose of this section is to establish some baseline level of peer achievement effects on own student performance before even considering classroom misbehavior as a variable. Table (2) maintains all the same control
variables as in the previous one, but it now considers both the class average on the pre-test as well as the individual student’s own performance on the pre-test. In specification1, we find that both of these key variables are highly significant
and have positive coefficients, which is intuitive because a student’s prior performance on an exam should be an accurate predictor of future performance. Even when adding in teacher characteristics in specification 2 and student
characteristics with fixed effects in specification4, the coefficient on “Class Avg.
on Pre-test” remains large and very significant, as does the coefficient on “Own Pre-test”. Neither of these results is surprising, but of course we should not only be interested in the performance of peers in the classroom, but also in the potential disruptive qualities that students may possess and how they can impact others. The following section will include measures of misbehavior to estimate this important secondary effect.
4.2.2 Misbehavior Peer Effects
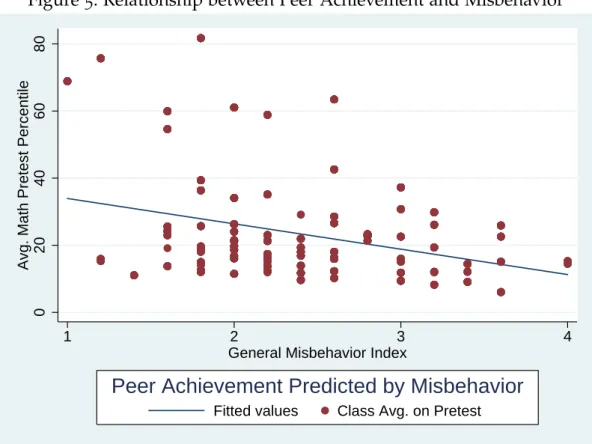
This section is devoted to determining peer misbehavior’s role in overall peer effects, which is motivated by potential school organization reforms and policy changes that can increase educational outcomes in similar schools if a conclusive peer misbehavior effect can be identified. The relationship between general misbehavior and class average performance on the math exam is illustrated in the following figure:
Figure5: Relationship between Peer Achievement and Misbehavior
0
20
40
60
80
Avg. Math Pretest Percentile
1 2 3 4
General Misbehavior Index
Fitted values Class Avg. on Pretest
Peer Achievement Predicted by Misbehavior
There is a clear negative relationship between the misbehavior index and the performance of the class on average in the last year, which follows the prediction that a classroom with higher-achieving students on average will have fewer discipline problems; however, the direction of causality is unclear. Do
higher achieving students tend to just be better behaved, or can we say that improving discipline in class will result in visibly better academic performance? Table (3) presents regression specifications that include the general
misbehav-ior index, a student’s prmisbehav-ior math exam performance, and the standard teacher and student control variables. It shows consistently negative coefficients on the “General Misbehavior Index”, which is to be expected. However, it must be emphasized once again that we can only conclude that there is a negative relationship between the level of misbehavior in a classroom and the learning outcomes of its students.
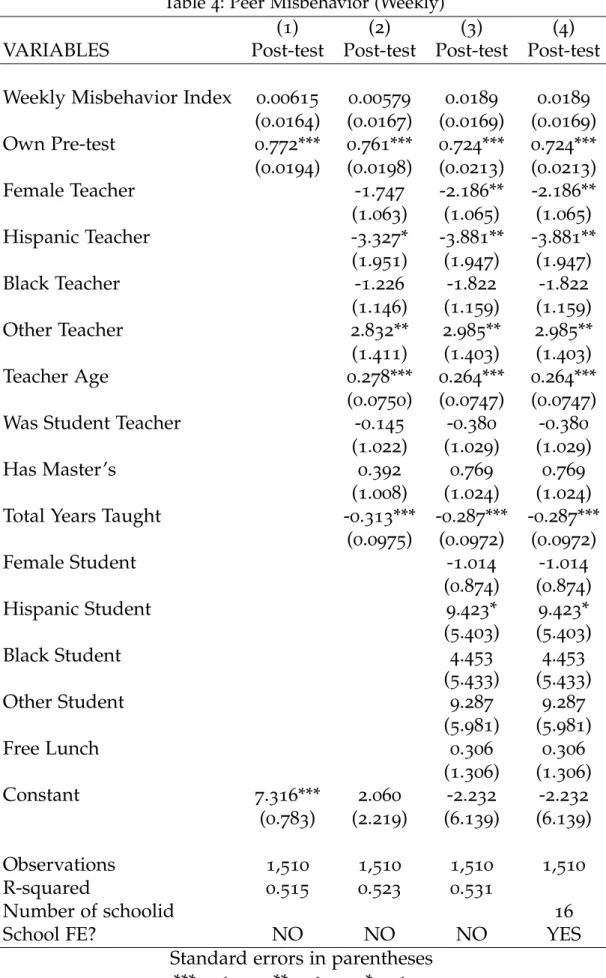
I use a second measure of classroom misbehavior in Table (4) as a check
and find that the relationship is not as clear with the weekly data. It seems that the weekly misbehavior index is a poor estimator of learning outcomes– the coefficient across all four specifications is small and insignificant. There may simply be too much noise in the weekly index distribution that limits its usefulness as a measure. For the rest of this analysis, I use the general version of the misbehavior index to gauge the level of classroom misbehavior.
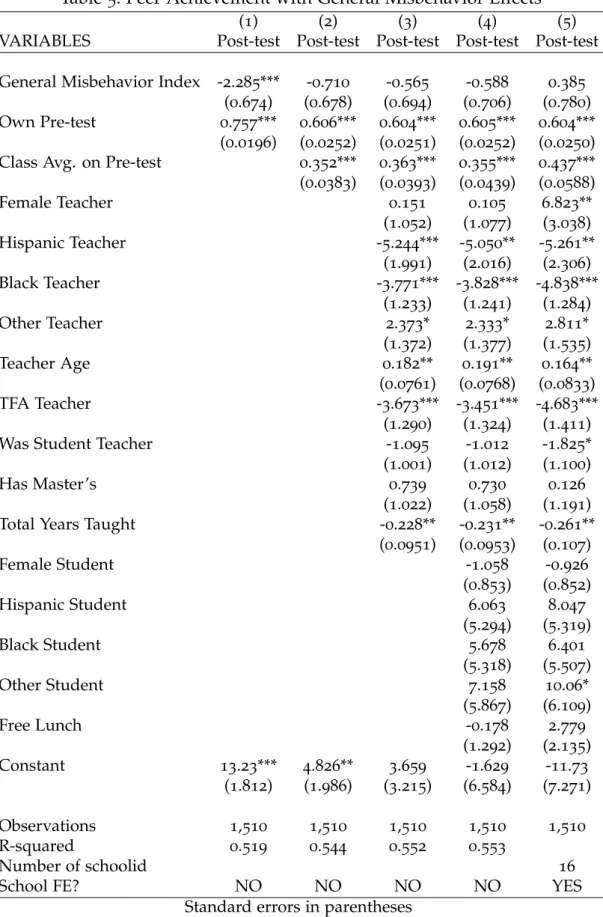
Finally, I am able to clarify the relationship between misbehavior and overall peer effects in Table (5). In addition to the standard teacher and student control
variables, it includes the general misbehavior index, the student’s own pre-test score,andthe class average on the pre-test. Specification1shows the coefficient
on the misbehavior index as significant and negative, which is again expected. Transitioning to specification 2, however, yields an important insight. The
introduction of the class average performance in the model absorbs away much of the effect from the misbehavior index. In the following specifications, the
coefficient on the class average remains positive and highly significant, while the coefficient on misbehavior loses its significance and size.
The initial hypothesis regarding the mechanism of peer effects was that the level of misbehavior in a classroom could be explaining some of the perceived influence of peer achievement on learning outcomes. Following the insight from Table (5) wherein the significance of general misbehavior disappears
in the presence average peer performance, we can reasonably conclude that misbehavior is in fact not a driver of peer effects in the classroom.
5 c o n c l u s i o n
This paper reviewed the existing literature regarding influences on student learning outcomes, dedicating a large part of its focus to the role of peer misbehavior. By using a well-executed randomized dataset, sorting issues that typically prevent causal statements from being made are avoided. Although in Table (3) the coefficient on the misbehavior index is negative and significant,
this relationship with individual student test percentile mostly disappears when average class performance is included in Table (5). These findings from an
experimental design are fairly compelling; they imply that–contrary to the original hypothesis–the level of misbehavior in a classroom is not really a significant contributor to peer effects observed in the literature.
Although the dataset is unique and allows for greater confidence that any notable trends are really due to causal effects and not non-random sorting, it is not without some shortcomings. The misbehavior indicators included in the
survey are reported by teachers and tend to be highly subjective. The resulting conclusion made about peer misbehavior’s role in the classroom may have been skewed by this imperfect reporting. At this point, it seems that the level of misbehavior in the classroom is more a symptom of peer quality and academic performance rather than a variable that has influence over individual student learning outcomes. Future analysis into this important topic would benefit greatly from improved datasets that maintain randomization of students into classroom while adding more reliable measures of student misbehavior on an individual and per-class basis.
r e f e r e n c e s
Antecol, H., O. Eren, and S. Ozbeklik (2013). Peer Effects in Disadvantaged
Primary Schools : Evidence from a Randomized Experiment. Mimeo(7694).
Antecol, H., E. Ozkan, and O. Serkan (2015). The Effect of Teacher Gender
on Student Achievement in Primary School: Evidence from a Randomized Experiment. Journal of Labor Economics33(6453), 38.
Boozer, M. A. and S. E. Cacciola (2001). Inside the ’Black Box’ of Project
Star: Estimation of Peer Effects using Experimental Data. Center Discussion Paper(832).
Carrell, S., R. Fullerton, and J. West (2009). Does Your Cohort Matter? Measuring
Peer Effects in College Achievement. Journal of Labor Economics27(3),439–464.
Carrell, S. E. and M. L. Hoekstra (2008). Externalities in the Classroom: How
Children Exposed to Domestic Violence Affect Everyone’s Kids. NBER Work-ing Paper No.14246. 2(1), 1.
Darling-Hammond, L. (2000). Teacher quality and student achievement: A
review of state policy evidence. Education Policy Analysis Archives8(1),1–44.
Darling-Hammond, L., D. J. Holtzman, S. J. Gatlin, and J. V. Heilig (2005). Does
teacher preparation matter? Evidence about teacher certification, teach for America, and teacher effectiveness. Education Policy Analysis Archives13. Epple, D. and R. E. Romano (2011). of the Theory and Evidence, Volume1.
Hoxby, C. (2000). Peer Effects in the Classroom: Learning from Gender and
Race Variation. NBER Working Paper Series No.7867, 64.
J.Wayne, A. and P. Youngs (2003). Teacher Characteristics and Students
Achieve-ment Gains. American Educational Research Association73(1), 89–122.
Marvul, J. N. (2012). If You Build It, They Will Come: A Successful Truancy
Intervention Program in a Small High School. Urban Education47(1),144–169.
Richmond, R. (2002). Oxford University Press. 33(6),524–536.
Sacerdote, B. (2001). Peer effects with random ssignment: Results for Dartmouth
6 a p p e n d i x
6.1 Teacher Characteristics
6.2 Peer Achievement
6.3 Peer Misbehavior (General)
6.4 Peer Misbehavior (Weekly)
Table1: Teacher Characteristics
(1) (2) (3)
VARIABLES Post-test Post-test Post-test Female Teacher -9.152*** 9.153** 9.650** (1.440) (3.899) (3.884) Hispanic Teacher -3.467 -6.597** -6.602** (2.828) (2.907) (2.886) Black Teacher 3.209* -2.907* -3.274** (1.721) (1.605) (1.600) Other Teacher 2.306 4.210** 4.522** (1.971) (1.959) (1.949) TFA Teacher -2.230 -7.136*** -6.655*** (1.737) (1.669) (1.663)
Was Student Teacher 3.205** -2.699** -2.735**
(1.392) (1.368) (1.365)
Has Master’s 4.332*** 4.059*** 4.085***
(1.440) (1.484) (1.475)
Total Years Taught -0.290*** -0.0325 -0.0276
(0.0908) (0.0948) (0.0942) Female Student -0.550 (1.073) Hispanic Student 7.687 (6.842) Black Student -4.104 (7.050) Other Student 4.083 (7.836) Free Lunch -1.692 (2.657) Constant 30.64*** 24.38*** 26.01*** (2.142) (3.134) (8.079) Observations 1,585 1,585 1,585 R-squared 0.036 Number of schoolid 16 16
School FE? NO YES YES
Standard errors in parentheses *** p<0.01, ** p<0.05, * p<0.1
Table2: Peer Achievement
(1) (2) (3) (4)
VARIABLES Post-test Post-test Post-test Post-test Class Avg. on Pre-test 0.350*** 0.350*** 0.405*** 0.416***
(0.0365) (0.0406) (0.0540) (0.0545) Own Pre-test 0.619*** 0.620*** 0.620*** 0.617*** (0.0246) (0.0247) (0.0246) (0.0245) Female Student -1.184 -1.010 -0.979 (0.831) (0.833) (0.827) Hispanic Student 6.924 7.976 7.981 (5.265) (5.312) (5.281) Black Student 6.863 5.680 5.736 (5.265) (5.472) (5.443) Other Student 8.004 9.618 9.485 (5.783) (6.070) (6.053) Free Lunch -0.525 2.795 2.313 (1.174) (2.043) (2.053) Female Teacher 6.863** (3.009) Hispanic Teacher -5.104** (2.235) Black Teacher -4.297*** (1.244) Other Teacher 2.833* (1.508) Teacher Age 0.132* (0.0785) TFA Teacher -4.413*** (1.376)
Was Student Teacher -1.734
(1.055)
Has Master’s 0.198
(1.146)
Total Years Taught -0.229**
(0.102) Constant 2.888*** -3.028 -6.692 -9.425 (0.762) (5.494) (5.881) (6.743) Observations 1,585 1,585 1,585 1,585 R-squared 0.543 0.544 Number of schoolid 16 16
School FE? NO NO YES YES
Standard errors in parentheses *** p<0.01, ** p<0.05, * p<0.1
Table3: Peer Misbehavior (General)
(
1
)
(
2
)
(
3
)
(
4
)
VARIABLES
Post-test
Post-test
Post-test
Post-test
General Misbehavior Index
-
2
.
285
***
-
2
.
157
***
-
1
.
602
**
-
0
.
632
(
0
.
674
)
(
0
.
691
)
(
0
.
710
)
(
0
.
782
)
Own Pre-test
0
.
757
***
0
.
750
***
0
.
718
***
0
.
682
***
(
0
.
0196
)
(
0
.
0200
)
(
0
.
0214
)
(
0
.
0232
)
Female Teacher
-
1
.
555
-
1
.
999
*
7
.
276
**
(
1
.
065
)
(
1
.
067
)
(
3
.
093
)
Hispanic Teacher
-
4
.
580
**
-
5
.
143
**
-
5
.
513
**
(
2
.
045
)
(
2
.
059
)
(
2
.
348
)
Black Teacher
-
2
.
274
*
-
2
.
980
**
-
4
.
194
***
(
1
.
256
)
(
1
.
263
)
(
1
.
304
)
Other Teacher
2
.
388
*
2
.
616
*
3
.
507
**
(
1
.
410
)
(
1
.
406
)
(
1
.
560
)
Teacher Age
0
.
240
***
0
.
221
***
0
.
136
(
0
.
0780
)
(
0
.
0783
)
(
0
.
0847
)
TFA Teacher
-
2
.
348
*
-
2
.
715
**
-
4
.
582
***
(
1
.
317
)
(
1
.
349
)
(
1
.
437
)
Was Student Teacher
-
0
.
614
-
0
.
724
-
2
.
398
**
(
1
.
028
)
(
1
.
033
)
(
1
.
118
)
Has Master’s
0
.
753
1
.
348
1
.
026
(
1
.
051
)
(
1
.
078
)
(
1
.
206
)
Total Years Taught
-
0
.
327
***
-
0
.
304
***
-
0
.
206
*
(
0
.
0971
)
(
0
.
0969
)
(
0
.
109
)
Female Student
-
0
.
974
-
0
.
943
(
0
.
872
)
(
0
.
868
)
Hispanic
8
.
335
10
.
14
*
(
5
.
400
)
(
5
.
408
)
Black
3
.
870
6
.
619
(
5
.
427
)
(
5
.
607
)
Other
8
.
561
12
.
08
*
(
5
.
990
)
(
6
.
214
)
Free Lunch
0
.
444
2
.
256
(
1
.
317
)
(
2
.
173
)
Constant
13
.
23
***
10
.
76
***
6
.
194
-
1
.
427
(
1
.
812
)
(
3
.
208
)
(
6
.
651
)
(
7
.
267
)
Observations
1
,
510
1
,
510
1
,
510
1
,
510
R-squared
0
.
519
0
.
527
0
.
534
Number of schoolid
16
School FE?
NO
NO
NO
YES
Standard errors in parentheses
*** p
<
0
.
01
, ** p
<
0
.
05
, * p
<
0
.
1
Table4: Peer Misbehavior (Weekly)
(
1
)
(
2
)
(
3
)
(
4
)
VARIABLES
Post-test
Post-test
Post-test
Post-test
Weekly Misbehavior Index
0
.
00615
0
.
00579
0
.
0189
0
.
0189
(
0
.
0164
)
(
0
.
0167
)
(
0
.
0169
)
(
0
.
0169
)
Own Pre-test
0
.
772
***
0
.
761
***
0
.
724
***
0
.
724
***
(
0
.
0194
)
(
0
.
0198
)
(
0
.
0213
)
(
0
.
0213
)
Female Teacher
-
1
.
747
-
2
.
186
**
-
2
.
186
**
(
1
.
063
)
(
1
.
065
)
(
1
.
065
)
Hispanic Teacher
-
3
.
327
*
-
3
.
881
**
-
3
.
881
**
(
1
.
951
)
(
1
.
947
)
(
1
.
947
)
Black Teacher
-
1
.
226
-
1
.
822
-
1
.
822
(
1
.
146
)
(
1
.
159
)
(
1
.
159
)
Other Teacher
2
.
832
**
2
.
985
**
2
.
985
**
(
1
.
411
)
(
1
.
403
)
(
1
.
403
)
Teacher Age
0
.
278
***
0
.
264
***
0
.
264
***
(
0
.
0750
)
(
0
.
0747
)
(
0
.
0747
)
Was Student Teacher
-
0
.
145
-
0
.
380
-
0
.
380
(
1
.
022
)
(
1
.
029
)
(
1
.
029
)
Has Master’s
0
.
392
0
.
769
0
.
769
(
1
.
008
)
(
1
.
024
)
(
1
.
024
)
Total Years Taught
-
0
.
313
***
-
0
.
287
***
-
0
.
287
***
(
0
.
0975
)
(
0
.
0972
)
(
0
.
0972
)
Female Student
-
1
.
014
-
1
.
014
(
0
.
874
)
(
0
.
874
)
Hispanic Student
9
.
423
*
9
.
423
*
(
5
.
403
)
(
5
.
403
)
Black Student
4
.
453
4
.
453
(
5
.
433
)
(
5
.
433
)
Other Student
9
.
287
9
.
287
(
5
.
981
)
(
5
.
981
)
Free Lunch
0
.
306
0
.
306
(
1
.
306
)
(
1
.
306
)
Constant
7
.
316
***
2
.
060
-
2
.
232
-
2
.
232
(
0
.
783
)
(
2
.
219
)
(
6
.
139
)
(
6
.
139
)
Observations
1
,
510
1
,
510
1
,
510
1
,
510
R-squared
0
.
515
0
.
523
0
.
531
Number of schoolid
16
School FE?
NO
NO
NO
YES
Standard errors in parentheses
*** p
<
0
.
01
, ** p
<
0
.
05
, * p
<
0
.
1
Table5: Peer Achievement with General Misbehavior Effects
(1) (2) (3) (4) (5)
VARIABLES Post-test Post-test Post-test Post-test Post-test General Misbehavior Index -2.285*** -0.710 -0.565 -0.588 0.385
(0.674) (0.678) (0.694) (0.706) (0.780)
Own Pre-test 0.757*** 0.606*** 0.604*** 0.605*** 0.604***
(0.0196) (0.0252) (0.0251) (0.0252) (0.0250)
Class Avg. on Pre-test 0.352*** 0.363*** 0.355*** 0.437***
(0.0383) (0.0393) (0.0439) (0.0588) Female Teacher 0.151 0.105 6.823** (1.052) (1.077) (3.038) Hispanic Teacher -5.244*** -5.050** -5.261** (1.991) (2.016) (2.306) Black Teacher -3.771*** -3.828*** -4.838*** (1.233) (1.241) (1.284) Other Teacher 2.373* 2.333* 2.811* (1.372) (1.377) (1.535) Teacher Age 0.182** 0.191** 0.164** (0.0761) (0.0768) (0.0833) TFA Teacher -3.673*** -3.451*** -4.683*** (1.290) (1.324) (1.411)
Was Student Teacher -1.095 -1.012 -1.825*
(1.001) (1.012) (1.100)
Has Master’s 0.739 0.730 0.126
(1.022) (1.058) (1.191)
Total Years Taught -0.228** -0.231** -0.261**
(0.0951) (0.0953) (0.107) Female Student -1.058 -0.926 (0.853) (0.852) Hispanic Student 6.063 8.047 (5.294) (5.319) Black Student 5.678 6.401 (5.318) (5.507) Other Student 7.158 10.06* (5.867) (6.109) Free Lunch -0.178 2.779 (1.292) (2.135) Constant 13.23*** 4.826** 3.659 -1.629 -11.73 (1.812) (1.986) (3.215) (6.584) (7.271) Observations 1,510 1,510 1,510 1,510 1,510 R-squared 0.519 0.544 0.552 0.553 Number of schoolid 16
School FE? NO NO NO NO YES
Standard errors in parentheses *** p<0.01, ** p<0.05, * p<0.1