NEW ENVIRONMENTALLY FRIENDLY METHOD FOR
QUANTIFICATION OF CEFAZOLIN SODIUM
Bárbara Saú Rechelo,
[a]Felipe Hugo Alencar Fernandes,
[a]Ana Carolina
Kogawa
[a]*and Hérida Regina Nunes Salgado
[a]Keywords: Cefazolin sodium; quality control; visible spectrophotometry; green technique; eco-friendly method
Cefazolin sodium, a β-lactam antimicrobial agent belonging to the first generation cephalosporins, has a broad spectrum of action, acting against gram positive and gram negative bacteria. Stands out over other cephalosporins for its ability to also act against some species of Enterobacter, and have a long half-life, thus reducing the frequency of administrations. A simple, fast and reproducible method by visible spectrophotometry was developed and validated for quantification of cefazolin sodium in the lyophilized powder. This technique is widely used in the pharmaceutical industry due to its ease of execution, low cost, safety and high precision and accuracy. It has been employed in the quality control routine of numerous pharmaceuticals in order to identify them and quantify their active principles. The method was capable of detecting and quantifying the cefazolin sodium obtaining satisfactory results regarding selectivity, precision, accuracy and robustness, on linear range of 32.0 to 92.0 µg mL-1, showing the correlation coefficient of 0.9993 when analyzed at 767 nm. Due to the
environmental impacts caused by global economic development, green chemistry has come up with a proposal to minimize and/or eliminate the use of harmful solvents, which generate large amounts of toxic waste to the environment and the health of operators, as well as reducing expenses with costly processes. The proposed method does not use toxic solvent, proving to be effective, low cost, easy to apply and safe for the analyst and environment.
*Corresponding Authors Fax: +55 16 3301 6967
E-Mail: [email protected]
[a] 1Department of Pharmaceutics, School of Pharmaceutical
Sciences of Araraquara, Univ Estadual Paulista - UNESP, Araraquara, São Paulo, Brazil
Introduction
Cefazolin sodium (CFZ, Figure 1) is a β-lactam antimicrobial agent, belonging to the first generation of cephalosporins. It stands out because CFZ has activity against some species of Enterobacter and can be administered less frequently because of its longer half-life.1-5
Its mechanism of action results from the inhibition of cell wall synthesis in Gram-negative and Gram-positive bacteria, preventing transpeptidases enzymes to form cross-links peptidoglycan in the bacterial cell wall.6-9
Figure 1. Chemical structure of cefazolin sodium (CAS 27164-46-1).
Considering the great importance of cefazolin sodium on the global scene in the treatment of infectious diseases, the development of practical, economical and reliable analytical methods, which can be used in the quality control of this drug, is essential and highly relevant, seeking the
therapeutic efficacy, patient’s safety and also benefits for the pharmaceutical industries and compounding pharmacies.10
Cefazolin sodium has some analytical methods described in official compendia such as British,11 European,12
Japanese,13 Portuguese14 and US15 pharmacopeias. In the
literature, several methods have been described for the qualitative16 and quantitative analysis of cefazolin sodium,
included spectrophotometry,17-29 high-performance liquid
chromatography30-47 and voltammetry.48 However, most of
them were time-consuming and dedicated to sophisticated and expensive analytical instruments.
The methods found in the literature for the identification and quantification of sodium cefazolin use mostly mobile phases consisting of buffer solutions and solvents such as acetonitrile and trifluoroacetic acid, which, according to the concepts of green chemistry, are extremely aggressive to the environment.49
The validation process is essential to set up a developed methodology is completely appropriate to the objectives which it is intended in order to obtain reliable results that can be satisfactorily interpreted. It involves the development of an analytical method, adaptation or implementation of a known method and an evaluation process to estimate its efficiency.50
Experimentals
Material
Cefazolin sodium reference substance was a standard with a declared purity of 98.2 %, obtained from Sigma-Aldrich™. The samples were lyophilized powders in vials containing 1g, kindly supplied from ABL™.
Chemicals
Sodium carbonate was obtained from Synth™ and Folin-Ciocalteau reagent was obtained from Sigma-Aldrich™. Purified water was used to prepare all solutions. Was weighed 5.0g of sodium carbonate and transferred to 25 mL flask with water. It took to ultrasound for 30 minutes to complete solubilization and was completed the volume with purified water, yielding reagent with 5.0 % of final concentration.
Equipment
The method was performed in spectrophotometer UV-Vis Shimadzu, model UV 1800, using quartz cuvettes 1 cm optical path, under controlled temperature 25° C.
Ringbom’s Curve
For the development of the visible spectrophotometric method, Ringbom’s curve was constructed in order to establish the concentrations of work to which the drug has linearity. Aliquots of the standard stock solution of 200.0 µg mL-1 were transferred using a micropipette to 10 mL
volumetric flasks, and the volume was completed with purified water, in addiction to sodium carbonate buffer and Folin-Ciocalteau reagent to obtain increasing concentrations 2.0-182.0 μg mL-1.
Analytical Curve
For the development of the visible spectrophotometric method, the calibration curve was constructed to determine the range in which the drug has an increased linearity. Aliquots of stock solutions corresponding to 1.6, 2.2, 2.8, 3.4, 4.0 and 4.6 mL to 10.0 mL volumetric flasks. Were added to each volumetric flask aliquots of 300 µL of sodium carbonate buffer solution 5 % and 100 μL of Folin-Ciocalteau reagent. The volume was completed with purified water, for obtaining solutions with concentrations of 32.0, 44.0, 56.0, 68.0, 80.0 and 92.0 μg mL-1,
respectively.
Purified water, sodium carbonate buffer and Folin-Ciocalteau reagent were used as blank to reset the appliance.
Analytical Method Validation
On validation of analytical methods, as well in this research, the determined parameters was selectivity, linearity, precision, accuracy, robustness, limit of detection (LD) and limit of quantification (LQ).50-55
Linearity
The linearity of the method was obtained through the analysis of three analytical curves on three different days. The results obtained were analyzed to obtain the equation of the line by the least-squares method, and verification of the linearity was detected by Analysis of Variance (ANOVA).
Limits of detection (LD) and quantification (LQ)
The limit of detection (LD) and limit of quantification (LQ) were calculated by standard deviation of the intercept and the slope of the analytical curve. The equations are:
(1)
(2)
Precision
The precision of the method was performed for repeatability and intermediate precision, which were evaluated by relative standard deviation (RSD).
Repeatability
The repeatability was determined by analysis of six solutions of cefazolin sodium at a concentration of 56.0 μg mL-1 prepared on the same day. Thus, results were obtained
using the same experimental conditions.
Intermediate precision
The intermediate precision was evaluated through analysis of six solutions of cefazolin sodium at a concentration of 56.0 μg mL-1 were prepared and executed by different
analysts in different days under the same experimental conditions.
Selectivity
Three scans on spectrophotometer were performed for the study of selectivity of the proposed method, both between 380-780 nm: the first scan was made with a standard solution of cefazolin sodium at 56.0 µg mL-1, the second
scan was made with a solution of cefazolin sodium in lyophilized powder at same concentration, and the thirst was made with a solution containing only the chosen solvent (purified water, sodium carbonate buffer and Folin-Ciocalteau reagent).
Accuracy
The solutions were prepared according to Table 1.
3.3
LD
IC
10
LQ
IC
Table 1. Preparation of test solutions for accuracy parameter of the visible spectrophotometric method at 767 nm.
Volume (mL) of CFZ solution (200.0 µg mL-1)
Theoretical concentration (µg mL-1)*
sample standard
Sample 1.6 - 32.0
R1 1.6 0.6 44.0
R2 1.6 1.2 56.0
R3 1.6 1.8 68.0
Standard - 1.6 32.0
* 10 mL volumetric flask
Robustness
The robustness of the method was determined by comparing the contents obtained by varying the wavelength and evaluated by the test F and Student's t test.
Determination of cefazolin sodium content in lyophilized powder
Solutions of 56.0 µg mL-1CFZ were prepared in triplicate,
on three different days and analyzed by spectrophotometer at 767 nm.The content of cefazolin sodium was calculated, according to Equation 3.
(3)
where
CS = concentration of the sample
AS = absorbance of the sample
CRS = concentration of the reference substance
ARS = absorbance of the reference substance
Results
Cefazolin sodium reacts with Folin-Ciocalteau reagent to form a blue solution at 767 nm.
Ringbom’s Curve
The absorbance of concentrations between 2.0 to 182.0 µg mL-1 was converted to transmittance. These data were
plotted on a graph of transmittance versus log concentration of cefazolin sodium reference substance as shown in Figure 2.
Analytical methods validation
The choice of cefazolin sodium study conducting in concentration of 56.0 µg mL-1 to assays of precision
(repeatability and intermediate precision), selectivity and determination of the content is justified as being the midpoint of the working range established by Ringbom’s curve.
Figure 2. Ringbom's curve obtained by visible spectrophotometric method to cefazolin sodium standard.
Linearity
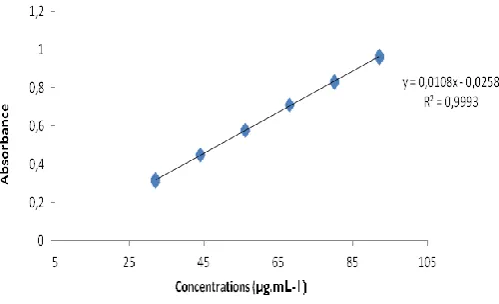
The analytical curve of cefazolin sodium was built with the average of the absorbance values of three analytical curves with concentrations from 32.0 to 92.0 µg mL-1,
obtained during the linearity test. Figure 3 shows the corresponding analytical curve.
Figure 3. Analytical curve of cefazolin sodium, at concentrations 32.0; 44.0; 56.0; 68.0; 80.0 e 92.0 µg mL-1, obtained by visible
spectrophotometric method.
The equation of line determined by the method of least squares was y = 0.0108x - 0.0258, with a coefficient of determination (R²) equal to 0.9993 and correlation coefficient (r) equal to 0.9996 to cefazolin sodium standard.
The ANOVA calculated for the data from the analytical curve is shown in Table 2.
Limits of detection (LD) and quantification (LQ)
The results of limit of detection (LD) and limit of quantification (LQ) were 1.45 and 4.38 µg mL-1,
respectively. S RS
S
RS
A C
C
Table 2. Analysis of variance of absorbance values determined in the linearity parameter for cefazolin sodium
SOURCE DF SS MS Fcalcd. Fcrit.
Model 1 0.875459433 0.875459433 1.16 4.12
Residues 16 0.000630844 3.94278E-05 22204.13* 4.49
Lack of fit 4 0.000123511 3.08778E-05 0.73 3.26
Pure error 12 0.000507333 4.22778E-05
TOTAL 17 0.876090278
* Significant at p<0.05 %; DF = degrees of freedom; SS = sequential sum of squares; MS = adjusted mean squares
Table 3. Values determined for the precision parameter of cefazolin sodium by visible spectrophotometric method
Absorbances RSD ( %)
Repeatability 0.578 0.588 0.591 0.574 0.582 0.590 1.19
Intermediate Precision 0.583 0.574 0.580 0.576 0.582 0.576 0.76 0.581 0.589 0.579 0.574 0.577 0.582
* RSD = relative standard deviation
Table 4. Results of the recovery test by visible spectrophotometric method
Figure 4. Residue analysis for cefazolin sodium in lyophilized powder obtained by visible spectrophotometric method.
Precision, selectivityand accuracy
The results of precision are shown in Table 3.
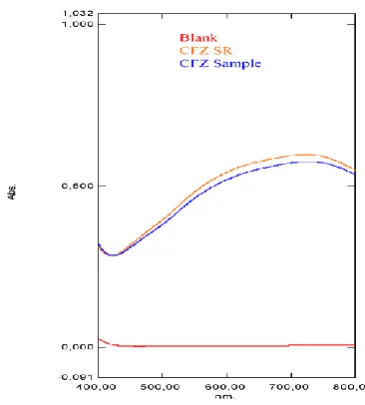
The spectra analysis present that all reagents did not interfere in the visible spectrophotometric method, showing the selectivity of this procedure.
Table 4 shows the recovery values obtained for each concentration level tested in the accuracy parameter of visible spectrophotometric method for cefazolin sodium.
Figure 5. Overlap of the visible spectrophotometric spectra referring the solutions at a concentration of 56.0 µg mL-1 of blank,
cefazolin sodium in lyophilized powder and cefazolin sodium reference.
Cefazolin sodium added (mL)
Cefazolin sodium recovered (mL)
Recovery ( %)
Average Recovery ( %) RSD ( %)
R1 0.6 0.60 99.79 100.58 0.69
R2 1.2 1.21 101.03
Table 5. Evaluation of the robustness of the analytical method for analysis of cefazolin sodium by visible spectrophotometry.
Length ofwave (nm) Absorbance 1 Absorbance 2 Absorbance 3 Average absorbance RSD ( %)
767 0.571 0.583 0.564 0.573 ± 0.004 1.68
760 0.578 0.571 0.574 0.574 ± 0.010 0.61
Robustness
The changes in the wavelength of absorption are shown in Table 5.
The average variations in wavelength selected for the study to assess the robustness parameter were statistically analyzed, and the results are shown in Table 6.
Table 6. Statistical analysis of the variation of wavelength in the visible spectrophotometric method
Statistical test
Fcalculated Fcritical tcalculated Tcritical
Wavelength 767 and 760 nm
1.42 5.05 -0.79 2.23
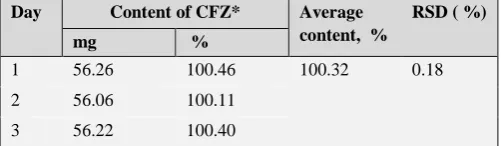
Determination of cefazolin sodium content
The assay was performed by comparing the absorbance obtained in analysis of cefazolin sodium standard and samples, both at a concentration of 56.0 µg mL-1. The results
are shown in Table 7.
Table 7. Values determined for the dosing of cefazolin sodium by visible spectrophotometric method
Day Content of CFZ* Average content, %
RSD ( %)
mg %
1 56.26 100.46 100.32 0.18
2 56.06 100.11
3 56.22 100.40
* Each value is the average of six determinations
Discussion
The reported methods for the determination of cefazolin sodium are complex, expensive, time-consuming or require the use of large amounts of organic solvents[66]. In this
research, a non-toxic solvent was chosen in order to obtain a low cost and environmentally friendly visible spectrophotometric method for quantification of cefazolin sodium in lyophilized powder.
Quantitative visible spectrophotometric analysis has as its principle the direct relationship between the amount of light absorbed and the concentration of the substances, also know Lambert-Beer law.21 This region, in pharmaceutical
analysis, is widely used for identification and assay of drug and medicines.21 All spectrophotometric techniques are
based on chemical interaction with a radiant energy and, in most cases, the effect of this interaction is the energy absorption by the material being analyzed.16
These features make spectrophotometric techniques particularly suitable for the determination of low concentrations of clinically important compounds.24 The
method has shorter analysis time, are economically most suitable and do not generate chemical waste too much.24, 60-65
Proper wavelength selection of the methods depends upon the nature of sample, and its solubility.56 Cefazolin sodium
is completely soluble in water.21 Thus, purified water was
chosen to be used as a solvent presenting appropriate features in the spectra, such as a good absorption intensity of the functional chromophore groups present on the molecule; besides easy acquisition, disposal, low cost and environmental advantages, since it does not generate toxic waste to the operator and the ecosystem.21, 56 The
wavelength of 767 nm was chosen due to the adequate molar absorptivity of cefazolin sodium in this region.
Cefazolin sodium, in its chemical structure, presents moments of molecular resonance, allowing the intermediates to have electronic density close to the phenolic compounds. Spectrophotometric quantification of phenolic compounds is accomplished by a variety of techniques, however, the one utilizing Folin-Ciocalteau reagent is among the most extensively used. The reagent consists of a mixture of phosphomolybdic and phosphotungstic acids, in which molybdenum and tungsten are in the +6 oxidation state, but in the presence of certain reducing agents, such as phenolic compounds, they form the so-called blue molybdenum and blue tungsten.58, 59
During the development of the visible spectrophotometric method for quantification of cefazolin sodium in the pharmaceutical form powder for injection solution, were tested concentrations that varied from 2.0 to 182.0 µg mL-1.
The concentrations from 32.0 to 92.0 µg mL-1, since this
group showed linearity of response.
The linearity of the method, we constructed a graph of
concentration versus absorbance, which showed
proportionality between both. Residue analysis indicated that the regression model used is appropriate. Each average value of absolute areas obtained in determining the analytical curve was plotted in relation to its concentration, observing linearity in the range of 32-92 μg mL-1, as shown
in Figure 4. The results for linearity were statistically analyzed using tests of variance (ANOVA); according to ANOVA there is no deviation from linearity in calibration curve and the regression model is appropriate.
These values indicate the ability of this method to reliably detect and quantify cefazolin sodium in its pharmaceutical dosage form.
The precision of the method was evaluated in two different ways: by repeatability (intraday precision) and intermediate precision (interday and inter-analyst precisions). The results are presented in Table 4. The intraday precision (n = 6) gave an RSD value of 1.19 %. The RSD values observed in intermediate precision (n = 12) was 0.76 %, demonstrating appropriate precision of the method.
The accuracy of the method was determined by measuring the reference standard recovery in triplicate at three levels (R1, R2 and R3), from 80 to 120 % of the method concentration (56.0 µg mL-1), according to ICH
recommendation.54 The accuracy was determined using a
recovery assay performed at three concentration levels (Table 5). The recovery test is an experimental design to verify the relationship between the amount of substance added and the amount quantified by this assay.57 Thus, the
data demonstrates adequate accuracy of the method, since the experimental concentrations were very close to the real values (close to 100 %).
Changes in the wavelength of absorption were performed to evaluate the robustness of the method. During the analysis of the pharmaceutical product, the levels found no significant difference and RSD were below 0.61 %, demonstrating the robustness of the proposed method, compared to the measured parameter, as shown in Tables 6 and 7.
The content of cefazolin sodium in lyophilized powder was 100.32 %. The proposed visible spectrophotometric method met all requirements required by the official codes agency guidelines,15,51,54-55 making it adequate, presenting
linearity, precision, selectivity, accuracy and robustness, and can be used for assay of cefazolin sodium in lyophilized powder at quality control laboratories.
Conclusion
The validation of analytical methods is the way to ensure that the developed process is safe and meets the requirements of official compendia, demonstrating reliability and reproducibility of the results. Green chemistry is important for the development of methods that are less harmful to the environment, less costly, and have the same reliability and reproducibility of conventional methods.
All validation parameters found to be highly satisfactory, indicating selectivity, linearity, precision, accuracy, robustness and adequate detection and quantification limits, with no significant statistical difference. The method, therefore, can be applied in routine of quality control laboratories, due to its ease to execute, low cost, low generation of toxic waste and safety for analyst and environmental.
Acknowledgement
The authors are grateful to ABL™ to the supplied of the samples, CNPq (Brasília, Brazil) and FAPESP (São Paulo, Brazil) for their financial support.
References
1El-Shaboury, S. R., Saleh, G. A., Mohamed, F. A., Rageh, A. H.
Analysis of cephalosporin antibiotics. J. Pharm. Biomed. Anal., 2007, 45, 1-19.
https://doi.org/10.1016/j.jpba.2007.06.002
2Hardman, J. G., Limbird, L. E., Goodman & Gilman: the pharmacological basis of therapeutics. 11th. New York: McGraw-Hill, 2006, p. 1206-1213.
3Neu, H. C. Cephalosporin antibiotics: molecules that respond to
different needs. Am. J. Surgery, 1988, 155(1), p. 1-4, 1988.
https://doi.org/10.1016/S0002-9610(88)80204-6
4Pichichero, M. E. Use of selected cephalosporins in
penicillin-allergic patients: a paradigm shift. Diagn. Microbiol. Infect. Disease, 3007, 57(3), 3-8.
https://doi.org/10.1016/j.diagmicrobio.2006.12.004
5Sweetman, S. C., Martindale: the complete drug reference. 36th.
London: Pharmaceutical Press, 2009. 3694 p.
6Ohannesian, S., Handbook of Pharmaceutical Analysis. New
York: Informa Health Care, 2002, 585 p.
7Watson, D., Pharmaceutical Analysis: a textbook for pharmacy
students and pharmaceuticals chemists. London: Churchill Livingstone, 1999, 337 p.
8Alekseev, V. D., Drug synthesis methods and manufacturing
technology. Pharm. Chem. J., 2010, 44(1), 16-26.
9Kristen, R., Levinson, M. E., Ksye, D., Clinical and in vitro
evaluation of cefazolin, a new cephalosporin antibiotic. Antimicrobial Agents and Chemotherapy, v. 3, n. 2, p. 168-174, 1973.
https://doi.org/10.1128/AAC.3.2.168
10Tótoli, E. G., Salgado, H R. N., Development of an innovative,
ecological and stability-indicating analytical method for semiquantitative analysis of ampicillin sodium for injection by thin-layer chromatography (TLC). World J. Pharm. Pharm. Sci., 2014, 3(1), 1944-1957.
11BP. BRITISH PHARMACOPEIA, London: The Stationary
Office, 2010, 1, 396-398
12EP. EUROPEAN PHARMACOPEIA. Council of Europe, 2005,
2, 1220-1222.
13JP. JAPANESE PHARMACOPEIA, Tokyo: Society of Japanese
Pharmacopeia, 2011, 16th.
14FP. FARMACOPÉIA PORTUGUESA, Lisboa: Imprensa
Nacional, 2005, 6th, 166-168.
15USP. THE UNITED STATES PHARMACOPEIA,. Rockville:
The United States Pharmacopeia Convention, 2016, 39th. 16Pedroso, T. M., Salgado, H. R. N., Methods for qualitative
analysis of cefazolin sodium raw material and pharmaceutical product. Phys. Chem.,2013, 3(9), 29-38,
17Ali, S. M., Elbashir, A. A., Aboul-Enein, H. Y., Spectroscopic
methods for analysis of cephalosporins in pharmaceutical formulations. World J. Anal. Chem., 2015, 3(1), 21-32.
18Saleh, G. A., Askal, H. F., Darwish, I. A., El-Shorbagi, A. N. A.,
Spectroscopic analytical study for the charge-transfer complexation of certain cephalosporins with chloranilic acid. Anal. Sci., 2003, 19, 281-287.
19Ayad, M. M., Shalaby, A. A., Abdellatef, H. E., El Said, H. M.,
Spectrophotometric and atomic absorption spectrometric determination of certain cephalosporins. J. Pharm. Biomed. Anal., 1999, 18, 975-983.
https://doi.org/10.1016/S0731-7085(98)00106-X
20Saleh, G. A., Askal, H. F., Radwan, M. F., Omar, M. A., Use of
charge-transfer complexation in the spectrophotometric analysis of certain cephalosporins. Talanta, 2001, 54, 1205-1215, 2001.https://doi.org/10.1016/S0039-9140(01)00409-X
21Pedroso, T. M., Salgado, H. R. N., Validation of cefazolin
sodium in pharmaceutical dosage forms by UV-spectrophotometric method. Phys. Chem., 2013, 3, 11-20, 2013.
22Omar, M. A., Abdelmageed, O. H., Tamer, Z., Attia, T. Z.,
Kinetic spectrophotometric determination of certain cephalosporins in pharmaceutical formulations. Int. J. Anal. Chem., 2009, 1-12. https://doi.org/10.1155/2009/596379
23Al-Momani, I. F., Spectrophotometric determination of selected
cephalosporins in drug formulations using flow injection analysis. J. Pharm. Biomed. Anal., 2001, 25, 751-757.
https://doi.org/10.1016/S0731-7085(01)00368-5
24Amin, A. S., Ragab, G. H., Spectrophotometric determination of
certain cephalosporins in purê form and pharmaceutical formulations. Spectrochim. Acta, 2004, 60, 2831-2835.
https://doi.org/10.1016/j.saa.2003.12.049
25Agbaba, D., Eric, S.; Karljikovic-Rajic, K., Zivanov, S., Stakic,
D., Spectrophotometric determination of certain cephalosporins using ferric hydroxamate method. Spectr. Lett., 1997, 30(2), 309-319.
https://doi.org/10.1080/00387019708006990
26Ogorevc, B., Hudnik, V., A spectroscopic and polarographic
investigation of the complexation of cefazolin with copper (II) ions. Inorg. Chim. Acta, 1985, 108, L3-L6.
https://doi.org/10.1016/S0020-1693(00)84312-1
27Kalinkova, G. N., Ovcharova, G., Gagavzov, I., Krestev, V.,
Petrov, L., Comparative IR-spectral studies of different modifications of the antibiotic cefazolin Na. J. Mol. Struct.,
1990, 219, 329-334. https://doi.org/10.1016/0022-2860(90)80077-W
28Elizarova, T. E., Shtyleva, S. V., Pleteneva, T. V., Using
near-infrared spectrophotometry for the identification of pharmaceutical and drugs. Pharm. Chem. J., 2008, 42(7), 432-434. https://doi.org/10.1007/s11094-008-0146-2
29Halaleh, M. I. H., Abu-Nameh, E. S. M., Jamhour, R. M. A. Q.,
Direct titration and indirect spectrophotometric determination of selected cephalosporins. Acta Pol. Pharm., 1998, 55(2), 93-97.
30Moore, C. M.; Sato, K., High-performance liquid
chromatography determination of cephalosporin antibiotics using 0.3 mm I.D. columns. J. Chromy. A,1991, 539, 215-220. https://doi.org/10.1016/S0021-9673(01)95377-4
31Tsai, T. H.; Chen, Y. F., Simultaneous determination of cefazolin
in rat blood and brain by microdialysis and microbore liquid chromatography. Biomed. Chromy., 2000, 14, 274-278.
https://doi.org/10.1002/1099-0801(200006)14:4<274::AID-BMC985>3.0.CO;2-H
32Sørensen, L. K.; Snor, L. K., Determination of cephalosporins in
raw bovine milk by high-performance liquid chromatography. J. Chromy. A, 2000, 882, 145-151.
https://doi.org/10.1016/S0021-9673(99)01317-5
33Pedroso, T. M., Salgado, H. R. N., Validation of analytical
methodology for quantification of cefazolin sodium pharmaceutical industry. Braz. J. Pharm. Sci.,2013,50, 213-223, 2013.
https://doi.org/10.1590/S1984-82502011000100022
34Samanidou, V. F., Hapeshi, E. A., Papadoyannis, I. N., Rapid and
sensitive high-performance liquid chromatographic determination of four cephalosporins antibiotics in pharmaceuticals and body fluids. J. Chromy. B, 2003, 788, 147-158. https://doi.org/10.1016/S1570-0232(02)01040-1
35Ohmori, T., Suzuki, A., Niwa, T., Ushikoshi, H., Shirai, K.,
Yoshida, S., Ogura, S., Itoh, Y., Simultaneous determination of eight β-lactam antibiotics in human serum by liquid chromatography-tandem mass spectrometry. J. Chromy B.,
2011, 879, 1038-1042.
https://doi.org/10.1016/j.jchromb.2011.03.001
36Liang, D., Chow, D., White, C. High-performance liquid
chromatographic assay of cefazolin in rat tissues. J. Chromy. B,1994, 656, 460-465. https://doi.org/10.1016/S0378-4347(94)80109-6
37Chan, C. Y., Chan, K., French, G. L. Rapid high-performance
liquid chromatographic assay of cephalosporins in biological fluids. J. Antimicrob. Chemotherapy, 1986, 18(4), 537-545.
https://doi.org/10.1093/jac/18.4.537
38Lalitha, N.; Sanjay, P. P. N.; Vyshak. M. G.; Kadri, U.
Stability-indicating reverse phase HPLC method for the determination of cefazolin. Tropical J. Pharm. Res., 2010, 9(1), 45-50.
https://doi.org/10.4314/tjpr.v9i1.52034
39Al-Rawithi, S., Hussein, R., Raines, D. A., Al-Showaier, I.,
Kurdi, W., Sensitive assay for determination of cefazolin or ceftriaxone in plasma utilizing LC. J. Pharm. Biomed. Anal.,
2000, 22, 281-286. https://doi.org/10.1016/S0731-7085(99)00273-3
40Annesley, T., Wilkerson, K., Matz, K., Giacherio, D.,
Simultaneous determination of penicillin and cephalosporin antibiotics in serum by gradient liquid chromatography. Clin. Chem., 1984, 30(6), 908-910.
41Arayne, M. S., Sultana, N., Bi, Z., Simultaneous determination of
cefazolin or ceftizoxime in the presence of ascorbic acid from pharmaceutical formulation and human serum by RP-HPLC. Pak. J. Pharm. Sci., 2007, 1,. 56-61.
42Baranowska, I., Markowski, P., Baranowski, J., Simultaneous
determination of 11 drugs belonging to four different groups in human urine samples by reversed-phase high-performance liquid chromatography method. Anal. Chim. Acta, 2006, 570, 46-58. https://doi.org/10.1016/j.aca.2006.04.002
42Bayomi, S. M., Vallner, J. J., Dipiro, J. T., Quantitative of
cefazolin sodium in plasma and tissues by high-performance liquid chromatography. Int. J. Pharm., 1986, 30, 57-61.
https://doi.org/10.1016/0378-5173(86)90135-3
43Bompadre, S, Leone, F., Ferrante, L., Alo, F. P.; Ioannidis, G.,
Determination of cefazolin in human serum by high-performance liquid chromatography with on-line solid-phase extraction. J. Liq. Chromy Related Technol., 1998, 21(3), 417-426. https://doi.org/10.1080/10826079808000500
44Brisson, A. M., Fortillan, J. B., Determination of cephalosporins
in biological material by reversed-phase liquid column chromatography. J. Chromy,1981, 223, 393-399.
https://doi.org/10.1016/S0378-4347(00)80112-7
45Danzer, L. A., Liquid-chromatography determination of
cephalosporins and chloramphenicol in serum. Clin. Chem.,
1983, 29(5), 856-858.
46Farthing, C., Farthing, D., Brophy, D. F., Larus, T., Maynor, L.,
Fakhry, I., Gehr, T. W. B., High-performance liquid chromatography determination of cefepime and cefazolin in human plasma and dialysate. Chromatographia, 2008, 67(5-6), 441-447. https://doi.org/10.1365/s10337-008-0529-2
47El-Desoky, H. S., Ghoneim, E. M., Ghoneim, M. M.,
Voltammetric behavior and assay of the antibiotic drug cefazolin sodium in bulk form and pharmaceutical formulation at a mercury electrode. J. Pharm. Biomed. Anal.,
2005, 39, 1051-1056.
https://doi.org/10.1016/j.jpba.2005.05.020
48Carioca, J. O. B., Brazilian Network on Green Chemistry:
Awareness, Responsibility and Action. Universidade Estadual do Ceará: Fortaleza, 2008.
49Brito, N. M., Junior, O. P. A., Polese, L., Ribeiro, M. L.,
Validação de métodos analíticos: Estratégia e discussão. Rev. Ecotoxicol. Meio Ambiente, 2003, 13, 129-146.
50BRASIL, Ministério da Saúde. Resolução RE 899, de 29 de maio
de 2003. Determina a publicação do "Guia para validação de
métodos analíticos e bioanalíticos". Diário Oficial da União, Brasília, 02 de junho 2003. Seção 1.
51ISO - INTERNATIONAL STANDARD ORGANIZATION;
General Requirements for the Competence of Testing and Calibration Laboratories, ISO/IEC 17025, 1999.
52INSTITUTO NACIONAL DE METROLOGIA,
NORMALIZAÇÃO E QUALIDADE INDUSTRIAL (INMETRO). Orientação sobre validação de métodos de ensaios químicos, DOQ-CGCRE-008, 2011.
53Int. Conf. Harmonization, (ICH). Validation of Analytical
Procedures: Text and Methodology Q2(R1), Geneva, 2005.
54Chierentin, L., Salgado, H. R. N., Performance characteristics of
UV and visible spectrophotometry methods for quantitative determination norfloxacin in tablets. J. Sci. Res., 2014, 6, 531-541. https://doi.org/10.3329/jsr.v6i3.18381
55Marona, H. R. N., Schapoval, E. E. S., Spectrophotometric
determination of sparfloxacin in tablets. J. Antimicrob. Chemotherapy,1999, 44(1), 136-137.
https://doi.org/10.1093/jac/44.1.136
56Furlan, C. M., Santos, K. P., Sedano-Partida, M. D., Motta, L. B.,
Santos, D. Y. A., Salatino, M. L. F., Negri, G., Berry, P. E., Van-Ee, B. W., Salatino, A., Flavonoids and antioxidant potential of nine Argentinian species of Croton (Euphorbiaceae). Braz. J. Botany,2015, 38(4), 693-702.
https://doi.org/10.1007/s40415-014-0115-9
57Sousa, C. M. M., Silva, H. R., Vieira-Jr, G. M., Ayres, M. C. C.,
Costa, C. L. S., Araújo, D. S., Cavalcante, L. C. D., Barros, E. D. S., Araújo, P. B. M., Brandão, M. S., Chaves, M. H., Fenóis totais e atividade antioxidante de cinco plantas medicinais. Quím. Nova,2007, 30(2), 351-355.
https://doi.org/10.1590/S0100-40422007000200021
58Moreno, A., Salgado, H. R. N., Spectrophotometric determination
of ceftazidime in pharmaceutical preparations using neocuproing as a complexing agent. Anal. Lett., 2008, 41(12), 2143-2152.
https://doi.org/10.1080/00032710802240818
59Marona, H. R. N., Schapoval, E. E. S. Spectrophotometric
determination of sparfloxacin in pharmaceutical formulation using bromothymol blue. J. Pharm. Biomed. Anal., 2001, 26(3), 501-504.
https://doi.org/10.1016/S0731-7085(01)00429-0
60Silva, L. M., Almeida, A. E., Salgado, H. R. N., Thermal analysis
and validation of UV and visible spectrophotometric methods for the determination of new antibiotic tigecycline in pharmaceutical product. Adv. Anal. Chem.,2012, 2(1), 10-15.
61Kogawa, A. C., Salgado, H. R. N., Quantification of doxycycline
hyclate in tablets by ultraviolet spectrophotometric method. World Res. J. Pharm. Res., 2013, 1(2), 21-24.
62Kogawa, A. C., Salgado, H. R. N., Quantification of rifaximin in
tablets by spectrophotometric method ecofriendly in ultraviolet region. Scientifica, 2016, n. 3463405, 1-9.
https://doi.org/10.1155/2016/3463405
63Brbaklic, V., Kogawa, A. C., Salgado, H. R. N. Quantification of rifaximin in tablets by an environmentally friendly visible spectrophotometric method. Current Pharm. Anal., 2016, 12,
DOI 10.2174/1573412912666160906144024