Efficient Elicitation of Annotations for Human Evaluation of Machine
Translation
Keisuke Sakaguchi∗, Matt Post†, Benjamin Van Durme† ∗Center for Language and Speech Processing †Human Language Technology Center of Excellence
Johns Hopkins University, Baltimore, Maryland {keisuke,post,vandurme}@cs.jhu.edu
Abstract
A main output of the annual Workshop on Statistical Machine Translation (WMT) is a ranking of the systems that partici-pated in its shared translation tasks, pro-duced by aggregating pairwise sentence-level comparisons collected from human judges. Over the past few years, there have been a number of tweaks to the ag-gregation formula in attempts to address issues arising from the inherent ambigu-ity and subjectivambigu-ity of the task, as well as weaknesses in the proposed models and the manner of model selection.
We continue this line of work by adapt-ing the TrueSkillTMalgorithm — an online approach for modeling the relative skills of players in ongoing competitions, such as Microsoft’s Xbox Live — to the hu-man evaluation of machine translation out-put. Our experimental results show that TrueSkill outperforms other recently pro-posed models on accuracy, and also can significantly reduce the number of pair-wise annotations that need to be collected by sampling non-uniformly from the space of system competitions.
1 Introduction
The Workshop on Statistical Machine Translation (WMT) has long been a central event in the ma-chine translation (MT) community for the evalua-tion of MT output. It hosts an annual set of shared translation tasks focused mostly on the translation of western European languages. One of its main functions is to publish a ranking of the systems for each task, which are produced by aggregating a large number of human judgments of sentence-level pairwise rankings of system outputs. While the performance on many automatic metrics is also
# score range system
1 0.638 1 UEDIN-HEAFIELD 2 0.604 2-3 UEDIN
0.591 2-3 ONLINE-B 4 0.571 4-5 LIMSI-SOUL
0.562 4-5 KIT 0.541 5-6 ONLINE-A 7 0.512 7 MES-SIMPLIFIED
8 0.486 8 DCU
9 0.439 9-10 RWTH 0.429 9-11 CMU-T2T 0.420 10-11 CU-ZEMAN 12 0.389 12 JHU
[image:1.595.327.503.204.346.2]13 0.322 13 SHEF-WPROA
Table 1: System rankings presented as clusters (WMT13 French-English competition). Thescore column is the percentage of time each system was judged better across its comparisons (§2.1).
reported (e.g., BLEU (Papineni et al., 2002)), the human evaluation is considered primary, and is in fact used as the gold standard for its metrics task, where evaluation metrics are evaluated.
In machine translation, the longstanding dis-agreements about evaluation measures do not go away when moving from automatic metrics to hu-man judges. This is due in no small part to the in-herent ambiguity and subjectivity of the task, but also arises from the particular way that the WMT organizers produce the rankings. The system-level rankings are produced by collecting pairwise sentence-level comparisons between system out-puts. These are then aggregated to produce a com-plete ordering of all systems, or, more recently, a partial ordering (Koehn, 2012), with systems clus-tered where they cannot be distinguished in a sta-tistically significant way (Table 1, taken from Bo-jar et al. (2013)).
A number of problems have been noted with this approach. The first has to do with the na-ture of ranking itself. Over the past few years, the WMT organizers have introduced a number of mi-nor tweaks to the ranking algorithm (§2) in reac-tion to largely intuitive arguments that have been
raised about how the evaluation is conducted (Bo-jar et al., 2011; Lopez, 2012). While these tweaks have been sensible (and later corroborated), Hop-kins and May (2013) point out that this is essen-tially a model selection task, and should prop-erly be driven by empirical performance on held-out data according to some metric. Instead of in-tuition, they suggest perplexity, and show that a novel graphical model outperforms existing ap-proaches on that metric, with less amount of data. A second problem is the deficiency of the mod-els used to produce the ranking, which work by computing simple ratios of wins (and, option-ally, ties) to losses. Such approaches do not con-sider the relative difficulty of system matchups, and thus leave open the possibility that a system is ranked highly from the luck of comparisons against poorer opponents.
Third, a large number of judgments need to be collected in order to separate the systems into clus-ters to produce a partial ranking. The sheer size of the space of possible comparisons (all pairs of sys-tems times the number of segments in the test set) requires sampling from this space and distributing the annotations across a number of judges. Even still, the number of judgments needed to produce statistically significant rankings like those in Ta-ble 1 grows quadratically in the number of par-ticipating systems (Koehn, 2012), often forcing the use of paid, lower-quality annotators hired on Amazon’s Mechanical Turk. Part of the prob-lem is that the sampling strategy collects data uni-formly across system pairings. Intuitively, we should need many fewer annotations between sys-tems with divergent base performance levels, in-stead focusing the collection effort on system pairs whose performance is more matched, in order to tease out the gaps between similarly-performing systems. Why spend precious human time on re-dundantly affirming predictable outcomes?
To address these issues, we developed a varia-tion of the TrueSkill model (Herbrich et al., 2006), an adaptative model of competitions originally de-veloped for the Xbox Live online gaming commu-nity. It assumes that each player’s skill level fol-lows a Gaussian distribution N(µ, σ2), in which µrepresents a player’s mean performance, andσ2
the system’s uncertainty about its current estimate of this mean. These values are updated after each “game” (in our case, the value of a ternary judg-ment) in proportion to how surprising the outcome
is. TrueSkill has been adapted to a number of areas, including chess, advertising, and academic conference management.
The rest of this paper provides an empirical comparison of a number of models of human eval-uation (§2). We evaluate on perplexity and also on accuracy, showing that the two are not always correlated, and arguing for the primacy of the lat-ter (§3). We find that TrueSkill outperforms other models (§4). Moreover, TrueSkill also allows us to drastically reduce the amount of data that needs to be collected by sampling non-uniformly from the space of all competitions (§5), which also allows for greater separation of the systems into ranked clusters (§6).
2 Models
Before introducing our adaptation of the TrueSkill model for ranking translation systems with human judgments (§2.3), we describe two comparisons: the “Expected Wins” model used in recent evalu-ations, and the Bayesian model proposed by Hop-kins and May (§2.2).
As we described briefly in the introduction, WMT produces system rankings by aggregating sentence-level ternary judgments of the form:
(i, S1, S2, π)
where i is the source segment (id), S1 and S2
are the system pair drawn from a set of systems
{S}, and π ∈ {<, >,=} denotes whether the first system was judged to be better than, worse than, or equivalent to the second. These ternary judgments are obtained by presenting judges with a randomly-selected input sentence and the refer-ence, followed byfiverandomly-selected transla-tions of that sentence. Annotators are asked to rank these systems from best (rank 1) to worst (rank 5), ties permitted, and with no meaning as-cribed to the absolute values or differences be-tween ranks. This is done to accelerate data collec-tion, since it yields ten pairwise comparisons per ranking. Tens of thousands of judgments of this form constitute the raw data used to compute the system-level rankings. All the work described in this section is computed over these pairwise com-parisons, which are treated as if they were col-lected independently.
2.1 Expected Wins
pairwise comparisons. Let A be the complete set of annotations or judgments of the form
{i, S1, S2, πR}. We assume these judgments have
been converted into a normal form whereS1is
ei-ther the winner or is tied with S2, and therefore πR ∈ {<,=}. Letδ(x, y)be the Kronecker delta
function.1We then define the function:
wins(Si, Sj) =
|A| X
n=1
δ(Si, S1(n))δ(Sj, S2(n))δ(πR(n), <)
which counts the number of annotations for which system Si was ranked better than systemSj. We
define a single-variable version that marginalizes over all annotations:
wins(Si) =
X
Sj6=Si
wins(Si, Sj)
We also define analogous functions for losesand ties. Until the WMT11 evaluation (Callison-Burch et al., 2011), the score for each system Si was
computed as follows:
score(Si) = wins(Swins(Si) +ties(Si) i) +ties(Si) +loses(Si)
Bojar et al. (2011) suggested that the inclusion of ties biased the results, due to their large numbers, the underlying similarity of many of the models, and the fact that they are counted for both systems in the tie, and proposed the following modified scoring function:
score(Si) = |{S1}|
X
Sj6=Si
wins(Si, Sj) wins(Si, Sj) +wins(Sj, Si)
This metric computes an average relative fre-quency of wins, excluding ties, and was used in WMT12 and WMT13 (Callison-Burch et al., 2012; Bojar et al., 2013).
The decision to exclude ties isn’t without its problems; for example, an evaluation where two systems are nearly always judged equivalent should be relevant in producing the final ranking of systems. Furthermore, as Hopkins and May (2013) point out, throwing out data to avoid bi-asing a model suggests a problem with the model. We now turn to a description of their model, which addresses these problems.
1δ(x, y) = 1 ifx=y
0 o.w.
2.2 The Hopkins and May (2013) model
Recent papers (Koehn, 2012; Hopkins and May, 2013) have proposed models focused on the rel-ative ability of the competition systems. These approaches assume that each system has a mean quality represented by a Gaussian distribution with a fixed variance shared across all systems. In the graphical model formulation of Hopkins and May (2013), the pairwise judgments (i, S1, S2, π) are
imagined to have been generated according to the following process:
• Select a source sentencei
• Select two systems S1 and S2. A system Sj is associated with a Gaussian distribution
N(µSj, σ2a), samples from which represent the quality of translations
• Draw two “translations”, adding random Gaussian noise with varianceσ2
obsto simulate
the subjectivity of the task and the differences among annotators:
q1∼ N(µS1, σa2) +N(0, σobs2 )
q2∼ N(µS2, σa2) +N(0, σobs2 )
• Letdbe a nonzero real number that defines a fixed decision radius. Produce a ratingπ
according to:2
π=
< q1−q2> d > q2−q1> d = otherwise
The task is to then infer the posterior parameters, given the data: the system meansµSj and, by ne-cessity, the latent values{qi}for each of the
pair-wise comparison training instances. Hopkins and May do not publish code or describe details of this algorithm beyond mentioning Gibbs sampling, so we used our own implementation,3and describe it here for completeness.
After initialization, we have training instances of the form(i, S1, S2, πR, q1, q2), where all but the qi are observed. At a high level, the sampler
iter-ates over the training data, inferring values of q1
andq2for each annotation together in a single step
of the sampler from the current values of the sys-tems means,{µj}.4 At the end of each iteration,
2Note that better systems have higher relative abilities {µSj}. Better translations subsequently have on-average higher values{qi}, which translate into alowerrankingπ.
3github.com/keisks/wmt-trueskill
4This worked better than a version of the sampler that
these means are then recomputed by re-averaging all values of{qi}associated with that system.
Af-ter the burn-in period, theµs are stored as samples, which are averaged when the sampling concludes. During each iteration, q1 andq2 are resampled
from their corresponding system means:
q1 ∼ N(µS1, σa2)
q2 ∼ N(µS2, σa2)
We then update these values to respect the annota-tionπas follows. Lett=q1−q2(S1is the winner
by human judgments), and ensure that the values are outside the decision radius,d:
q10 =
(q
1 t≥d
q1+12(d−t) otherwise
q20 =
(q
2 t≥d
q2−12(d−t) otherwise
In the case of a tie:
q10 =
q1+12(d−t) t≥d
q1 t < d
q1+12(−d−t) t≤ −d
q20 =
q2−12(d−t) t≥d
q2 t < d
q2−12(−d−t) t≤ −d
These values are stored for the current iteration and averaged at its end to produce new estimates of the system means. The quantityd−tcan be in-terpreted as aloss function, returning a high value when the observed outcome is unexpected and a low value otherwise (Figure 1).
2.3 TrueSkill
Prior to 2012, the WMT organizers included refer-ence translations among the system comparisons. These were used as a control against which the evaluators could be measured for consistency, on the assumption that the reference was almost al-ways best. They were also included as data points in computing the system ranking. Another of Bojar et al. (2011)’s suggestions was to exclude this data, because systems compared more of-ten against the references suffered unfairly. This can be further generalized to the observation that
not all competitions are equal, and a good model should incorporate some notion of “match diffi-culty” when evaluating system’s abilities. The inference procedure above incorporates this no-tion implicitly in the inference procedure, but the model itself does not include a notion of match difficulty or outcome surprisal.
A model that does is TrueSkill5(Herbrich et al., 2006). TrueSkill is an adaptive, online system that also assumes that each system’s skill level follows a Gaussian distribution, maintaining a mean µSj for each system Sj representing its current
esti-mate of that system’s native ability. However, it also maintains a per-system variance,σ2
Sj, which represents TrueSkill’s uncertainty about its esti-mate of each mean. After an outcome is observed (a game in which the result is a win, loss, or draw), the size of the updates is proportional to how sur-prising the outcome was, which is computed from the current system means and variances. If a trans-lation from a system with a high mean is judged better than a system with a greatly lower mean, the result is not surprising, and the update size for the corresponding system means will be small. On the other hand, when an upset occurs in a competition, the means will receive larger updates.
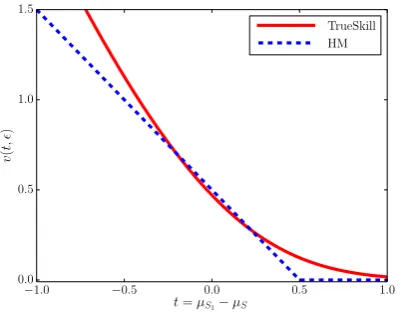
Before defining the update equations, we need to be more concrete about how this notion of sur-prisal is incorporated. Lett=µS1 −µS2, the dif-ference in system relative abilities, and letbe a fixed hyper-parameter corresponding to the earlier decision radius. We then define two loss functions of this difference for wins and for ties:
vwin(t, ) = NΦ((−−++t)t)
vtie(t, ) = NΦ((−−−t)t)−− NΦ(−(−−t)t)
whereΦ(x)is the cumulative distribution function and theNs are Gaussians. Figures 1 and 2 display plots of these two functions compared to the Hop-kins and May model. Note howvwin(Figure 1) in-creases exponentially asµS2 becomes greater than the (purportedly) better system,µS1.
As noted above, TrueSkill maintains not only estimates {µSj} of system abilities, but also system-specific confidences about those estimates
5The goal of this section is to provide an intuitive
−1.0 −0.5 0.0 0.5 1.0 t=µS1−µS2
0.0 0.5 1.0 1.5
v
(
t,
)
[image:5.595.82.287.75.231.2]TrueSkill HM
Figure 1: TrueSkill’s vwin and the corresponding loss function in the Hopkins and May model as a function of the difference t of system means ( = 0.5, c = 0.8 for TrueSkill, andd = 0.5for Hopkins and May model).
−1.5 −1.0 −0.5 0.0 0.5 1.0 1.5 t=µS1−µS2
−1.0 −0.5 0.0 0.5 1.0
v
(
t,
)
[image:5.595.76.293.319.479.2]TrueSkill HM
Figure 2: TrueSkills vtie and the corresponding loss function in the Hopkins and May model as a function of the difference t of system means (= 0.5, c= 0.3, andd= 0.5).
{σSj}. These confidences also factor into the up-dates: while surprising outcomes result in larger updates to system means, higher confidences (rep-resented by smaller variances) result in smaller updates. TrueSkill defines the following value:
c2 = 2β2+σ2
S1 +σ2S2
which accumulates the variances alongβ, another free parameter. We can now define the update equations for the system means:
µS1 =µS1 +
σ2
S1
c ·v
t c,
c
µS2 =µS2 −
σ2
S2
c ·v
t c,
c
The second term in these equations captures the idea about balancing surprisal with confidence, described above.
In order to update the system-level confidences, TrueSkill defines another set of functions,w, for the cases of wins and ties. These functions are multiplicative factors that affect the amount of change inσ2:
wwin(t, ) =vwin·(vwin+t−)
wtie(t, ) =vtie+(−t)· NΦ((−−t)t) + (−Φ(−+t)−· Nt) (+t)
The underlying idea is that these functions cap-ture the outcome surprisal viav. This update al-ways decreases the size of the variancesσ2, which
means uncertainty ofµdecreases as comparisons go on. With these defined, we can conclude by defining the updates forσ2
S1 andσS22:
σS21 =σ2S1· "
1−σS21
c2 ·w
t c,
c
#
σS22 =σ2S2· "
1−σS22
c2 ·w
t c,
c
#
One final complication not presented here but rel-evant to adapting TrueSkill to the WMT setting: the parameter β and another parameter (not dis-cussed) τ are incorporated into the update equa-tions to give more weight to recent matches. This “latest-oriented” property is useful in the gaming setting for which TrueSkill was built, where play-ers improve over time, but is not applicable in the WMT competition setting. To cancel this property in TrueSkill, we setτ = 0andβ= 0.025· |A| ·σ2
in order to lessen the impact of the order in which annotations are presented to the system.
2.4 Data selection with TrueSkill
collected in the WMT competitions. In fact, the TrueSkill formulation provides a way to compute the probability of a draw between two systems, which can be used to compute for a systemSi a
conditional distribution over matches with other systems{Sj6=i}.
Formally, in the TrueSkill model, the match-selection (chance to draw) between two players (systems in WMT) is computed as follows:
pdraw=
r 2β2
c2 ·exp(−
(µa−µb)2
2c2 )
However, our setting for canceling the “latest-oriented” property affects this matching quality equation, where most systems are almost equally competitive (≈1). Therefore, we modify the equa-tion in the following manner which simply de-pends on the difference ofµ.
ˆ
pdraw= exp(|µ1
a−µb|)
TrueSkill selects the matches it would like to create, according to this selection criteria. We do this according to the following process:
1. Select a system S1 (e.g., the one with the
highest variance)
2. Compute a normalized distribution over matches with other systems pairspˆdraw
3. Draw a systemS2from this distribution
4. Draw a source sentence, and present to the judge for annotation
3 Experimental setup
3.1 Datasets
We used the evaluation data released by WMT13.6 The data contains (1) five-way system rankings made by either researchers or Turkers and (2) translation data consisting of source sentences, hu-man reference translations, and submitted transla-tions. Data exists for 10 language pairs. More de-tails about the dataset can be found in the WMT 2013 overview paper (Bojar et al., 2013).
Each five-way system ranking was converted into ten pairwise judgments (§2). We trained the models using randomly selected sets of 400, 800, 1,600, 3,200, and 6,400 pairwise comparisons,
6statmt.org/wmt13/results.html
each produced in two ways: selecting from all re-searchers, or split between researchers and Turk-ers. An important note is that the training data differs according to the model. For the Expected Wins and Hopkins and May model, we sim-ply sample uniformly at random. The TrueSkill model, however, selects its own training data (with replacement) according to the description in Sec-tion 2.4.7
For tuning hyperparameters and reporting test results, we used development and test sets of 2,000 comparisons drawn entirely from the researcher judgments, and fixed across all experiments.
3.2 Perplexity
We first compare the Hopkins and May model and TrueSkill using perplexity on the test dataT, com-puted as follows:
ppl(p|T) = 2−P
(i,S1,S2,π)∈Tlog2p(π|S1,S2)
where p is the model under consideration. The probability of each observed outcomeπ between two systems S1 and S2 is computed by taking a
difference of the Gaussian distributions associated with those systems:
N(µδ, σδ2) =N(µS1, σS21)− N(µS2, σ2S2)
=N(µS1−µS2, σ2S1+σ2S2)
This Gaussian can then be carved into three pieces: the area whereS1loses, the middle area
represent-ing ties (defined by a decision radius, r, whose value is fit using development data), and a third area representing where S1 wins. By integrating
over each of these regions, we have a probability distribution over these outcomes:
p(π|S1, S2) =
R0
−∞N(µδ, σ2δ) ifπis>
Rr
0 N(µδ, σδ2) ifπis=
R∞
r N(µδ, σδ2) ifπis<
We do not compute perplexity for the Expected Wins model, which does not put any probability mass on ties.
7We use a Python implementation of TrueSkill
3.3 Accuracy
Perplexity is often viewed as a neutral metric, but without access to unbounded training data or the true model parameters, it can only be approxi-mated. Furthermore, it does not always corre-late perfectly with evaluation metrics. As such, we also present accuracy results, measuring each model’s ability to predict the values of the ternary pairwise judgments made by the annotators. These are computed using the above equation, picking the highest value of p(π) for all annotations be-tween each system pair(Si, Sj). As with
perplex-ity, we emphasize that these predictions are func-tions of the system pair only, and not the individual sentences under consideration, so the same out-come is always predicted for all sentences between a system pair.
3.4 Parameter Tuning
We follow the settings described in Hopkins and May (2013) for their model:σa= 0.5, σobs= 1.0, andd= 0.5. In TrueSkill, in accordance with the Hopkins and May model, we set the initialµand
σvalues for each system to 0 and 0.5 respectively, andto 0.25.
For test data, we tuned the “decision ra-dius” parameter r by doing grid search over
{0.001,0.01,0.1,0.3,0.5}, searching for the value which minimized perplexity and maximized accuracy on the development set. We do this for each model and language pair. When tuned by perplexity,ris typically either 0.3 or 0.5 for both models and language pairs, whereas, for accuracy, the bestris either 0.001, 0.01, or 0.1.
4 Results
4.1 Model Comparison
Figure 3 shows the perplexity of the two mod-els with regard to the number of training compar-isons. The perplexities in the figure are averaged over all ten language pairs in the WMT13 dataset. Overall, perplexities decrease according to the in-crease of training size. The Hopkins and May and TrueSkill models trained on both researcher and Turker judgments are comparable, whereas the Hopkins and May model trained on researcher judgments alone shows lower perplexity than the corresponding TrueSkill model.
In terms of accuracy, we see that the TrueSkill model has the highest accuracies, saturating at just over 3,000 training instances (Figure 4). TrueSkill
1000 2000 3000 4000 5000 6000 Training Data Size
2.80 2.85 2.90 2.95 3.00
P
erplexit
y
[image:7.595.309.514.68.233.2]HM-all HM-res TS-all TS-res
Figure 3: Model Perplexities for WMT13 dataset. ‘all’ indicates that models are trained on both re-searcher and Turker judgements, and ‘res’ means that models are trained on only researcher judge-ments.
outperforms Expected Win and the Hopkins and May, especially when the training size is small (Table 2). We also note that training on researcher judgments alone (dashed lines) results in better performance than training on both researchers and Turker judgments. This likely reflects both a bet-ter match between training and test data (recall the test data consists of researcher judgments only), as well as the higher consistency of this data, as evidenced by the annotator agreement scores pub-lished in the WMT overview paper (Bojar et al., 2013). Recall that the models only have access to the system pair (and not the sentences them-selves), and thus make the same prediction forπ
for a particular system pair, regardless of which source sentence was selected. As an upper bound for performance on this metric, Table 2 contains an oracle score, which is computed by selecting, for each pair of systems, the highest-probability ranking.8
Comparing the plots, we see there is not a per-fect relationship between perplexity and accuracy among the models; the low perplexity does not mean the high accuracy, and in fact the order of the systems is different.
4.2 Free-for-all matches
TrueSkill need not deal with judgments in pairs only, but was in fact designed to be used in a vari-ety of settings, including N-way free-for-all games
8Note that this might not represent a consistent ranking
1000 2000 3000 4000 5000 6000 Training Data Size
0.460 0.465 0.470 0.475 0.480 0.485 0.490 0.495 0.500
Accuracy ExpWin-all
[image:8.595.320.509.62.143.2]ExpWin-res HM-all HM-res TS-all TS-res
Figure 4: Model accuracies with different training domain for WMT13 dataset.
Train Size Exp-Win HM TrueSkill
400 0.465 0.471 0.479
800 0.471 0.475 0.483
all 1600 0.479 0.477 0.493
3200 0.486 0.489 0.493
6400 0.487 0.490 0.495
400 0.460 0.463 0.484
800 0.475 0.473 0.488
res 1600 0.481 0.482 0.493
3200 0.492 0.494 0.497
6400 0.495 0.496 0.497
Upper Bound 0.525
Table 2: Model accuracies: models are tuned by accuracy instead of perplexity. Upper bound is computed by selecting the most frequent choice (<, >,=) for each system pair.
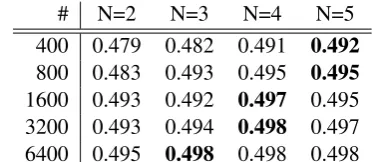
with many players all competing for first place. This adapts nicely to WMT’s actual collection set-ting. Recall that annotators are presented with five translations which are then ranked; we can treat this setting as a 5-way free-for-all match. While the details of these updates are beyond the scope of this paper, they are presented in the original model and are implemented in the toolkit we used. We thus also conducted experiments varying the value ofN from 2 to 5.
The results are shown in Tables 3 and 4, which hold constant the number of matches and pairwise judgments, respectively. When fixing the num-ber of matches, the 5-way setting is at an advan-tage, since there is much more information in each match; in contrast, when fixing the number of pair-wise comparisons, the 5-way setting is at a dis-advantage, since many fewer competitions
consti-# N=2 N=3 N=4 N=5
400 0.479 0.482 0.491 0.492
800 0.483 0.493 0.495 0.495
1600 0.493 0.492 0.497 0.495 3200 0.493 0.494 0.498 0.497 6400 0.495 0.498 0.498 0.498 Table 3: Accuracies when training with N-way free-for-all models, fixing the number of matches.
# N=2 N=3 N=4 N=5
400 0.479 0.475 0.470 0.459
800 0.483 0.488 0.476 0.466
1600 0.493 0.488 0.481 0.481
3200 0.493 0.492 0.487 0.489
[image:8.595.78.294.70.232.2]6400 0.495 0.496 0.494 0.495 Table 4: Accuracies when training with N-way free-for-all models, fixing the number of pairwise comparisons.
tute these comparisons. The results bear this out, but also suggest that the standard WMT setting — which extracts ten pairwise comparisons from each 5-way match and treats them independently — works well. We will not speculate further here, but provide this experiment purely to motivate po-tential future work. Here we will focus our con-clusions to the pair-wise ranking scenario.
5 Reduced Data Collection with Non-uniform Match Selection
As mentioned earlier, a drawback of the selection of training data for annotation is that it is sampled uniformly from the space of system pair compe-titions, and an advantage of TrueSkill is its abil-ity to instead compute a distribution over pairings and thereby focus annotation efforts on competi-tive matches. In this section, we report results in the form of heat maps indicating the percentage of pairwise judgments requested by TrueSkill across the full cross-product of system pairs, using the WMT13 French-English translation task.
[image:8.595.327.506.184.267.2]1 2 3 4 5 6 7 8 9 10 11 12 13 1
2 3
4
5 6
7
8 9
10
11
12 13
[image:9.595.93.271.70.222.2]0.0 0.2 0.4 0.6 0.8 1.0 1.2 1.4 1.6 1.8 2.0
Figure 5: Heat map for the ratio of pairwise judg-ments across the full cross-product of systems in the WMT13 French-English translation task.
1 2 3 4 5 6 7 8 9 10 11 12 13 1
2
3
4 5
6
7 8
9
10
11 12
13
[image:9.595.93.272.301.452.2]0.0 0.2 0.4 0.6 0.8 1.0 1.2 1.4 1.6 1.8 2.0
Figure 6: Heat map for the ratio of pairwise judg-ments across the full cross-product of systems used in thefirst20% of TrueSkill model.
1 2 3 4 5 6 7 8 9 10 11 12 13 1
2 3
4
5
6 7
8
9 10
11
12 13
0.0 0.2 0.4 0.6 0.8 1.0 1.2 1.4 1.6 1.8 2.0
Figure 7: Heat map for the ratio of pairwise judg-ments across the full cross-product of systems used in thelast20% of TrueSkill model.
into the WMT13 competition and thus had many fewer judgments. It is clear that these values are roughly uniformly distributed. This figure serves as a sort of baseline, demonstrating the lack of pat-terns in the data-selection process.
The next two figures focus on the data that TrueSkill itself selected for its use from among all of the available data. Figure 6 is a second heat map presenting the set of system pairs selected by TrueSkill for thefirst 20% of its matches chosen during training, while Figure 7 presents a heat map of thelast20%. The contrast is striking: whereas the judgments are roughly uniformly distributed at the beginning, the bulk of the judgments obtained for the last set are clustered along the diagonal, where the most competitive matches lie.
Together with the higher accuracy of TrueSkill, this suggests that it could be used to decrease the amount of data that needs to be collected in future WMT human evaluations by focusing the annota-tion effort on more closely-matched systems.
6 Clustering
[image:9.595.93.272.537.683.2]As pointed out by Koehn (2012), a ranking pre-sented as a total ordering among systems con-ceals the closeness of comparable systems. In the WMT13 competition, systems are grouped into clusters, which is equivalent to presenting only a partial ordering among the systems. Clusters are constructed using bootstrap resampling to in-fer many system rankings. From these rankings, rank rangesare then collected, which can be used to construct 95% confidence intervals, and, in turn, to cluster systems whose ranges overlap. We use a similar approach for clustering in the TrueSkill model. We obtain rank ranges for each system by running the TrueSkill model 100 times,9 throw-ing out the top and bottom 2 rankthrow-ings for each system, and clustering where rank ranges overlap. For comparison, we also do this for the other two models, altering the amount of training data from 1k to 25k in increments of 1,000, and plotting the number of clusters that can be obtained from each technique on each amount of training data.
Figure 8 show the number of clusters according to the increase of training data for three models. TrueSkill efficiently split the systems into clusters compared to other two methods. Figure 9 and 10 present the result of clustering two different size of
9We also tried the sampling 1,000 times and the clustering
5000 10000 15000 20000 25000 Pairwise Comparisons
0 1 2 3 4 5 6 7
Num. of Clusters
[image:10.595.311.531.64.224.2]ExpWin HM TS
Figure 8: The number of clusters according to the increase of training data for WMT13 French-English (13 systems in total).
training data (1K and 25K pairwise comparisons) on the TrueSkill model, which indicates that the rank ranges become narrow and generate clusters reasonably as the number of training samples in-creases. The ranking and clusters are slightly dif-ferent from the official result (Table 1) mainly be-cause the official result is based on Expected Wins. One noteworthy observation is that the ranking of systems between Figure 9 and Figure 10 is the same, further corroborating the stability and ac-curacy of the TrueSkill model even with a small amount of data. Furthermore, while the need to cluster systems forces the collection of sig-nificantly more data than if we wanted only to report a total ordering, TrueSkill here produces nicely-sized clusters with only 25K pairwise com-parisons, which is nearly one-third large of that used in the WMT13 campaign (80K for French-English, yielding 8 clusters).
7 Conclusion
Models of “relative ability” (Koehn, 2012; Hop-kins and May, 2013) are a welcome addition to methods for inferring system rankings from hu-man judgments. The TrueSkill variant presented in this paper is a promising further development, both in its ability to achieve higher accuracy levels than alternatives, and in its ability to sample non-uniformly from the space of system pair match-ings. It’s possible that future WMT evaluations could significantly reduce the amount of data they need to collect, also potentially allowing them to draw from expert annotators alone (the developers
uedin-h on.Buedin-w LIMSI KIT on.AMES-S DCU CMURWTH cu-z JHU Shef
1
2
3
4
5
6
7
8
9
10
11
12
[image:10.595.88.290.74.241.2]13
Figure 9: The result of clustering by TrueSkill model with 1K training data from WMT13 French-English. The boxes range from the lower to upper quartile values, with means in the middle. The whiskers show the full range of each system’s rank after the bootstrap resampling.
uedin-h on.Buedin-w LIMSI KIT on.AMES-S DCU CMURWTH cu-z JHU Shef
1
2
3
4
5
6
7
8
9
10
11
12
13
Figure 10: The result of clustering by TrueSkill model with 25K training data. Dashed lines sep-arate systems with non-overlapping rank ranges, splitting the data into clusters.
of the participating systems), without the need to hire non-experts on Mechanical Turk.
[image:10.595.310.531.342.504.2]References
Ondˇrej Bojar, Miloˇs Ercegovˇcevi´c, Martin Popel, and Omar Zaidan. 2011. A Grain of Salt for the WMT Manual Evaluation. In Proceedings of the Sixth Workshop on Statistical Machine Translation, pages 1–11, Edinburgh, Scotland, July. Association for Computational Linguistics.
Ondˇrej Bojar, Christian Buck, Chris Callison-Burch, Christian Federmann, Barry Haddow, Philipp Koehn, Christof Monz, Matt Post, Radu Soricut, and Lucia Specia. 2013. Findings of the 2013 Work-shop on Statistical Machine Translation. In Pro-ceedings of the Eighth Workshop on Statistical Ma-chine Translation, pages 1–44, Sofia, Bulgaria, Au-gust. Association for Computational Linguistics. Chris Callison-Burch, Philipp Koehn, Christof Monz,
and Omar Zaidan. 2011. Findings of the 2011 Workshop on Statistical Machine Translation. In Proceedings of the Sixth Workshop on Statisti-cal Machine Translation, pages 22–64, Edinburgh, Scotland, July. Association for Computational Lin-guistics.
Chris Callison-Burch, Philipp Koehn, Christof Monz, Matt Post, Radu Soricut, and Lucia Specia. 2012. Findings of the 2012 Workshop on Statistical Ma-chine Translation. In Proceedings of the Seventh Workshop on Statistical Machine Translation, pages 10–51, Montr´eal, Canada, June. Association for Computational Linguistics.
Ralf Herbrich, Tom Minka, and Thore Graepel. 2006. TrueSkillTM: A Bayesian Skill Rating System. In Proceedings of the Twentieth Annual Conference on Neural Information Processing Systems, pages 569– 576, Vancouver, British Columbia, Canada, Decem-ber. MIT Press.
Mark Hopkins and Jonathan May. 2013. Models of translation competitions. InProceedings of the 51st Annual Meeting of the Association for Computa-tional Linguistics (Volume 1: Long Papers), pages 1416–1424, Sofia, Bulgaria, August. Association for Computational Linguistics.
Philipp Koehn. 2012. Simulating Human Judgment in Machine Translation Evaluation Campaigns. In Proceedings of the 9th International Workshop on Spoken Language Translation (IWSLT), pages 179– 184, Hong Kong, China, December. International Speech Communication Association.
Adam Lopez. 2012. Putting Human Assessments of Machine Translation Systems in Order. In Proceed-ings of the Seventh Workshop on Statistical Machine Translation, pages 1–9, Montr´eal, Canada, June. As-sociation for Computational Linguistics.
Kishore Papineni, Salim Roukos, Todd Ward, and Wei-Jing Zhu. 2002. BLEU: a Method for Automatic Evaluation of Machine Translation. InProceedings of 40th Annual Meeting of the Association for Com-putational Linguistics, pages 311–318, Philadelphia,
Pennsylvania, July. Association for Computational Linguistics.