http://wrap.warwick.ac.uk
Original citation:
Barai, Anup, Guo, Yue, McGordon, Andrew and Jennings, Paul A. (2013) A study of the
effects of external pressure on the electrical performance of a lithium-ion pouch cell. In:
2013 International Conference on Connected Vehicles and Expo (ICCVE), Las Vegas,
USA, 2-6 Dec 2013. Published in: 2013 International Conference on Connected Vehicles
and Expo (ICCVE) 295- 299.
Permanent WRAP url:
http://wrap.warwick.ac.uk/63549
Copyright and reuse:
The Warwick Research Archive Portal (WRAP) makes this work by researchers of the
University of Warwick available open access under the following conditions. Copyright ©
and all moral rights to the version of the paper presented here belong to the individual
author(s) and/or other copyright owners. To the extent reasonable and practicable the
material made available in WRAP has been checked for eligibility before being made
available.
Copies of full items can be used for personal research or study, educational, or not-for
profit purposes without prior permission or charge. Provided that the authors, title and
full bibliographic details are credited, a hyperlink and/or URL is given for the original
metadata page and the content is not changed in any way.
Publisher’s statement:
“© 2013 IEEE. Personal use of this material is permitted. Permission from IEEE must be
obtained for all other uses, in any current or future media, including reprinting
/republishing this material for advertising or promotional purposes, creating new
collective works, for resale or redistribution to servers or lists, or reuse of any
copyrighted component of this work in other works.”
A note on versions:
The version presented here may differ from the published version or, version of record, if
you wish to cite this item you are advised to consult the publisher’s version. Please see
the ‘permanent WRAP url’ above for details on accessing the published version and note
that access may require a subscription.
A Study of the Effects of External Pressure on the
Electrical Performance of a Lithium-ion Pouch Cell
Anup Barai, Yue Guo, Andrew McGordon and Paul Jennings
WMG, University of WarwickCoventry, UK
Abstract—The introduction of lithium-ion batteries for vehicle powertrain electrification has increased in recent years. They feature high energy density, high power density, long cycle life, and is also environmentally friendly compared with other types of batteries. A large number of Li-ion cells are usually required to meet the demand in capacity and power for automotive applications. Pouch cells have been favored by many manufacturers because of the high packaging efficiency and, therefore, a higher pack energy density. However, robust packaging is required for performance and safety criteria due to their low mechanical stability, which results in them being compressed in the module/pack. This paper describes research into the effects of external pressure on the electrical performance of lithium-ion pouch cells. The authors have adopted pulse power test, capacity test and electrical impedance spectroscopy test to characterize the effects and the test result indicates lithium-ion pouch cell’s performance changes under varying external pressures. Conclusions are drawn on how to make use of the results presented to influence and improve the design of automotive battery modules and packs to meet the challenges in the automotive industry.
Keywords — lithium-ion battery; electrical performance; external pressure; impedance
I. INTRODUCTION
Over the past decades, lithium-ion (Li-ion) batteries have attracted wide attention in a number of applications from small cells in consumer electronics to full size battery packs in large scale applications. The Li-ion battery has high energy density, high power density, long cycle life, and is also environmentally friendly compared with other types of batteries. Hence, the adoption of Li-ion batteries for vehicle powertrain electrification has increased in recent years. A large number of Li-ion cells are usually required to meet the demand in capacity and power for automotive applications. A Li-ion cell typically has a characteristic voltage of ~3.7V and vehicle applications typically require voltages of ~300V. Pouch cells have been a popular choice for manufacturers because of the high packaging efficiency and, therefore, a higher pack energy density. However, pouch cells have low mechanical stability and robust packaging is required for performance and safety criteria, which results in them being compressed in the module/pack. In consideration of how the pouch cells are packaged, this study investigates the effects of external pressure on the electrical performance of lithium-ion pouch cells.
A study of the major testing standards, i.e., IEC 62660-1, ISO 12405-2, FreedomCAR Battery Test Manual, [1-3] gave no guidance regarding how a cell’s performance shall be characterised against different external pressures although other external factors have been specified, e.g., temperature, orientation. According to the literature reviewed, link between the stack level mechanical stress and capacity fade of Li-ion cells has been considered [4, 5]. However, there is no widely accepted theory of how large scale Li-ion pouch cell’s performance changes under varying external pressures. Previously researchers investigated effect of pressure on individual component such as anode, cathode, and separator. Gnanaraj et al reported compressing graphite electrodes has an adverse effect on the contact between the active mass and ions in solution [6]. They also testified to a slight improvement of performance of LiCoO2 electrode under compression. The
theory of performance increase of LiCoO2 electrode is also
investigated on individual electrode in a later study by Mao-Sung et al [7]. An explanation was given on the root cause of performance increase, as applying 0.08 bar pressure increases the electrode-electrolyte interface. Previous work has also indicated that ion transport properties of porous separator reduce when compressed [4, 5]. The author of this paper has developed a bespoke test rig and carried out experiments to investigate the effects of external pressure on the electrical performance of commercially available lithium-ion pouch cells. This paper also discusses how the performance of a vehicle pack is affected according to the experimental results observed on the individual cell. Finally, this paper draws conclusions about how to make use of the results presented to influence and improve the design of automotive battery modules and packs to meet the challenges in the automotive industry.
II. EXPERIMENTAL METHOD
A. Test matrix
were not damaged during delivery. Electrical impedance spectroscopy (EIS), capacity and pulse power tests were performed on these cells at three different temperatures i.e. 450C, 250C and 00C, and with four different external pressures
applied, i.e. ambient air pressure, 0.2 bar, 0.4 bar and 0.8 bar. Hence, there were 12 different test conditions. These characterization tests give insight of the cell performance in-terms of capacity, maximum power and internal impedance. Three temperature points are selected to represent room temperature and representation of high and low temperatures that an automotive battery can experience. The pressure cells will experience within a pack/module depends on the design of the pack/module. The pressure range selected here is influenced by the cell manufacturer recommendations and current automotive battery pack designs. The experiments were conducted using a bespoke pressure control rig, temperature controlled chamber, a potentiostat outfitted with a 20A booster module and a battery cell cycler.
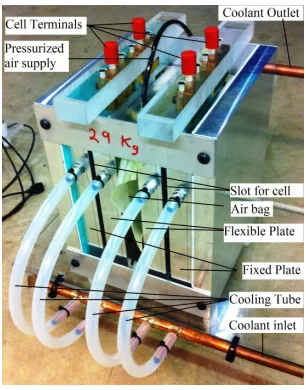
At the beginning of the experiment, capacity, pulse power tests [1] and EIS tests were performed at three temperatures without applying external pressure. Next, the same tests were repeated by applying external pressure at 0.2 bar, 0.4 bar and 0.8 bar respectively, using the test rig shown in Fig. 1.
Within the test rig the cell sits between a flexible plate and a fixed plate. The pressure is provided by an inflatable air bag which is positioned between two flexible plates to ensure the pressure applied on the two cells surface is equalized and unified. Moreover, the air bag is connected with air supply and regulated in a manner to maintain the set pressure constant. Pressure was increased gradually to avoid any irreversible change caused by higher external pressure.
For the temperature sequence, 250C was performed first; then the temperature was increased to 450C and finally
decreased to 00C. The temperature sequence was selected to
minimize any irreversible ageing caused by high and low temperatures. For each change in temperature the cells were allowed a minimum 3 hours to soak at the set temperature.
Fig. 1. Test rig
B. Characterization test details
The pulse power test was performed only at 50% SoC to maintain a balance between charge and discharge pulses. The SoC adjustment was carried out in accordance to IEC 62660-1 standard [1]. Specifically, 50% SoC was reached by discharging a fully charged cell for 30min at 1C rate. The pulse profile is consisted of 1.6C, 3.2C, 4.8C, 6.4C and 8C charge and discharge pulses of 10s duration each. This pulse profile is charge neutral, but not energy neutral. So, SoC was re-adjusted before repeating it at different temperatures and pressures.
EIS measurements were performed in the frequency range of 10 mHz to 10 kHz with a 1.25 Amp RMS sinusoidal current. Impedance spectra were measured only at 50% SoC. SoC was adjusted at 250C and EIS were performed at different
temperatures.
For the capacity test, first the cells were fully charged at 250C using CC-CV method at 1C rate. Next, the test
temperature was adjusted and the cell soaked for 3 hours before being discharged to the lower voltage limit at 1C rate.
III. RESULTS AND DISCUSSION
A. Pulse power test
Fig. 2 shows the pulse power test results of the cell under four different pressure conditions for both discharging and charging.
A1. – Discharging Behavior
In fig. 2(a), the cell voltage after the 10s discharge pulses at 450C are plotted. As pressure increases the cell voltage decreases. The effect increases with increase in discharge current which is clearly visible from the gradient of linear fits shown in the figure. This indicates an increase of internal impedance of the cell with increasing external pressure, resulting in lower power and capacity. Fig. 2(b) shows similar results obtained at 250C. It is also follows the result shown in
fig. 2(a) except that the cell voltage was increased when 0.2 bar external pressure was applied compared to the no-pressure condition. That means applying 0.2 bar external pressure at 250C actually improves the performance of the cell. Above
this, the voltage continues to drop with increase in external pressure. At 00C it was not possible to continue discharging the cell at or above 4.8C as the cell voltage drops below the minimum discharge voltage. Because of this reason the data at 00C is not analyzed here.
A2. – Charging Behavior
In figure 2(c), the cell voltage after the 10s charge pulse at 450C is plotted. As pressure increases, cell voltage increases,
[image:3.612.102.255.523.718.2]completed as the cell voltage reached maximum charge voltage early in this condition. Similar to the behavior of the cell during the discharge pulses at 250C here also cell has
[image:4.612.368.515.54.307.2]better performance at high current when 0.2 bar external pressure applied compare to the no-pressure condition.
Fig. 2 Cell voltage at the end of 10s charge-discharge pulse, under four different pressure conditions (a) 450C, (b) 250C, (c) 450C and (d) 250C.
Fig. 3 Charge and discharge equivalent circuit of a battery cell (a) during discharge (b) during charge.
These results also indicate an increase in internal impedance with increase in external pressure despite the gradients having opposite signs. This can be explained by a consideration of the equivalent circuit of a cell during discharge and during charge and is shown here in figure 3 (a) and (b). The equations are developed using Kirchhoff’s circuit law. Here, Z0 is the internal impedance of the cell. If Z0
increases, the cell voltage, VCell, goes up during charge and
down during discharge. Also, when the cell voltage increases more quickly, maximum charge voltage will be reached sooner, which leads to temporary capacity loss.
B. Capacity Test
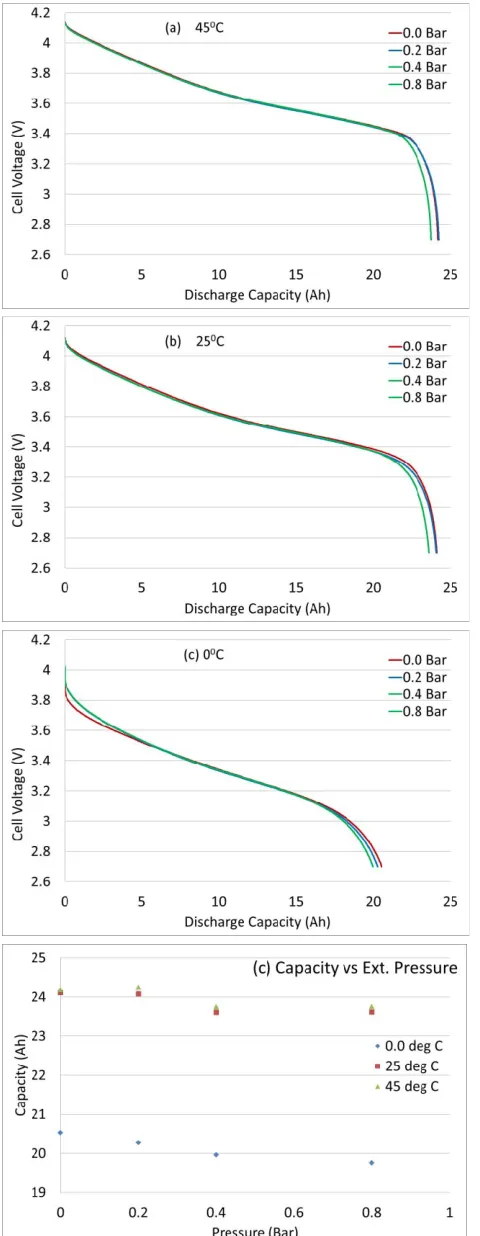
Fig. 4 (a), (b) and (c) show the discharge curves of the cell under four different pressure conditions at 450C, 250C and
00C, at 1C rate. As the external pressure increases, cell
capacity decreases steadily. This experiment shows an external pressure of 0.8 bar leads to a capacity reduction of 2% at 250C and 4% at 00C. The shape of the discharge voltage
[image:4.612.58.282.110.698.2]Fig. 4 Discharge curves of the cell at three different temperatures: (a) 00C, (b)
250C and (c) 450C.
Fig. 5 EIS test results at three different temperatures: (a) 250C, (b) 00C and
(c) shows increase of Rd with external pressure.
C. EIS test
EIS has the potential to give insight into the cause of the impedance rise. Impedance rise originating from different phenomenon are separated by their different time constant [9-11]. By analyzing the impedance spectrum in Nyquist representation the root cause can be identified. However, for simplicity in this study two simple parameters are used to analyze the data. The first parameter is R0, which is the point
on the ‘x’ axis where the impedance spectrum crosses the axis. It is commonly referred to as the pure ohomic resistance of the cell [9]. The second parameter is Rd, the real part of the
[image:5.612.311.551.52.533.2]the total resistance of the cell as it incorporates pure ohomic resistance and electrochemical impedances.
Fig. 5(a) and (b) shows Nyquist representation of the cell under four different pressure conditions at 250C and 00C. As,
the external pressure increases, R0 does not change with
external pressure at a certain temperature. The change of R0
between fig. 5 (a) and (b) is due to change in temperature [9, 10]. However, total resistance Rd increases, as external
pressure increases at both temperatures tested. This indicates external pressure changes the bulk transport properties of active materials of the cell [9]. Rd is plotted against the
external pressure in fig. 5 (c). It has a linear relationship with external pressure. However, 0.2 bar shows less impedance rise compare to linear estimate, which would explain why 0.2 bar pressure perform better in fig. 2.
IV. CONCLUSION
In this study, an experimental test rig has been designed and built that allows the systematic investigation of the cell electrical performance for different applied pressures. The findings have been presented for commercially available NMC based 25Ah lithium-ion cells. External pressure affects the capacity and voltage of a cell in the temperature range 0-450C. Increased pressure lowers the cell voltage during
discharge and increases it during charge. Increased pressure also lowers the cell capacity.
The impedance rise with applied pressure is most noticeable for the highest external pressure applied. The impedance rise indicates change of bulk transport properties of active materials, as the R0 remains constant with applied
pressure.
From this research it is clear that cells generally have higher capacity and power capability when there is no external pressure applied. However, applying a little pressure is expected to extend the lifetime of the cell; this needs further investigation. In this case there will be a tradeoff between initial performance loss and lifetime of a battery pack.
The research findings presented in this paper focused on the NMC based li-ion batteries although the investigation for other cell chemistries is ongoing. Also, an extensive EIS test is being used for wider SoC and temperature range.
ACKNOWLEDGMENT
This work was supported by the High Value Manufacturing Catapult centre at WMG, University of Warwick. The authors are thankful to all ‘cell work-stream’ members of HVM Catapult for their valuable advice, comments and discussions.
REFERENCES
[1] Secondary lithium-ion cells for the propulsion of electric road vehicles –
Part 1: Performance testing, IEC Standard 62660-1, 2012.
[2] Electrically propelled road vehicles - Test specification for lithium-ion
traction battery packs and systems, in Part 2: High-energy applications, ISO Standard 12405-2, 2012.
[3] Battery Test Manual for Plug-In Hybrid Electric Vehicles, United Sate
Department of Energy, 2010.
[4] C. Peabody, C.B. Arnold, “The role of mechanically induced separator
creep in lithium-ion battery capacity fade”, J. of Power Sources, vol. 196, pp. 8147-8153, 2011.
[5] J. Cannarella, C.B. Arnold, “Stress evoution and capacity fade in
constrained lithium-ion pouch cell”, J. of Power Sources, vol. 226, pp. 149-155, 2013.
[6] J.S. Gnanaraj, Yaron S. Cohen, M.D. Levi, D. Aurbach, “The effect of
pressure on the electroanalytical response of graphite anodes and
LiCoO2 cathodes for Li-ion batteries”, J. of Electroanalytical Chemistry,
vol. 516, pp. 89–102, 2001.
[7] M. S. Wu, T. L. Liao, Y. Y. Wang, and C. C. Wan, “Assessment of the
wettability of porous electrodes for lithium-ion batteries” J. Appl. Electrochem. Vol. 34, pp. 797-805, 2004.
[8] Y. Zhang, C. Y. Wang, X. Tang, “Cycling degradation of an automotive
LiFePO4 lithium-ion battery”, J. of Power Sources, vol. 196, pp.
1513-1520, 2011.
[9] Waag, W., S. Käbitz, and D.U. Sauer, “Experimental investigation of
the lithium-ion battery impedance characteristic at various conditions and aging states and its influence on the application”. Applied Energy, vol. 102(0), pp. 885-897, 2013.
[10] T. Momma, M. Matsunaga, D. Mukoyama, T. Osaka, “Ac impedance
analysis of lithium ion battery under temperature control”, J. of Power Sources, vol. 216(0), pp. 304-307, 2012.
[11] H.M. Cho, Y.J. Park, H.C. Shin, “Semiempirical Analysis of