561
Removal of Cu
2+from Aqueous Solution using Fly Ash
Jinjing Luo*, Huazhen Shen, Hanna Markström, Zhongye Wang, Qiang Niu
Environment Science Research Center, Xiamen Univeristy, China
*Corresponding Author: [email protected]
ABSTRACT
This research aims at investigating the utilization of fly ash as a low-cost adsorbent to
remove copper ions from aqueous solutions such as wastewater. Fly ash dosage as well as
initial copper ion concentration,temperature and pH value were varied to find the optimum
conditions for Cu2+ adsorption by fly ash. The results from sorption process showed that the
maximum adsorption rate was obtained at 50 mg/L when different dosage of fly ash was
added into the solution, and it could be concluded that decreasing the initial concentration of
copper ion is beneficial to the adsorption ability of fly ash. With the increase of pH value, the
removal rate increased. When pH was 6, the removal rate reached the maximum of 99.60%.
When initial copper content was 50 mg/L, pH value was 6, the adsorption capacity of fly ash
sample reached 0.98 mg/mg. The main removal mechanisms were assumed to be the
adsorption at the surface of the fly ash together with the precipitation from the solution.
Keywords: Fly ash; Mercury; Adsorption; Copper
1. INTRODUCTION
ash has been as an additive to cement concrete and other building materials, also as soil amendments. As the amount of fly ash increases, there is a need to develop alternative uses of fly ash.
This study aims at investigating the utilization of fly ash as an adsorbent to remove copper ions from aqueous solution, such as wastewater. Fly ash is strong alkali material, and its pH value normally varied from 10 to 13 when added to water. Thereby, it can be expected that copper ions can be removed from aqueous solutions by precipitation or electrostatic adsorption [1]. As a matter of fact, a number of studies were undertaken to verify the influence of fly ash in the removal of heavy metal ions from aqueous solutions [2-6]. However, the results appeared to less comprehensive, and more practical factors should be chose to test the effectiveness of fly ash to remove copper ions from aqueous solution.
In this work, batch experiments were designed for the sorption process, and the effects of temperature, pH value, initial concentrations of copper ions and fly ash dosages on adsorption were evaluated. The optimum condition was also discussed for copper ions removal.
2. MATERIAL AND METHOD
2.1 Chemicals and Instruments
Fly ash samples from a thermo-electric power plant in Xiamen, China was sieved, and the particle size that less than 100 mesh was collected and dried at 105°C. Cu(NO3)2 was used to
prepare for copper ions solution. Reagents used in the experiments were 40% (NH4)3C6H5O7
solution, 0.2% Cl4H22N4O2 solution (BCO-solution) and ammonia-ammonium chloride buffer
solution with pH value of 9. Other chemicals used were C2H6O, C2H4O, HCl, NH3 and
MilliQ-water.
The instruments used in the experiments were Sartorius BS223S electric balance, Sartorius TE6101-L electric balance, DHG-9036A heating & drying oven, 510 pH/Ion/mV Meter, SKY-2102C rocking incubator, DL-5C centrifuge, thermostatic water bath, suction filtration equipment and UV-9200 ultraviolet and visible spectrophotometer.
2.2 Experimental Method
2.2.1 Characteristics of fly ash samples
Cu(40kV,30mA); scan scale: 2θ=10~90°.
MALVERN MS2000 laser particle size analyzer (Malvern Instruments, UK) was used to analyze the particle size of fly ash samples.
2.2.2 Calibration curve and spectrophotometric method
25 ml aqueous solutions containing 0, 0.1, 0.2, 0.4, 0.8 and 1.2 mg/L of Cu2+ were added to
colorimetric cylinder flasks. 2 ml of 40% (NH4)3C6H5O7 solution was added to each flask and
pH was adjusted to 9 with ammonia solution. 5 ml ammonia-ammonium chloride buffer solution was added and the flasks were shaken before adding 5 ml of 0.2% Cl4H22N4O2
solution (BCO-solution). 1 ml C2H4O was added and then adding MilliQ-water to 50 ml and
the flasks were shaken. After this, they were put into a water bath in 50°C for 10 min. When cooled to room temperature the spectrophotometer was used to measure copper concentrations in the solution at the wavelength of 546 nm.
2.2.3 Effect of initial Cu2+ concentration
25 ml aqueous solutions containing 5, 10, 50, 100, 200, 300 and 400 mg/L Cu2+ were added to 250 ml conical flasks, and added Milli-Q water to 60ml. 1.2 g of fly ash was added and the pH-value was adjusted to 6. After 1 h shaking in the rocking incubator, at room temperature with a speed of 150 r/min, the fly ash was separated from the solution by suction filtration and the Cu2+ residue in the solution was measured in the spectrophotometer (method described above).
2.2.4 Effect of fly ash dosage
25 ml aqueous solution containing 50 mg/L Cu2+ were added to 250 ml conical flasks, and added Milli-Q water to 60ml. 0.3, 0.6, 0.9, 1.2, 1.5, 1.8 g and 2.1 g fly ash were added and the pH-value was adjusted to 6. After 1 h shaking in the rocking incubator at room temperature, with a speed of 150 r/min, the fly ash was separated from the solution by suction filtration and the Cu2+ residue in the solution was measured in the spectrophotometer.
2.2.5 Effect of pH
25 ml aqueous solution containing 50 mg/L Cu2+ and 1.2 g fly ash was added to 250 ml
measured in the spectrophotometer.
2.2.6 Effect of Temperature on the Cu2+ removal
25 ml aqueous solution containing 50 mg/L Cu2+ and 1.2 g fly ash was added to 250 ml
conical flasks and the temperature was set at 10, 15, 25, 35, 45, 55 and 65 ℃. After 1 h shaking in the rocking incubator, with a speed of 150 r/min, the fly ash was separated from the solution by suction filtration and the Cu2+ residue in the solution was measured in the
spectrophotometer.
3. RESULTS
3.1 Characteristics of Fly Ash Samples
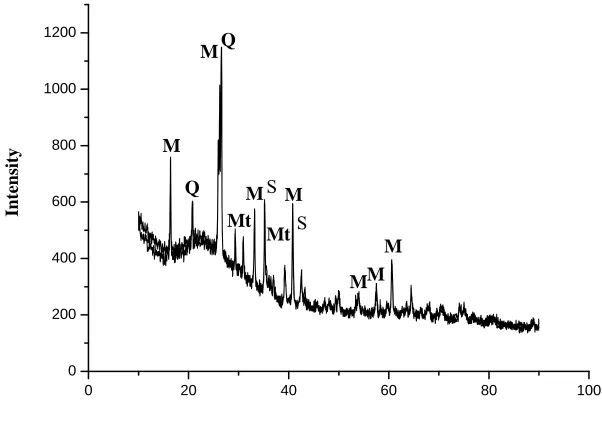
The x-ray diffraction pattern of fly ash samples was illustrated in Figure 1. The XRD results show there is a characteristic diffraction peak at 22~35° (2θmaxCuKα), which means large amount of amorphous glassiness in the fly ash, and Quartz (SiO2) and Mullite (3Al2O3·2SiO2)
are two major crystal-constituents. Besides, there are other mineral compositions, such as magnetite (Fe3O4) and sodalite (3Al2O3·3Na2O·6SiO2·NaCl).
0 20 40 60 80 100
0 200 400 600 800 1000 1200
Mt S
S M
MM M M
Mt Q M
Q
Intensi
ty M
[image:4.612.132.433.396.613.2]M=mullite; Q=quartz; Mt=magnetite; S=sodalite Fig. 1 X-ray diffraction pattern of coal fly ash
μm) is around 2~3%, and clay particle (<2 μm) is around 2%.
Fig. 2Particle size distribution of fly ash
PH value of fly ash sample was measured by 510 pH/Ion/mV meter. 1.2 g fly ash sample was added into 250 mL conical flask and mixed with 60 mL Mili-Q water, before testing the pH. The results show that the pH value of fly ash sample in this study is between 10.00~10.20.
3.2 Calibration Curve
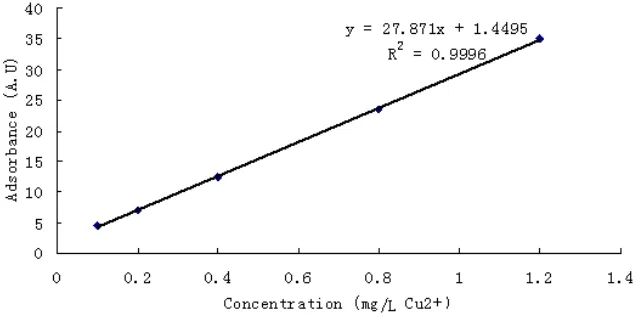
[image:5.612.142.502.106.243.2]Calibration curves made prior to operating UV-9200 ultraviolet and visible spectrophotometer to measure copper ions in the solution to obtain accurate results. Figure 3 presents an example.
Fig. 3 Calibration curve
3.3 Effect of Initial Cu2+ Concentration
[image:5.612.138.457.477.636.2]With the increasing concentration from 5 to 50 mg/L, removal rate of copper ion was increased to 99.52%. While with the copper ion concentration increased from 50 to 400 mg/L, the tendency of removal rate decreased. Meanwhile blank test indicated the removal rate of copper ion dropping with the initial concentration increasing, which represented precipitation trend of copper ions in the solution. In Figure 5 the adsorption performance of the fly ash surface was shown and the maximum adsorption rate was obtained at 50 mg/L. From Fig. 5, it could be concluded that decreasing the initial concentration of copper ion is beneficial to the adsorption ability of fly ash.
0 100 200 300 400
0 10 20 30 40 50 60 70 80 90 100
A B
R
emoval R
a
te
(%)
Copper Concentration(m g/L)
[image:6.612.164.455.225.430.2]A:add fly ash;B:no fly ash
Fig. 4 Effect of initial Cu2+ concentration on the removal of rate with fly ash and without
fly ash
0 100 200 300 400
25 30 35 40 45 50 55
Rem
o
v
a
l R
a
te(%)
Copper Concentration(mg/L)
[image:6.612.178.456.490.689.2]3.4 Effect of Fly Ash Dosage
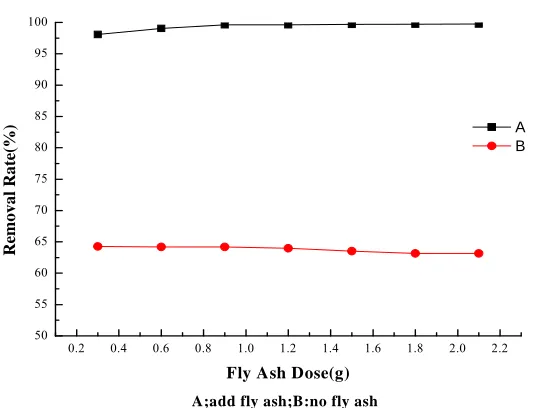
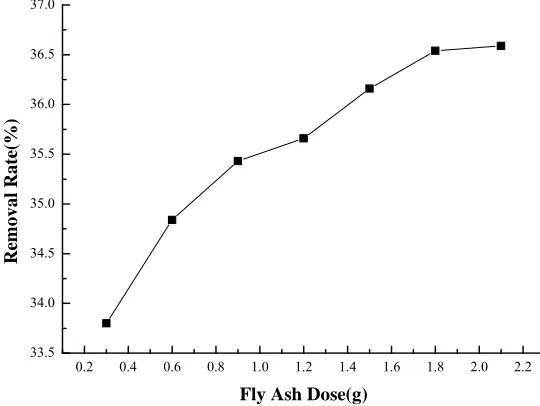
Fig. 6 illustrates the influence of fly ash dosage on the removal rate of copper ion. The removal rate was 98.06% with adding 0.3 g fly ash in the solution, and removal rate increasing with increasing fly ash dosage. The maximum removal rate of 99.75% occurred when 2.1 g fly ash was added into the solution. In this study, since the removal rate was pretty high with even the minimum dosage of fly ash added in the solution, resulted in the ascending trend of adsorption rate was not large enough. Fig 7 showed the adsorption ability of fly ash sample. The adsorption capacity of fly ash is over 0.98 mg/mg. Other researches [7-9] found similar trend of increasing fly ash dosage resulted in increasing the percentage removal of Cu2+.
0.2 0.4 0.6 0.8 1.0 1.2 1.4 1.6 1.8 2.0 2.2 50
55 60 65 70 75 80 85 90 95 100
A B
Rem
o
v
a
l Ra
te(%)
Fly Ash Dose(g)
A;add fly ash;B:no fly ash
Fig. 6Effect of Fly Ash dosage on the removal rate with Fly Ash and without Fly Ash
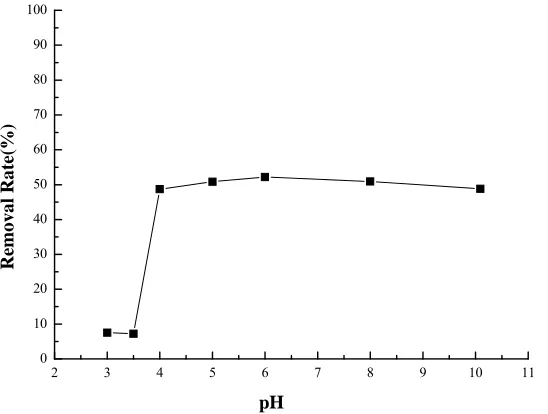
3.5 Effect of pH Value
[image:7.612.175.444.291.495.2]assumed to be the combination of the adsorption at the surface of fly ash together with the precipitation from the solution.
0.2 0.4 0.6 0.8 1.0 1.2 1.4 1.6 1.8 2.0 2.2 33.5
34.0 34.5 35.0 35.5 36.0 36.5 37.0
R
em
o
v
a
l Rate
(%)
[image:8.612.170.440.128.331.2]Fly Ash Dose(g)
Fig. 7 Effect of fly ash dosage on the adsorption rate with fly ash
2 3 4 5 6 7 8 9 10 11
0 10 20 30 40 50 60 70 80 90 100
A B
R
emoval
R
a
te
(%
)
pH
A:add fly ash; B:no fly ash
Fig. 8Effect of pH on the removal rate with and without Fly Ash
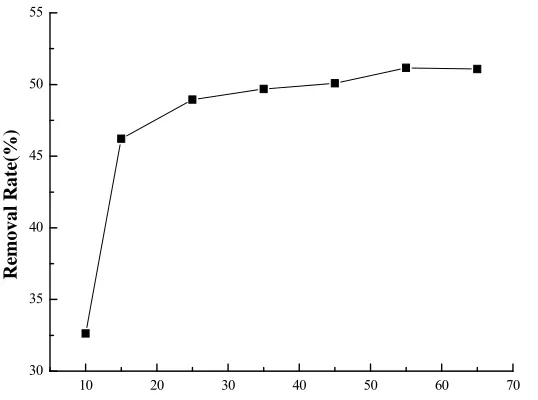
3.6 Effect of Temperature
[image:8.612.163.453.393.612.2]adsorption ability. The removal rate is over 99% when temperature is between 10~65℃. And the adsorption ability of fly ash increased from 32.63% to 51.16% in this temperature range. Based on this result, it could be concluded that for the realistic experiment, room temperature is the best choice for using fly ash to remove copper ion from aqueous solution.
2 3 4 5 6 7 8 9 10 11
0 10 20 30 40 50 60 70 80 90 100
Rem
o
va
l Ra
te(%)
pH
Fig. 9Effect of pH on the adsorption rate of Cu2+ with fly ash
10 20 30 40 50 60 70
0 10 20 30 40 50 60 70 80 90 100
A B
R
emoval R
a
te
(%
)
[image:9.612.173.447.156.363.2]A:add fly ash;B:no fly ash
[image:9.612.146.474.407.632.2]10 20 30 40 50 60 70 30
35 40 45 50 55
R
emoval
R
a
te
(%
)
[image:10.612.176.445.71.271.2]
Fig. 41Effect of temperature on the adsorption rate of Cu2+ using fly ash
4. CONCLUSION
Experimental results showed there was a high removal rate even without adding any fly ash and this removal is probably due to precipitation of Cu(OH)2. This means the removal of
copper ion from solution is the combination of adsorption process and the precipitation phenomena.
Based on the results obtained above, the main chemical composition of fly ash sample tested in this study is SiO2, Al2O3, and Fe3O4, and its pH value is between 10.00~10.20. The particle
size of fly ash is mostly dropped in 5~200 μm. The results from sorption process showed that the maximum adsorption rate was obtained at 50 mg/L when added different dosage of fly ash into the solution. And it could be concluded that decreasing the initial concentration of copper ion is beneficial to the adsorption ability of fly ash. With the increase of pH value, the removal rate showed increased. When pH was 6, the removal rate reached the maximum of 99.60%. When initial copper content was 50 mg/L, pH value was 6, the adsorption capacity of fly ash sample reached 0.98 mg/mg. When temperature was set between 10~65℃, the adsorption ability of fly ash increased from 32.63% to 51.16%.
To sum up, fly ash could be used as an effective adsorbent to remove Cu2+ from aqueous
solutions under the optimal conditions.
REFERENCES
[2] A. Papandreou, C.J. Stournaras, D. Panias, Copper and cadmium adsorption on pellets made from fired coal fly ash, Journal of Hazardous Materials. (2007) 1-10.
[3] S.B. Wang, T. Terdkiatburana, M.O. Tade, Single and co-adsorption of heavy metals and humic acid on fly ash, Separation and Purication Technology. (2007) 1-6.
[4] V.K. Guptaa, I. Ali, Utilisation of bagasse flyash (a sugar industry waste) for the removal of copper and zinc from wastewater, Separation and Purication Technology. 18 (2000) 131-141.
[5] E. Pehlivan, S. Cetin, B.H. Yank, Equilibrium studies for the sorption of zinc and copper from aqueous solutions using sugar beet pulp and fly ash, Journal of Hazardous Materials. B135 (2006) 193-199.
[6] J. Ayala, F. Bianco, P. Garcia, P. Rodriguez, J. Sancho, Asturian fly ash as a heavy metals removal material, Fuel 77 (1998) 1147–1154.
[7] H.A. Elliott, C.M. Denneny, Soil adsorption of cadmium from solutions containing organic ligands, J. Environ. Qual. 11 (1982) 658–663.
[8] M.M. Benjamin, J.O. Leckie, Multiple-site adsorption of Cd, Cu, Zn and Pb on amorphous iron oxyhydroxide, J. Colloid Interface Sci. 79 (1981) 209–221.