DESIGN OF PC SOFTWARE FOR ACFM DATA ACQUISITION SYSTEM BASED ON JAVA
*
Wang Jinglin, Ren Shangkun, Zhang Dan and Yu Tengfei
Key Laboratory of Nondestructive Testing of Ministry of Education, Nanchang Hangkong University,
ARTICLE INFO ABSTRACT
Alternating current filed measurement (ACFM) is an electromagnetic non
technique for detecting defects on metal surfaces and near surfaces. ACFM data acquisition system uses the programmable logic device FPGA and A/D converter to quanti
according to the selection of the work piece to be inspected, and then realizes the data communication between the PC and the hardware through the serial communication mode to complete the acquisition and digitization of the sign
Java+MySQL database platform, and the
development was used to complete the data transmission. The My the target data from data packets, which complete
defect identification and size complete the two
of data acquisition and processing, and the research results are of great significance for the detection and evaluation of surface defects.
Copyright © 2019, Wang Jinglin et al. This is an open distribution, and reproduction in any medium, provided
INTRODUCTION
Alternating Current Filed Measurement technology (ACFM) is an emerging non-destructive testing technology developed on the basis of eddy current and magnetic flux leakage detection (HU, 2012). Since the technology (1) has non
detection, (2) there is no need to clean or only a small amount of paint, coatings and impurities on the metal surface, (3) for metal surface and near surface cracks, one-time qualitative and Quantitative completion, (4) high detection accuracy and high speed. The detection technology has good ap
prospects in various fields such as petrochemical, power engineering and aerospace (Papaelias, 2009).
ACFM technology is that the excitation probe induces a uniform alternating current on the surface of the work
be tested. When there is no defect in the work
from the defect, the induced current on the surface of the work piece is evenly distributed. When the induced current flows through the defect area, the current flows from both sides of the crack. Bypassing the bottom and causing the disturbance of the surface induced current magnetic field, the detection probe acquires the distortion information of the induced magnetic field above the defect and processes the analysis, and the size information describing the defect state can be obtained. In the ACFM data acquisition system, the data acquisition and system control module
ISSN: 0975-833X
Article History:
Received 15th November, 2018 Received in revised form 04th December, 2018 Accepted 20th January, 2019 Published online 28th February, 2019
Citation:Wang Jinglin, Ren Shangkun, Zhang Dan International Journal of Current Research, 11, (02), 1212
Key Words:
Alternating current filed measurement; Data acquisition; Java+MySQL; Size quantification inversion; Testing and evaluation.
*Corresponding author: Wang Jinglin
RESEARCH ARTICLE
DESIGN OF PC SOFTWARE FOR ACFM DATA ACQUISITION SYSTEM BASED ON JAVA
Wang Jinglin, Ren Shangkun, Zhang Dan and Yu Tengfei
Laboratory of Nondestructive Testing of Ministry of Education, Nanchang Hangkong University,
Nanchang 330063, Jiangxi, China
ABSTRACT
Alternating current filed measurement (ACFM) is an electromagnetic non
technique for detecting defects on metal surfaces and near surfaces. ACFM data acquisition system uses the programmable logic device FPGA and A/D converter to quanti
according to the selection of the work piece to be inspected, and then realizes the data communication between the PC and the hardware through the serial communication mode to complete the acquisition and digitization of the signal. In this paper, the upper computer software was developed based on the Java+MySQL database platform, and the serial port communication
development was used to complete the data transmission. The My
the target data from data packets, which completed the data storage and analysis, then realize defect identification and sized quantization inversion function. What
complete the two-dimensional graph drawing of the target data. The software improves the efficiency of data acquisition and processing, and the research results are of great significance for the detection and evaluation of surface defects.
access article distributed under the Creative Commons Attribution the original work is properly cited.
Filed Measurement technology (ACFM) is destructive testing technology developed on the basis of eddy current and magnetic flux leakage detection 2012). Since the technology (1) has non-contact or only a small amount of paint, coatings and impurities on the metal surface, (3) for time qualitative and Quantitative completion, (4) high detection accuracy and high speed. The detection technology has good application prospects in various fields such as petrochemical, power , 2009). The principle of ACFM technology is that the excitation probe induces a uniform alternating current on the surface of the work-piece to ed. When there is no defect in the work-piece or away from the defect, the induced current on the surface of the work-piece is evenly distributed. When the induced current flows through the defect area, the current flows from both sides of sing the bottom and causing the disturbance of the surface induced current magnetic field, the detection probe acquires the distortion information of the induced magnetic field above the defect and processes the analysis, and the size g the defect state can be obtained. In the ACFM data acquisition system, the data acquisition and
collects and digitizes the detection signals received by the ACFM detector, and then performs database storage, analysis, and data display. Therefore, a convenient and efficient human computer interaction software is needed to improve the speed of data collection and processing (M Q LI,
the PC software for different metal work
and the data acquisition, processing and size quantification display functions are completed.
ACFM inspection system design requirements
of the PC software of ACFM data acquisition system is to provide human-computer interaction interface. The software sets the initialization parameters according to the user
instructions, sends the commands to the lower computer through the wireless serial communication mode, and the host computer software analyzes the data received from the serial port. After that, it is saved to the database in turn, and the data in the database is analyzed, and the parsed data is drawn to obtain a two-dimensional graph for real
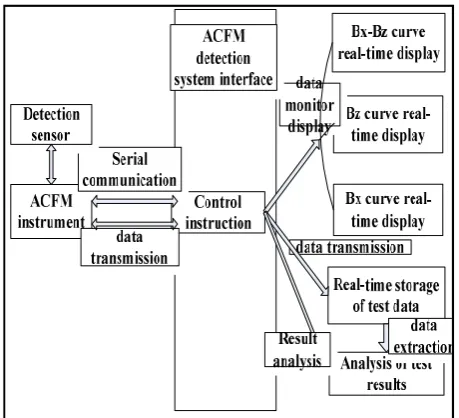
the detected work-piece. The overall structure of the ACFM detection system is shown in Fig 1.
Among them, the main functions of the PC software include:
Data communication: According to the type of the work
piece to be inspected, the communication parameters are set to International Journal of Current Research
Vol. 11, Issue, 02, pp.1212-1216, February, 2019
DOI: https://doi.org/10.24941/ijcr.33995.02.2019
Wang Jinglin, Ren Shangkun, Zhang Dan and Yu Tengfei, 2019. “Design of pc software for acfm data acquisition system based on java 1212-1216.
Available online at http://www.journalcra.com
z
DESIGN OF PC SOFTWARE FOR ACFM DATA ACQUISITION SYSTEM BASED ON JAVA
Wang Jinglin, Ren Shangkun, Zhang Dan and Yu Tengfei
Laboratory of Nondestructive Testing of Ministry of Education, Nanchang Hangkong University,
Alternating current filed measurement (ACFM) is an electromagnetic non-destructive testing technique for detecting defects on metal surfaces and near surfaces. ACFM data acquisition system uses the programmable logic device FPGA and A/D converter to quantize and control the signals according to the selection of the work piece to be inspected, and then realizes the data communication between the PC and the hardware through the serial communication mode to complete the acquisition In this paper, the upper computer software was developed based on the serial port communication Serial Tool relying on development was used to complete the data transmission. The My SQL database was used to extract the data storage and analysis, then realized the What’s more, Jfrerchart was used to . The software improves the efficiency of data acquisition and processing, and the research results are of great significance for the detection
License, which permits unrestricted use,
collects and digitizes the detection signals received by the ACFM detector, and then performs database storage, analysis, display. Therefore, a convenient and efficient human-computer interaction software is needed to improve the speed of data collection and processing (M Q LI, 2017). In this paper, the PC software for different metal work-pieces is designed, uisition, processing and size quantification display functions are completed.
ACFM inspection system design requirements: The function
of the PC software of ACFM data acquisition system is to computer interaction interface. The software the initialization parameters according to the user-defined instructions, sends the commands to the lower computer through the wireless serial communication mode, and the host computer software analyzes the data received from the serial it is saved to the database in turn, and the data in the database is analyzed, and the parsed data is drawn to dimensional graph for real-time discrimination of piece. The overall structure of the ACFM
wn in Fig 1.
Among them, the main functions of the PC software include:
According to the type of the work-piece to be inspected, the communication parameters are set to
INTERNATIONAL JOURNAL OF CURRENT RESEARCH
Fig. 1. Overall structure of the inspection system
Fig. 2. PC software design flow chart
realize the serial communication with the data management unit of the lower computer ACFM detector, including the task of transmitting and receiving data packets.
Data processing: Parsing the data packets received from the
lower computer, extracting the Bx and Bz data, and converting the format. Data preservation and defect size quantification inversion. The formatted Bx and Bz data are stored in the database, and the saved data is analyzed to realize defect identification and size quantification inversion.
Data two-dimensional curve drawing: According to the
analyzed data, the Bx-time graph, the Bz-time graph and the Bx-Bz graph are drawn together with the coordinate information to realize real-time discrimination of the surface defects of the work-piece to be inspected.
PC software design: The Java-based ACFM data acquisition
system PC software is based on the Java+MySQL database software development platform and runs on the window7 operating system.
Because of its openness, platform independence and rich API functions, Java combines the efficient performance of MySQL database data processing, making it an ideal software development platform. Based on the Java class library itself, the user can build the operation panel and display panel by means of custom or built-in dialog. The design process of the host computer software is shown in Fig 2.
Serial communication and packet parsing
Serial Communication: Serial communication is widely used
in the embedded field. Usually, the host computer software and the lower device need serial communication (CHEN, 2016). There is no specific serial port control class in Java, but Sun has released a dedicated serial communication API that provides generic API: comm.jar, win32com.dll, and javax. comm. properties. Among them, Java reads and writes serial port process mainly to call the API function in the javax. comm package.
The design of the serial communication tool mainly includes five function modules for finding all available serial ports, opening the serial port, closing the serial port, sending data to the serial port, and reading data from the serial port. Before performing serial communication, set the properties: serial port number, baud rate, data bit, parity bit and stop bit. Among them, the communication baud rate is set to 115200bps, the
data bit is 8 bits, and the start bit and stop bit are set to 1 bit (XIA, 2017). The key to the design of serial communication
software is to adopt single-case design mode to ensure that there is only one instance of serial communication class, and it can instantiate this instance to the whole system, which can effectively avoid one communication port being called simultaneously by two requests and causes data communication to fail. The serial communication single-case software design mode is implemented by using an internal class, which can achieve delay loading or synchronization keyword synchronization, which is a relatively complete implementation mechanism.
Packet Parsing: The PC software and the lower computer
detector realize the data communication between the two through the serial communication mode (DING 2012). The lower computer ACFM detector sends the data in the form of data packet to the upper computer software. The data packet format is: FF FF FF XX XX XX XX 77 77, each byte in the packet is a hexadecimal number. Among them, the first three bytes are used as frame start data, the fourth to seventh bytes are used as Bx and Bz detection data, and the eighth and ninth bytes are used as terminator data. The data packet format is shown in Table 1. The host computer software receives the hexadecimal data packet and stores the data packet data in the form of a string, storing 9 bytes of data at a time. According to the format of the data packet, the valid data information of the fourth to seventh bytes is parsed and converted into decimal data, and the effective decimal numbers are respectively defined by Bx and Bz. The valid valid decimal numbers Bx and Bz are used for database storage and 2D graph drawing.
Table 1. Data frame format
Data frame header Bx detection data Bz detection data terminator FF FF FF High eight low eight low eight high eight 77 77
//=================================
public static String read From Port (Serial Port serial Port) { Input Stream in = null;
byte() bytes = null;
String data Package= null;
in = serial Port. get Input Stream();//Read data from the serial port int bufferlen = in. available();//Get the length of the data in the buffer
while (bufflenth != 0) {
bytes = new byte(9); //Initialize the byte array to the length of the data in the buffer
in. read(bytes);
data Package= Byte Utils. byte Array To Hex String(bytes); //Convert bytes to a string
bufferlen = in. available(); }
//Omit the flow code return data Package; }
//Analytical data Int Bx, Bz; String data="";
data=Serial Tool. read From Port(serial Port);//Used to read data from the serial port
String datasx =data.substring(6, 8);//Parse the collected data separately
String datasxl =data. substring(8, 10); String datasyl =data. substring(10, 12); String datasy =data. substring(12, 14);
Bx= (Integer. parse Int (datasx,16)*256+Integer.parseInt (datasxl, 16));// Analyze Bx data
Bz=Integer. Parse Int (datasy,16)*256+Integer.parse Int (datasyl, 16);//Analyze Bz data
//=================================
Real-time curve drawing: The data acquisition PC display
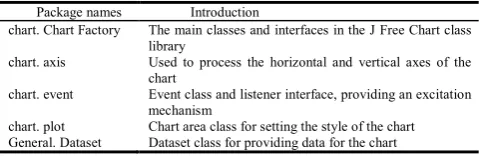
[image:3.595.43.283.720.798.2]interface is the main medium for displaying data display and defect size information (ZHANG, 2018). After parsing the data transmitted by the lower computer, the Bx and Bz data used to draw the real-time curve are extracted, and the purpose of drawing the real-time graph is because the Bx-Bz graph will appear like a butterfly when there is a crack on the surface of the work-piece to be inspected. The graph is called a butterfly diagram in engineering applications. The butterfly pattern is generated only in the presence of defects on the surface of the work-piece to be inspected, and there is no butterfly pattern in the absence of cracks. At the same time, when there is a defect on the surface of the work-piece to be inspected, the Bx-time graph will show the feature of “groove”, while the Bz-time graph will produce the feature of “peak (valley)-valley (peak) alternating” (An inflection point appears at the edge of the defect). For Java graphics display objects, the best graphics display class library is J Free Chart. J Free Chart consists mainly of two major packages: org. j frec. chart and org. jfree chart. data (ZHU, 2013). The former is related to the graphics itself, and the latter is related to the graphic display data. The specific core packages are shown in Table 2:
Table 2. JFree Chart part of the core package
Package names Introduction
chart. Chart Factory The main classes and interfaces in the J Free Chart class library
chart. axis Used to process the horizontal and vertical axes of the chart
chart. event Event class and listener interface, providing an excitation
mechanism
chart. plot Chart area class for setting the style of the chart
General. Dataset Dataset class for providing data for the chart
The process of drawing a two-dimensional graph of the parsed Bx and Bz data using JFree Chart is: for the Bx-time graph and the Bz-time graph, the parsed Bx and Bz data are collected by Time Series, and then required to construct the graph. The dataset Time Series Collection is stored for Time Series; for Bx-Bz graphs, the parsed Bx and Bz data is collected by XY Series, and then stored in the XY Series by the dataset XY Series Collection required to construct the chart. At the same time, the coordinate axis object format is set accordingly, the plot type of the plot object is created, the chart color is rendered and displayed, the corresponding JFree Chart object is created to indicate the relevant attributes of the chart, and finally the chart is instantiated and outputted in an image file format. The JFree Chart graphic display class library is used to realize the real-time update display of the database data, and the Bx-time curve diagram, the Bz-time curve diagram and the Bx-Bz curve diagram are drawn to determine whether there is a crack on the surface of the work-piece to be inspected in real time (FLI, 2012).
Database real-time preservation and defect size
quantification inversion
Database real-time storage:The MySQL database is small in
size, fast in speed, and free to use at low cost. It is the current open source relational database management system(R G LI, 2011). For the ACFM data acquisition PC software, the core function is to read, parse, process and display the collected data. The MySQL database designed in this PC software is a database system for real-time storage of effective data, journal recording, and size quantification inversion, which is very important for this detection system.
For database operations, first need to connect to the database. There are three ways to implement this connection:
Create a connection for each user and wait until the user has finished accessing the database connection.
Set a static connection variable that all users use.
Use a database connection pool.
Comparing the three connection methods, the (3) connection method has the advantages of resource reuse, faster response, unified management and avoiding database connection leakage, so the database connection is adopted in the design of the upper computer software by means (3). The use of the database connection pool is implemented in C3P0 mode. Configure the C3P0 xml file and write the C3P0Utils utility class to connect and close the database. Through the design of C3P0Utils for database connection storage, create a core class object Query Runner to get the connection, write the SQL statement and perform the save operation, the specific code is as follows:
//=================================
Query Runner qr = new Query Runner (C3P0Utils.get Data Source ());//Get the database connection
String sql = "insert into acfm Data Table values (null,?,?,?)";//Write data save SQL statement
Date now = new Date ();
Simple Date Format date Format = new Simple Date Format ("yyyy-MM-dd HH: mm:ss"); // Easy to modify date format String data Time = date Format1. Format (now1);
Quantitative inversion of defect size:When there is a crack the surface of the work-piece to be inspected, the Bx graph will show the minimum value of the "groove", while the Bz-time graph will produce the pole with the peak (valley) valley (peak) alternating. Big and small points.
identification, it is first necessary to extract the characteristic extreme points in the Bx and Bz detection data in the database. The extraction of the characteristic extreme points can be extracted by extracting three consecutive three data in the Bz detection data, and the extracted data are respectively marked as di-1, di, di+1, for the maximum point, the following relationship exists:
0
0
1 1
i i
i i
d
d
d
d
………
For the minimum value points, the following exists:
0
0
1 1
i i
i i
d
d
d
d
………...
The general relationship (1) and (2) can be used to derive the relation (3):
d
i1
d
i
d
i1
d
i
0
……….The characteristic extremum of the Bz detection database can be easily extracted by the relation (3). For the characteristic extreme value of the Bx detection database, it can also be extracted in this way. When there is a crack on the surface of the detected work-piece, there must be a characteristic extreme point. The identification of the crack can be realized by finding the characteristic extreme point to realize a discriminate marker of the defect identification, and at the same time, combining the two-dimensional graphic design alarm threshold drawn by Bx-Bz to improve the discrimination accuracy, the discriminant is as shown in (4), where (x0 , y
data coordinates at the background value, and (x represents the Bx and Bz data points detected during detection.
R y y x x r
R y y x x r
2 0 1 2 0 1
2 0 1 2 0 1
) ( ) (
) ( ) (
………
By extracting the characteristic extreme value and the two dimensional graphic design alarm threshold drawn by Bx the accuracy of crack recognition can be greatly improved. The calculation formula for the crack length inversion is as shown in (5):
)
(
t
2t
1v
l
……….The basis of the crack length inversion is: when there is a defect on the surface of the work-piece to be inspected, moment between the peaks of the two peaks in the Bz data is the starting moment and the ending moment of the crack appearing, so the speed of the moving of the sensor can be reversed. The length information of the crack.
inversion, the average difference between the background value and the characteristic extreme points at the same depth is recorded as ΔBx.
When there is a crack on piece to be inspected, the Bx-time graph will show the minimum value of the "groove", while the time graph will produce the pole with the peak (valley)-valley (peak) alternating. Big and small points. For crack
it is first necessary to extract the characteristic extreme points in the Bx and Bz detection data in the database. The extraction of the characteristic extreme points can be extracted by extracting three consecutive three data in the Bz nd the extracted data are respectively marked , for the maximum point, the following
………(1)
For the minimum value points, the following relationship
………...(2)
The general relationship (1) and (2) can be used to derive the
……….(3)
extremum of the Bz detection database can be easily extracted by the relation (3). For the characteristic extreme value of the Bx detection database, it can also be extracted in this way. When there is a crack on the surface of re must be a characteristic extreme point. The identification of the crack can be realized by finding the characteristic extreme point to realize a discriminate marker of the defect identification, and at the same time, c design alarm threshold Bz to improve the discrimination accuracy, the , y0) represents the data coordinates at the background value, and (x1, y1) represents the Bx and Bz data points detected during the
………(4)
By extracting the characteristic extreme value and the two-dimensional graphic design alarm threshold drawn by Bx-Bz, the accuracy of crack recognition can be greatly improved.
lculation formula for the crack length inversion is as
……….(5)
The basis of the crack length inversion is: when there is a piece to be inspected, the moment between the peaks of the two peaks in the Bz data is the starting moment and the ending moment of the crack appearing, so the speed of the moving of the sensor can be reversed. The length information of the crack. For depth e difference between the background value and the characteristic extreme points at the same depth is
By fitting the relationship between crack depth and ΔBx amplitude, the approximate fitting curve accords with the functional relationship (6).
3.a Bx-time graph display
3.b Bz-time graph display
3.c Bx-Bz graph display
3.d crack identification and size quantification inversion display
Fig.3. Stainless steel plate defect detection display
By fitting the relationship between crack depth and ΔBx amplitude, the approximate fitting curve accords with the
time graph display
time graph display
Bz graph display
3.d crack identification and size quantification inversion display
e
e
1.3808 . 1 67
. 2
08 . 1
3 . 9 05
. 22 67 .
5
x x
y
………(6)
According to (6), the depth information of the crack can be inverted by the difference ΔBx. This also achieves the inversion of the crack depth.
Test and software testing: In the ACFM data acquisition PC
software test, it is necessary to observe the change of real-time two-dimensional graph and the effectiveness of quantitative inversion of defect size. In the Bx-time graph and the Bz-time graph, the horizontal axis represents the time at which the data was acquired, the vertical axis represents the signal amplitude A/D converted value, and the Bx-Bz graph horizontal and vertical axis represents the Bx and Bz signal amplitudes. The value after A/D conversion. The cuboid artificial length of the butt weld of 304L austenitic stainless steel plate with length, width and depth of 30×0.5×4 (mm), 30×0.5×3 (mm) and 30×0.5×2 (mm) during the test. The test results of the defects are shown in Figure. 3. From the figure, it can be visually observed that there are three eigenvalue changes in the Bx-time graph and the Bz-Bx-time graph, while the Bx-Bz graph has three butterfly graphs, which can be visually judged by three two-dimensional graphs. There are three defects, and the discrimination of the defects and the quantitative inversion information of the crack size can be visually seen from 3.d. Through the test of stainless steel, the ACFM data acquisition software can be used to detect metal surface and near surface defects, and the judgment is fast and accurate.
Conclusion
In this paper, the upper computer software of ACFM data acquisition based on Java is designed for real-time discrimination and quantitative display of metal surface and near-surface cracks of ACFM technology. The design of the upper computer software is realized by Java+MySQL combined programming, which realizes the serial communication, data processing, defect discrimination and defect size quantitative display between the upper computer software and the lower computer ACFM hardware platform.
The PC software provides a user-friendly interface, and the user can know the surface condition of the work-piece in real time through convenient operation. The design of the upper computer software improves the detection speed and efficiency of the surface and near surface defects of the metal test piece.
REFERENCES
Chen YY. 2016. Design and Implementation of Video Monitoring Software based on Qt (D). Zhejiang University of Technology
Ding ZY, Wang XM, Deng JM. 2012. Research of Java_based programming for serial communication (J). Microcomputer and application, 31(13):84-86.
Hu XC. 2012. Research on Key Technologies and Design of Integrated Eddy Current Nondestructive Testing System (D). National University of Defense Technology
Li F., LI R., Wang C. 2012,Application of J Free Chart in the Locomotive Remote Monitoring System (J). Computer system application, 21(6):140-143.
Li MQ. 2017. LAN Ruo ming, ZHAI Guang jie.esign of the ultrasonic data acquisition system based on C# (J), Electronic design engineering, 25(22):190-193
Li RG., Wang J.2011. Application of My SQL database in automatic test systems (J). Journal of Computer Applications,31(2):169-175.
Papaelias MP., Lugg MC., Robertsc, 2009. High-speed inspection of rails using ACFM techniques (J). NDT&E International, 42: 328-335.
Yu X., Xia P. 2017. Design of GUI for ECG monitoring System Based on Qtopia Core (J),Computer system application. 26(5):221–226.
Zhang SW., Zhang L., Ge B. 2018. Design of Automatic Dispensing Hot Cells Control Interface Based on Qt (J). Computer system application. 27(9):52-60.
Zhu HL., Yuan M., Li YW. 2013. Design and Implementation of Remote Monitoring System Based on JAVA Platform (J), Microcomputer Applications, 29(9):40-43.
1216 International Journal of Current Research, Vol. 11, Issue, 02, pp.1212-1216, February, 2019