Evaluation of and Recommendations for Growth References for Very Low
Birth Weight (
<
1500 Grams) Infants in the United States
Bettylou Sherry, PhD, RD; Zuguo Mei, MD, MPH; Laurence Grummer-Strawn, PhD; and William H. Dietz, MD, PhD
ABSTRACT. Objective. To determine the best avail-able growth reference for evaluating the growth status of very low birth weight (VLBW; <1500 g) infants in the United States.
Methods. We evaluated currently available growth references for VLBW infants in studies by Casey (Infant Health and Development Program [IHDP]), Brandt, Gairdner and Pearson, and Babson and Benda. We se-lected the 1 that best met a priori criteria and compared it with the new Centers for Disease Control and Prevention (CDC) growth charts. We evaluated the performance of both the selected VLBW reference and the CDC growth charts for use with VLBW infants by plotting data from 2 external data sets of VLBW infants (from Child Health and Development Studies [CHDS]) and linked the CDC’s Pregnancy Nutrition Surveillance System/Pediat-ric Nutrition Surveillance System Data (PNSS/PedNSS) on both references. Age was adjusted for gestational age in all of the VLBW data set comparisons.
Results. The IHDP reference met the greatest number of our evaluation criteria. The IHDP charts are the most recent, are based on a relatively large sample of VLBW infants in the United States, and are adjusted for gesta-tional age at birth (using the standard of birth at 40 weeks) to account for prematurity. The IHDP VLBW infants, based on corrected postnatal age, compared with the non-VLBW infants included in the new CDC growth charts showed more rapid growth in length-for-age from birth (40 weeks) to 24 months, were nearly equivalent in weight-for-age at birth (40 weeks), yet demonstrated less rapid growth in weight-for-age from 40 weeks to 24 months. The performance evaluation of the IHDP and CDC growth reference based on the 2 external VLBW data sets (CHDS and PNSS/PedNSS) showed that the IHDP charts more closely matched the external data sets in relative position on the graphs and growth patterns for length-for-age, but the CDC growth charts more closely matched the external data sets in the growth pattern for weight-for-length. In weight-for-age, because of the lack of stability in the pattern, we could not determine which reference the external data growth pattern more closely matched.
Conclusions. Our evaluation of growth references for VLBW infants yielded no clear, simple recommendation.
The inconsistencies in the discrepancies across anthropo-metric indices between the 2 external combined VLBW data sets (CHDS and PNSS/PedNSS) and the IHDP ref-erence and the CDC growth charts make it difficult to recommend 1 reference. Therefore, we recommend using either the IHDP reference or the CDC growth charts to evaluate the growth of VLBW infants. The choice of which to use depends on its purpose. The IHDP refer-ence is the best available referrefer-ence for comparisons of the growth of a VLBW infant with those of other VLBW infants. The CDC growth charts allow comparison of the growth of a VLBW infant with that of non-VLBW infants. Pediatrics 2003;111:750 –758; very low birth weight in-fants, growth references, growth status, performance eval-uation.
ABBREVIATIONS. VLBW, very low birth weight; IUGR, intra-uterine growth retardation; CDC, Centers for Disease Control and Prevention; LBW, low birth weight; IHDP, Infant Health and Development Program; CHDS, Child Health and Development Studies; PNSS/PedNSS, Pregnancy Nutrition Surveillance Sys-tem/Pediatric Nutrition Surveillance System.
V
ery low birth weight (VLBW) infants (birthweights of ⱕ1500 g) are a unique, heteroge-neous group with various degrees of prema-turity, intrauterine growth retardation (IUGR), dis-ability, and higher risks for morbidity and mortality than infants with higher birth weights. One impor-tant index used to monitor the overall health of VLBW infants is their growth status. Because the literature suggests that VLBW infants grow differ-ently than higher birth weight infants, VLBW infants were not included in the data used to develop the Centers for Disease Control and Prevention (CDC) growth charts released in May 2000.1–10 Thus, an
appropriate, currently available reference to evaluate the growth of VLBW infants remains a critical need. Ideally, this reference would portray optimal growth for VLBW infants and would exclude infants with IUGR, medical complications, frequent illness, or other conditions that may compromise growth. We need a reference that reflects ideal growth rather than typical growth that may be significantly com-prised by illness. Unfortunately, no such reference exists because it is nearly impossible to find a large sample of VLBW infants without complications or frequent illness that would provide a stable estimate of growth for each age. Consequently, we rely on a reference that may not be appropriate for all VLBW infants in the United States.
Clearly, IUGR, medical complications, frequent
ill-From the Division of Nutrition and Physical Activity, National Center for Chronic Disease Prevention and Health Promotion, Centers for Disease Control and Prevention, Atlanta, Georgia.
Received for publication Jan 18, 2002; accepted Sep 16, 2002.
Reprint requests to (B.S.) Maternal and Child Nutrition Branch, Division of Nutrition and Physical Activity, National Center for Chronic Disease Pre-vention and Health Promotion, Centers for Disease Control and PrePre-vention, Mail Stop K-25, 4770 Buford Hwy, NE, Atlanta, GA 30341-3717. E-mail: [email protected]
ness, and other compromising conditions all can neg-atively affect the growth of VLBW infants. In addi-tion to these negative impacts on growth, social class, the home environment, and maternal punitiveness may affect their growth. The 1958 British birth cohort (National Child Development Study) data demon-strated that white singleton low birth weight (LBW) infants had less catch-up growth in height when they were born to households in which the father’s occu-pation was defined as “partly manual” or “unskilled manual” when compared with white singleton LBW infants whose father’s occupations were classified as “professional” or “intermediate.”11 Other studies
have found that a poorer quality of the home envi-ronment was correlated with the presence of failure to thrive among a cohort of LBW infants12 and less
catch-up growth in the presence of higher levels of maternal punitiveness.13
The changes in medical and nutritional care prac-tices that occurred in the early 1990s may also have affected the growth of VLBW infants. Current stan-dards of care, which include the use of prenatal steroids and prenatal surfactants as well as earlier, more aggressive nutritional therapy, potentially could improve the growth status and affect the pat-terns of growth of these infants.14 –16
The goal of this study was to evaluate the available VLBW growth references and to recommend the best reference to assess the growth of VLBW infants in the United States. As part of our evaluation, we sought current data on the growth of VLBW infants to com-pare current patterns of growth with the best avail-able VLBW infant growth reference.
We evaluated currently available VLBW refer-ences, selected the best one, and compared that ref-erence with the new CDC growth charts to examine the differences between the growth patterns of VLBW infants and those of non-VLBW infants. We then conducted a performance evaluation of these 2 references by comparing the growth patterns found in 2 external data sets for VLBW infants with both
the selected VLBW reference and the CDC growth charts to determine which of the 2 growth references better reflected the growth patterns of VLBW infants.
METHODS
Six VLBW growth references were available: 1) Casey et al1–3
(Infant Health and Development Program [IHDP]), currently dis-tributed by Ross Laboratories); 2) Brandt,4distributed by Milupa;
3) Gairdner and Pearson,5,17–20distributed by Castlemead
Publi-cations; 4) Babson and Benda6,21–23(formerly distributed by Ross
Laboratories); 5) Lubchenco et al7,8and Battaglia and Lubchenco,9
(currently distributed by Mead Johnson Laboratories); and 6) Ehrenkranz et al.24We excluded the Lubchenco et al7,8and
Bat-taglia and Lubchenco9reference from our review because the data
were based on size at birth and do not represent postnatal growth. In addition, these data were collected between 1948 and 1961 and limited to infants born in Denver, CO, a city with a relatively high altitude, which is a known risk factor for LBW25–27and may lead
to higher postnatal energy expenditure. We also excluded the contemporary reference developed by Ehrenkranz et al24because
this reference can be used only up to a postnatal age of 120 days or a maximum of 2000 g in weight, a practical limitation in private clinical practice and public health settings.
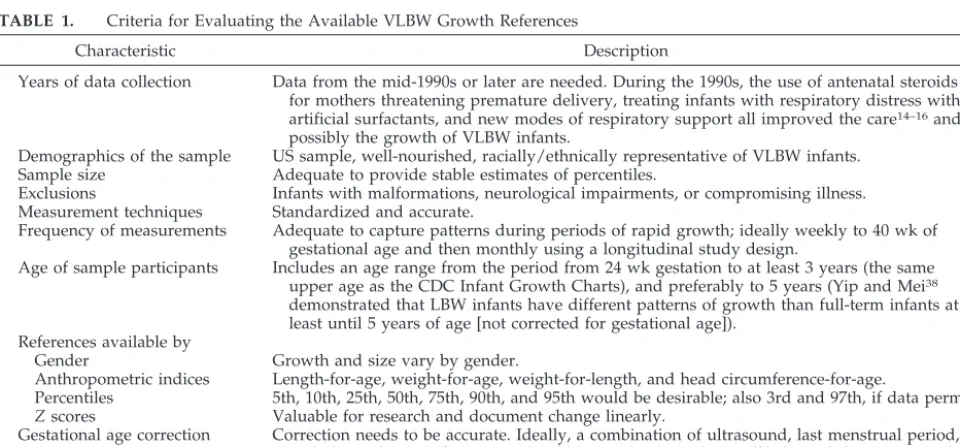
We evaluated the 4 remaining VLBW references against our a priori criteria shown in Table 1. We developed these criteria by focusing on the methods used to create the reference and selected them from key characteristics that we believe would form the basis of an “ideal” VLBW growth reference. The ideal reference should be based on recent, representative, technically accurate measurements. We chose the best available reference on the basis of our a priori criteria.
All of our comparisons are based on age corrected for gesta-tional age. Conceptually, this has to be done and Wang and Sauve28have documented substantial differences in growth status
with and without adjusting for gestational age. We also examined these differences in the IHDP data and found them to be of similar magnitude reported by Wang and Sauve.28In addition, the IHDP
reference is adjusted for gestational age. The length of time that adjustment for gestational age should continue remains uncertain, but our findings indicate at least 2 years and others suggest even longer.28,29
We compared the best available VLBW reference with the CDC growth charts to examine differences in levels and patterns of growth. The CDC growth charts included infants who weigh
⬎1500 g at birth, and age is chronological age.
We used 2 external longitudinal data sets with growth data on VLBW infants to evaluate the performance of the best available VLBW reference and the CDC growth reference for assessing the
TABLE 1. Criteria for Evaluating the Available VLBW Growth References
Characteristic Description
Years of data collection Data from the mid-1990s or later are needed. During the 1990s, the use of antenatal steroids for mothers threatening premature delivery, treating infants with respiratory distress with artificial surfactants, and new modes of respiratory support all improved the care14–16and
possibly the growth of VLBW infants.
Demographics of the sample US sample, well-nourished, racially/ethnically representative of VLBW infants.
Sample size Adequate to provide stable estimates of percentiles.
Exclusions Infants with malformations, neurological impairments, or compromising illness. Measurement techniques Standardized and accurate.
Frequency of measurements Adequate to capture patterns during periods of rapid growth; ideally weekly to 40 wk of gestational age and then monthly using a longitudinal study design.
Age of sample participants Includes an age range from the period from 24 wk gestation to at least 3 years (the same upper age as the CDC Infant Growth Charts), and preferably to 5 years (Yip and Mei38
demonstrated that LBW infants have different patterns of growth than full-term infants at least until 5 years of age [not corrected for gestational age]).
References available by
Gender Growth and size vary by gender.
Anthropometric indices Length-for-age, weight-for-age, weight-for-length, and head circumference-for-age.
Percentiles 5th, 10th, 25th, 50th, 75th, 90th, and 95th would be desirable; also 3rd and 97th, if data permit.
Zscores Valuable for research and document change linearly.
Gestational age correction Correction needs to be accurate. Ideally, a combination of ultrasound, last menstrual period, and physical signs of maturity should be used. Alexander et al34showed that ultrasound is
growth status of VLBW infants. These external data sets were available from the Child Health and Development Studies (CHDS)30 and CDC’s linked Pregnancy Nutrition Surveillance
System/Pediatric Nutrition Surveillance Systems (PNSS/ PedNSS).31,32The CHDS data set included VLBW children who
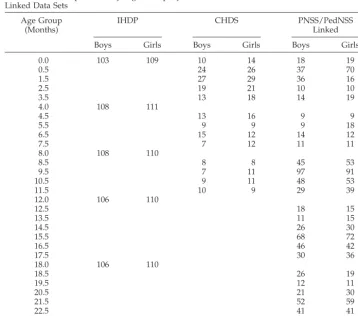
were born in California between 1960 and 1966. Infants selected from these data sets for our analyses had birth weights between 500 g and 1500 g. The CHDS infants were socioeconomically diverse but primarily middle class and of varied racial/ethnic composition; their families were members of the Kaiser Founda-tion Health Plan. The PNSS/PedNSS data included low-income infants and children who participated in publicly funded health and nutrition programs and who were born between 1994 and 1996. The sample sizes in the IHDP reference (the selected best available VLBW reference) and in the 2 external data sets are described in Table 2. Clearly, the external data sets have small sample sizes that will decrease the stability of the percentile val-ues. To increase the sample size and stabilize the percentile values of VLBW infants in these external data sets, we combined the CHDS and the linked PNSS/PedNSS data sets and repeated the comparisons. We compared percentiles in length-for-age, weight-for-age, and weight-for-length from these external data sets with the IHDP reference and with the CDC growth charts. No data on head circumference-for-age were available for the 2 combined external data sets. In both of these external data sets, gestational age was based on calculation of the difference between date of last menstrual period and date of delivery.
RESULTS
On the basis of our evaluation criteria, we found that the IHDP growth reference seemed to be the best available reference for VLBW infants. The IHDP growth reference included infants with birth weights ⱕ1500 g. Compared with the Brandt,4Gairdner and
Pearson,5 and Babson and Benda6 references, the
IHDP data were collected in 1985, whereas the others
were collected from before 1954 to 1975. The IHDP reference was based on the most representative of the population groups with VLBW infants (more blacks, more less-educated mothers), whereas the other available references were based on white in-fants. The IHDP reference had a relatively large sam-ple that ranged from 212 to 219 infants at each mea-surement point and included longitudinal data from 40 weeks’ gestational age. In contrast, the Brandt4
reference was based on sample sizes ofⱕ80 for each category of gestational age, and the Gairdner and Pearson5reference was based on aggregate data with
different indices derived from different data set of different children. The Babson and Benda6reference
was based on birth data from 26 to 40 weeks and longitudinal data from approximately 4000 white children from 1 month to 1 year with no description of frequency of measurement or the sample size at each measurement point. Only the IHDP reference specified exclusions. The IHDP reference data were based on standardized, appropriate measurement techniques as was the Brandt4reference. The IHDP
reference was the only one that included growth charts by gender, desired anthropometric indices, and major percentiles from birth to 36 months of age. The IHDP reference was adjusted for gestational age on the basis of the Ballard score,33whereas the others
were adjusted on the basis of calculation of the dif-ference between the date of last menstrual period and date of delivery.
The other 3 growth references4 – 6had serious
lim-TABLE 2. Sample Sizes by Age Group by Gender for the IHDP, CHDS, and PNSS/PedNSS Linked Data Sets
Age Group (Months)
IHDP CHDS PNSS/PedNSS
Linked
Boys Girls Boys Girls Boys Girls
0.0 103 109 10 14 18 19
0.5 24 26 37 70
1.5 27 29 36 16
2.5 19 21 10 10
3.5 13 18 14 19
4.0 108 111
4.5 13 16 9 9
5.5 9 9 9 18
6.5 15 12 14 12
7.5 7 12 11 11
8.0 108 110
8.5 8 8 45 53
9.5 7 11 97 91
10.5 9 11 48 53
11.5 10 9 29 39
12.0 106 110
12.5 18 15
13.5 11 15
14.5 26 30
15.5 68 72
16.5 46 42
17.5 30 36
18.0 106 110
18.5 26 19
19.5 12 11
20.5 21 30
21.5 52 59
22.5 41 41
23.5 31 30
itations and would not be appropriate for assessing the growth status of VLBW infants. All were based on data collected before 1976. The Brandt4reference
was limited to primarily white, middle- to upper-income German children but had 1 impressive strength: the infants were measured longitudinally at monthly intervals by the same researcher. The earlier Gairdner and Pearson5and Babson and Benda6
ref-erences were based on small sample sizes of aggre-gated data sets of specific indices (eg, different data sets for height and weight), which greatly limited their usefulness.
The IHDP reference also had limitations on the basis of our a priori criteria. Although the IHDP data were the most recent of the available references, they were collected in 1985, before improved and current medical and nutritional treatment protocols14 –16
were widely instituted. Between 32 and 40 weeks of gestational age, the IHDP data were cross-sectional because measurements were taken only at birth: the longitudinal portion of the study began at 40 weeks’ corrected gestational age. In addition, length charts were not available before 40 weeks of gestation, and the 4-month measurement intervals in the first 12 months of life did not fully capture patterns of growth. Gestational age was derived from an abbre-viated assessment of physical and neurologic char-acteristics based on the Ballard score, a simplified Dubowitz scoring system, that may have overesti-mated gestational age.33,34
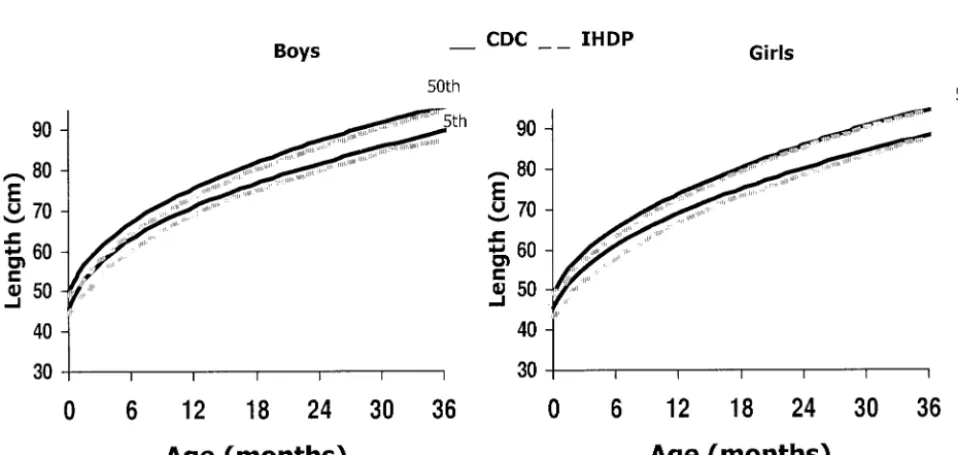
We next compared the IHDP reference with the CDC growth charts to demonstrate the differences between the growth of VLBW infants in the IHDP reference and that of non-VLBW infants. For both boys and girls, the 5th and 50th percentiles for length-for-age in the IHDP reference nearly caught up to those in the CDC reference by 24 months, with the differences at that age being ⬍2 cm (Fig 1). In contrast, the 5th and 50th percentiles for
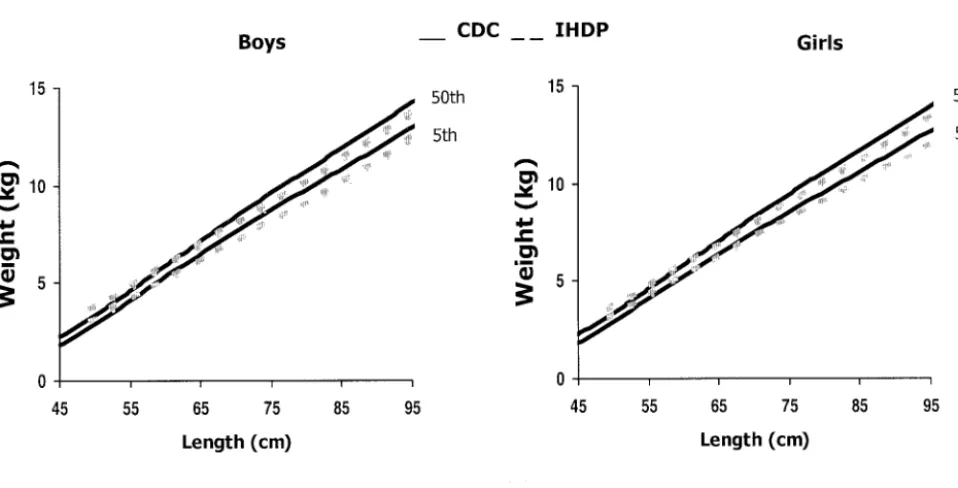
weight-for-age in the IHDP reference are nearly equivalent to those of the CDC reference at birth (40 weeks’ cor-rected gestation), but the IHDP curves increase more slowly (Fig 2). The IHDP 50th percentile is consider-ably below that in the CDC reference at 24 months. The IHDP 50th and 10th (data are not available for the 5th percentile) weight-for-length percentiles (Fig 3) are above the corresponding CDC reference per-centiles until these infants reach approximately 60 cm in length, after which the IHDP percentiles cross over and are below those of the CDC reference. The 2 references are more similar for head circumference-for-age (Fig 4), although the IHDP reference percen-tiles show less rapid growth than the equivalent CDC percentiles until approximately 6 to 12 months, and the IHDP 5th percentile remains below the CDC 5th percentile until 36 months.
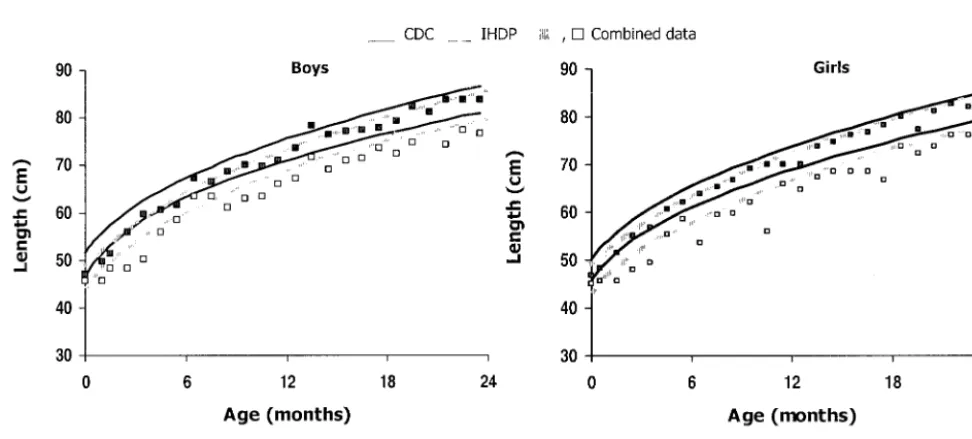
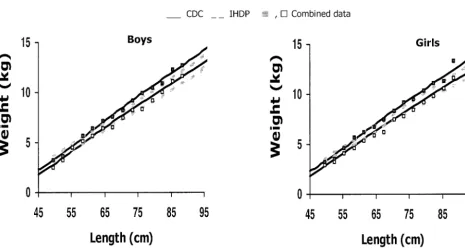
We then compared the 5th and 50th percentiles for length-for-age and weight-for-age and the 10th and 50th percentiles for weight-for-length for the VLBW infants in the 2 combined external (CHDS and PNSS/PedNSS) data sets with those of the IHDP reference and CDC growth charts (Figs 5–7). We made these comparisons to determine whether the size and growth patterns of VLBW infants included in the external data sets more closely approximated those of the infants in the IHDP reference or the CDC growth charts. The length and weight measurements of the VLBW infants included in the 2 combined external data sets more closely matched the relative position on the curves (size of the infants) of the IHDP reference. However, patterns of growth in the external data sets varied by indices as to which ref-erence they more closely matched. The patterns of growth in length-for-age matched those of the IHDP reference (Fig 5). However, the slope of the data for weight-for-age growth is less clear. We do not have a large enough sample in the external data sets to delineate a smooth or stable pattern of growth,
ing it impossible to determine which reference is a better match for this index (Fig 6). In weight-for-length, the growth pattern of the infants in the com-bined additional data sets more closely follows the pattern of the CDC reference (Fig 7). For all of these comparisons, lack of smoothness in the growth pat-terns for the external data sets reflects the small sample sizes.
DISCUSSION
Our evaluation of growth references for VLBW infants yielded no clear, simple recommendation.
The inconsistencies across anthropometric indices between the 2 external combined VLBW data sets (CHDS and PNSS/PedNSS) and the IHDP reference and the CDC growth charts make it difficult to rec-ommend 1 reference. VLBW infants seem to have early, more rapid growth in length-for-age and in head circumference-for-age than non-VLBW infants. We also found that the growth status of the small (low end of their distribution) VLBW infants was below the normal range of the CDC growth charts, ie, between the 5th and 95th percentiles.35Our
con-clusion that the IHDP reference is the best of the Fig 2. Weight-for-age 5th and 50th percentile comparisons of the CDC growth charts and the IHDP VLBW reference.
available references specific to VLBW infants is con-sistent with the Low Birthweight Workshop in 1994.36
Both the CDC and the IHDP references have lim-itations. The CDC growth charts do not include VLBW infants, and age is chronological age, not ad-justed gestational age. However, this lack of adjust-ment will at best have only a minor effect because VLBW infants were excluded from the data set, and the rate of LBW (⬍2500 g) was relatively low (7.6% in 2000).37 The IHDP reference is not based on recent
data. Gestational age may have been estimated inac-curately in the IHDP reference because they esti-mated gestational age using an abbreviated
assess-ment of physical and neurologic characteristics based on the Ballard score, a simplified Dubowitz scoring system.33Alexander et al34showed that the
Ballard score, when compared with gestational age estimated from ultrasonography, overestimated ges-tational age by 2 or more weeks in nearly half of the infants born at 28 to 31 weeks’ gestation. Estimated gestational age based on dates is considered reliable, providing the date of the last menses is considered to be relatively accurate. Estimation of gestational age based on a combination of ultrasound and date of last menstrual period is generally accepted as the most accurate method of assessment. Another limi-Fig 4. Head circumference-for-age 5th and 50th percentile comparisons of the CDC growth charts and the IHDP VLBW reference.
tation of the IHDP reference is that the measure-ments were not taken frequently enough to define the pattern of growth clearly, especially during in-fancy.
The combined external data sets (CHDS and PNSS/PedNSS) that we used for our performance evaluation also had limitations. Both of these data sets had small sample sizes for monthly measure-ments, which lowered the precision of our estimates of growth patterns of these infants. In addition, the CHDS data were collected in the 1960s. Just by virtue of their survival, the CHDS sample of VLBW infants
may have differed substantially from current VLBW infants in the United States and therefore may not represent appropriate growth patterns for contempo-rary VLBW infants.
We recommend using either the IHDP reference or the CDC growth charts to evaluate the growth of VLBW infants. The choice of which to use depends on its purpose. The IHDP reference is appropriate for comparisons of the growth of a VLBW infant with those of other VLBW infants. This reference reflected the level of infant growth and the pattern of infant growth in length for age but not the pattern of Fig 6. Weight-for-age comparison of the combined external data sets (CHDS and PNSS/PedNSS) for VLBW infants with the CDC and IHDP references. Lower lines, 5th percentile; upper lines, 50th percentile.
weight-for-length seen in the combined CHDS and PNSS/PedNSS data sets. The CDC growth charts allow comparison of the growth of a VLBW infant with that of non-VLBW infants. Catch-up growth occurs among VLBW infants, but the growth of VLBW infants does not completely catch up to that of non-VLBW infants1–7 by 36 months. Regardless of
which growth reference is selected, VLBW infants will have to be evaluated with the CDC growth charts after 36 months of age. However, it may be most convenient to change to the CDC growth charts at 24 months of age because after this age, stature instead of length is used to assess growth.
Because the CDC growth charts can be used to compare VLBW infants with non-VLBW infants, public health clinics and/or private practices may decide, for practical reasons, to use only the CDC reference. The CDC growth charts provide a single reference that can be used for assessment through-out childhood (not just until 36 months), and the growth status percentiles and/orzscores are readily accessible on the CDC web site (www.cdc.gov/ growthcharts).
Our findings indicate that additional research is needed to document the growth patterns of VLBW children who receive current treatment protocols. We need to determine whether and how catch-up growth is affected by new clinical practices and to determine whether VLBW infants who are treated with these protocols require a new reference based on current data.
In conclusion, because VLBW infants grow differ-ently than non-VLBW infants, the following caveats should be kept in mind when evaluating the growth status of VLBW infants:
1. Postnatal age should be corrected for gestational age at birth before growth data for VLBW infants are plotted on a reference chart.
2. When the IHDP reference is used, in general, the following differences in growth can be expected: a) the position of VLBW growth data will be within or close to the range of the reference; b) in length-for-age, the pattern of growth will be sim-ilar to the reference; c) in weight-for-age, the pat-tern of growth may be similar to the reference for the 50th percentile and show slightly less growth at the 5th percentile; d) in weight-for-length, ini-tially the VLBW infants may be thinner for their length than the reference, then they will catch up to the reference by 60 cm and then become in-creasingly heavier for their length than the refer-ence.
3. When the CDC growth charts are used, in general, the following differences in growth can be ex-pected: a) the position of VLBW infant data may be in the lower percentiles or below the fifth per-centile of the charts; b) in length-for-age, VLBW infants initially may fall in the lower percentiles but will show catch up to approximate the CDC growth charts; boys will show catch up by ap-proximately 30 months, and girls will show catch up by approximately 18 to 24 months; c) in weight-for-age, VLBW infants may exhibit a
sim-ilar pattern of growth as the reference, yet they will be lighter for their age; d) in weight-for-length, VLBW infants will show similar growth to the CDC growth charts; e) in head circumference-for-age, we did not have comparison external data to evaluate the performance of the IHDP reference and the CDC growth charts; however, the IHDP reference shows catch-up growth toward the CDC growth charts as the infants grow. After 4 months of age, the IHDP reference shows a rapid catch-up to the CDC growth charts, and after 8 to 12 months of age, the head circumference-for-age percentiles of the IHDP infants is similar to those of the CDC growth charts.
ACKNOWLEDGMENTS
We thank Alex F. Roche, MD, PhD; Patrick Casey, MD; Clifford Johnson, PhD; Robert Kuczmarski, PhD; and Cynthia Ogden, PhD, for thoughtful insights and review of this manuscript. We also thank Shumei Guo, PhD, for giving us access to the Infant Health and Development Program data.
REFERENCES
1. Casey PH, Kraemer HC, Bernbaum J, et al. Growth patterns of low birth weight preterm infants: longitudinal analysis of a large, varied sample. J Pediatr.1990;117:298 –307
2. Casey PH, Kraemer HC, Bernbaum J, Yogman MW, Sells JC. Growth status and growth rates of a varied sample of low birth weight, preterm infants: longitudinal cohort from birth to three years of age.J Pediatr. 1991;119:599 – 605
3. Guo SS, Wholihan K, Roche AF, Chumlea WC, Casey PH. Weight-for-length reference data for preterm, low-birth-weight infants.Arch Pediatr Adolesc Med.1996;150:964 –970
4. Brandt I. Growth dynamics of low birth weight infants with emphasis on the perinatal period. In: Falkner F, Tanner JM, eds.Human Growth: 2. Postnatal Growth.New York, NY: Plenum Press; 1978:557– 617 5. Gairdner D, Pearson J. A growth chart for premature and other infants.
Arch Dis Child. 1971;46:783–787
6. Babson SG, Benda GI. Growth graphs for the clinical assessment of infants of varying gestational age.J Pediatr.1976;89:814 – 820 7. Lubchenco LO, Hansman C, Boyd E. Intrauterine growth in length and
head circumference as estimated from live births at gestational ages from 26 – 42 weeks of gestation.Pediatrics.1966;37:793– 800
8. Lubchenco LO, Hansman C, Dressler M, Boyd E. Intrauterine growth as estimated from liveborn birth-weight data at 24 – 42 weeks of gestation. Pediatrics. 1963;32:793– 800
9. Battaglia FC, Lubchenco LO. A practical classification of newborn in-fants by weight and gestational age.J Pediatr.1967;71:159 –163 10. Kuczmarski RJ, Ogden CL, Guo SS, et al. 2000 CDC growth charts for
the United States: methods and development.Vital Health Stat 11.2002 May;(246):1–190
11. Teranishi H, Nakagawa H, Marmot M. Social class difference in catch up growth in a national British cohort.Arch Dis Child.2001;84:218 –221 12. Kelleher KJ, Casey PH, Bradley RH, et al. Risk factors and outcomes for failure to thrive in low birth weight preterm infants.Pediatrics.1993;91: 941–948
13. DeWitt SJ, Sparks JW, Swank PB, Smith K, Denson SE, Landry SH. Physical growth of low birthweight infants in the first year of life: impact of maternal behaviors.Early Hum Dev.1997;47:19 –34 14. Tommiska V, Heinoren K, Ikonen S, et al. A national short-term
fol-low-up study of extremely low birth weight infants born in Finland in 1996 –1997. Pediatrics. 2001;107(1). Available at: www.pediatrics.org/ cgi/content/full/107/1/e2
15. Lemons JA, Bauer CR, Oh W, et al., for the NICHD Neonatal Research Network. Very low birth weight outcomes of the National Institute of Child Health and Human Development Neonatal Research Network, January 1995 through December 1996.Pediatrics. 2001;107(1). Available at: www.pediatrics.org/cgi/content/full/107/1/e1
16. Kleinman RE, ed.Pediatric Nutrition Handbook. 4th ed. Elk Grove Village, IL: American Academy of Pediatrics; 1998
children, 1965, parts I and II.Arch Dis Child. 1966;41:454 – 471, 613– 635 18. Nelson WE. Textbook of Pediatrics. 8th ed. Philadelphia, PA: WB
Saunders; 1964:42
19. Tanner JM, Thomson AM. Standards of birth weight at gestation peri-ods from 32 to 42 weeks, allowing for maternal height and weight.Arch Dis Child.1970;45:566 –569
20. Babson SG. Growth of low-birth-weight infants.J Pediatr.1970;77:11–18 21. Usher R, McLean F. Intrauterine growth of live-born Caucasian infants at sea level: standards obtained from measurements in 7 dimensions of infants born between 25 and 44 weeks of gestation.J Pediatr.1969;74: 901–910
22. Wingerd MA, Schoen EJ, Solomon IL. Growth standards in the first two years of life based on measurements of white and black children in a prepaid health care program.Pediatrics.1971;47:818 – 825
23. McCammon RW. Human Growth and Development. Springfield, IL: Charles C Thomas; 1970
24. Ehrenkranz RA, Younes N, Lemons JA, et al. Longitudinal growth of hospitalized very low birth weight infants.Pediatrics.1999;104:280 –289 25. Yip R. Altitude and birth weight.J Pediatr.1987;111(6 pt 1):869 – 876 26. Moore LG, Armaza F, Villena M, Vargas E. Comparative aspects of
high-altitude adaptation in human populations. Adv Exp Med Biol. 2000;475:45– 62
27. Unger C, Weiser JK, McCullough RE, Keefer S, Moore LG. Altitude, low birth weight, and infant mortality in Colorado. JAMA. 1988;259: 3427–3432
28. Wang Z, Sauve RS. Assessment of postneonatal growth in VLBW infants: selection of growth references and age adjustment for prema-turity.Can J Public Health.1998;89:109 –114
29. Elliman AM, Bryan EM, Elliman AD, Harvey DR. Gestational age correction for height in preterm children to seven years of age.Acta Paediatr.1992;81:836 – 839
30. Data Archive and User’s Manual of the Child Health and Development Studies: User’s Manual. Vols I and II, Version 2.0. Berkeley, CA: School
of Public Health, University of California at Berkeley and Western Consortium for Public Health; 1994
31. Enhanced Pediatric Nutrition Surveillance System User’s Manual. Di-vision of Nutrition, National Center for Chronic Disease Prevention and Health Promotion, Centers for Disease Control and Prevention, Public Health Service, US Department of Health and Human Services; Atlanta, GA, 1994
32. Enhanced Pregnancy Nutrition Surveillance System User’s Manual. Division of Nutrition, National Center for Chronic Disease Prevention and Health Promotion, Centers for Disease Control and Prevention, Public Health Service, US Department of Health and Human Services; Atlanta, GA, 1994
33. Ballard JL, Novak KK, Driver M. A simplified score for assessment of fetal maturation of newly born infants.J Pediatr.1979;95:769 –774 34. Alexander GR, de Caunes F, Hulsey TC, Tompkins ME, Allen M.
Validity of postnatal assessments of gestational age: comparison of the method of Ballard et al. and early ultrasonography.Am J Obstet Gynecol. 1992;166:891– 895
35. WHO Expert Committee on Physical Status. The Use and Interpretation of Anthropometry Physical Status: The Use and Interpretation of Anthropometry: A Report of a WHO Expert Committee. WHO Techni-cal Report Series 854. Geneva, Switzerland: World Health Organization; 1995
36. Roche AF. Executive summary of the Low Birthweight Workshop 1994; October 4 –5, 1994; College Park, MD
37. Martin JA, Hamilton BE, Ventura SJ, Menacker F, Park MM. Births: final data for 2000. National vital statistics reports; vol. 50, no. 5. Hyattsville, MD: National Center for Health Statistics; 2002:104
38. Yip R, Mei Z. Variation of infant and childhood growth: observation from the U.S. nutrition surveillance systems. In: Battaglia F, Falkner F, Garza C, et al, eds.Maternal and Extrauterine Nutritional Factors: Their Influence on Fetal and Infant Growth.Madrid, Spain: Ediciones Ergon, SA, Madrid; 1996:77– 84
KIN AND NON-KIN EFFECTS
“. . . A tiger salamander raised with a group of siblings develops into a small invertebrate-eating creature. But if the salamander is reared in a mixed brood, with nonrelatives, it grows into a larger, cannibalistic beast, with a broad snout and long curved teeth designed for catching and ingesting other tiger salamanders, usually distant relatives. Tadpoles of spadefoot toads undergo similar morphological changes in response to the presence or absence of kin.”
Ackerman J.Chance in the House of Fate. Houghton Mifflin; 2001
DOI: 10.1542/peds.111.4.750
2003;111;750
Pediatrics
Bettylou Sherry, Zuguo Mei, Laurence Grummer-Strawn and William H. Dietz
1500 Grams) Infants in the United States
≤
Weight (
Evaluation of and Recommendations for Growth References for Very Low Birth
Services
Updated Information &
http://pediatrics.aappublications.org/content/111/4/750
including high resolution figures, can be found at:
References
http://pediatrics.aappublications.org/content/111/4/750#BIBL
This article cites 25 articles, 9 of which you can access for free at:
Subspecialty Collections
sub
http://www.aappublications.org/cgi/collection/fetus:newborn_infant_
Fetus/Newborn Infant
following collection(s):
This article, along with others on similar topics, appears in the
Permissions & Licensing
http://www.aappublications.org/site/misc/Permissions.xhtml
in its entirety can be found online at:
Information about reproducing this article in parts (figures, tables) or
Reprints
http://www.aappublications.org/site/misc/reprints.xhtml
DOI: 10.1542/peds.111.4.750
2003;111;750
Pediatrics
Bettylou Sherry, Zuguo Mei, Laurence Grummer-Strawn and William H. Dietz
1500 Grams) Infants in the United States
≤
Weight (
Evaluation of and Recommendations for Growth References for Very Low Birth
http://pediatrics.aappublications.org/content/111/4/750
located on the World Wide Web at:
The online version of this article, along with updated information and services, is
by the American Academy of Pediatrics. All rights reserved. Print ISSN: 1073-0397.