© Author(s) 2008. This work is distributed under the Creative Commons Attribution 3.0 License.
and Earth
System Sciences
Empirical analysis of Japanese flood risk acceptability within
multi-risk context
G. Zhai1,2,3and S. Ikeda4,5
1Laboratory for Urban Disaster and Public Safety, Nanjing University, 22 Hankou Road, Nanjing, 210093, China 2Sino-French Centre for Urban, Regional and Planning Studies, Nanjing University, 22 Hankou Road,
Nanjing, 210093, China
3Department of Urban and Regional Planning, Nanjing University, 22 Hankou Road, Nanjing, 210093, China 4National Research Institute for Earth Science and Disaster Prevention (NIED), 3-1 Tennodai, Tsukuba, Ibaraki 305-0006, Japan
5Emeritus Professor, University of Tsukuba, 1-1 Tennodai, Tsukuba, Ibaraki 305-8573, Japan
Received: 29 May 2008 – Revised: 18 August 2008 – Accepted: 23 August 2008 – Published: 14 October 2008
Abstract. This paper establishes a framework of a multi-risk context for analyzing acceptable risk beyond single-risk con-text and empirically examines how other risks affects flood risk acceptability based on Rational Action Paradigm (RAP) by using a survey conducted in the Toki-Shonai River re-gion of Japan. The main findings obtained by cross-sectional analysis and covariance structure analysis within a multi-risk context can be summarized as follows.
– Nearly half of the respondents accept no flood risk at all.
– Flood risk acceptability depends on not only on the fac-tors of flood risk itself (e.g. frequency, consequence, and characteristics), but also other types of risks involved in our technological society.
– Flood risk acceptability is associated with a multi-risk context. Whether a risk is accepted depends on its per-ceived importance relative to others as well as the bal-ance of its cost and benefit. Providing budget informa-tion and ensuring preparedness for flood risk may also affect the acceptability.
Correspondence to: G. Zhai ([email protected])
1 Introduction
In Japan, about 49% of the population and 75% of real prop-erty are on flood plains, and flooding is currently one of the most serious natural hazards faced by the country. The Tokai Flood in 2000 caused 10 fatalities and 115 injuries. The Niigata-Fukushima Flood on 13 July 2004 resulted in 16 dead or missing victims. Nevertheless, the actual percentage who evacuate (those who go to shelters) during flood disas-ters in Japan is always low, averaging only 26% and being generally less than 40% for the 18 flood evacuations since 1998 (Zhai et al., 2006a). Moreover, even when the evacu-ation is initiated several hours before any dikes break, most residents do not evacuate until just before or just after a dike break, as in the case of the 2004 Niigata-Fukushima Flood (Katada Lab, 2004).
There have been various studies of why people are reluc-tant to evacuate (Perry et al., 1980; Covello et al., 1988; Nigg, 1995). One hypothesis refers to the “invulnerabil-ity syndrome” that influences people’s calculations of poten-tial consequences. Another hypothesis refers to the intrinsic value of property: many people have a strong emotional rela-tionship to their property (Jeager et al., 2001). The hypothe-ses of the reluctance of people to evacuate may imply that acceptable risk (what scale of flood can be deemed accept-able) may be affected not only by the cost-benefit analysis of a given risk itself, but also by that of other risks.
Risk acceptability is usually discussed in terms of rational action theory. Acceptable risk is a compromise between the benefits and costs of exposure to risk (i.e., Starr, 1969; Fis-chhoff et al., 1978; Slovic et al., 1979; Travis et al., 1987;
1050 G. Zhai and S. Ikeda: Japanese flood risk acceptability
1
Preparedness for floods
Flood risk acceptability
Perception of other risks
(earthquake,fire, etc.) Probability /
likelihood Consequence /
damage
Flood risk perception
Flood experience Information on
flood risk
Limited resources (money, information,
knowledge, etc.)
Information on other risks Other risk experience
Individual’s utility maximization
Fig. 1 Framework for analyzing acceptable flood risk within a multi-risk context Fig. 1. Framework for analyzing acceptable flood risk within a
multi-risk context.
EPA, 1988; Lave and Byrd, 1989; Philley, 1992; Pasman, 1993; Fischhoff, 1994, Slovic et al., 1995; Pilgrim, 1999). Chauncey Starr (1969) applied a specific version of Rational Actor Paradigm (RAP) based theory called “revealed prefer-ence” in risk analysis and reported that individuals accept up to three orders of magnitude greater risk for voluntary activi-ties than for involuntary activiactivi-ties because of the perceived benefits. Other research has discussed a number of other factors that may influence the level of risk that stakeholders deem acceptable. These include the certainty and severity of the risk, the reversibility of the effect on public health, the knowledge of or familiarity with the risk, whether the risk is voluntarily accepted or involuntarily imposed, whether indi-viduals are compensated for their exposure to the risk or paid for the risk reduction, the advantages of the risk-affected ac-tivity, the risks and advantages of any alternatives, and the credibility of the risk decision-maker. However, most re-search focuses on one risk or one agent, paying little attention to the relations (trade-offs) between risks or multiple agents. Risks have evolved around us. They range from proximate and local risks like floods and earthquakes to “eco-systemic” risks like global warming, high rising of the sea level and so on; from traditional risks like fires and traffic accidents to risks associated with high technology like air crashes and nuclear power accidents. Because people have limited re-sources of money, information, power, knowledge and so on to deal with risks, they may have to determine which risk reduction measures among those for flood, earthquake, and other disasters should have priority. In other words, there is substitutability among risks. Sometimes, a risk that was once acceptable may become unacceptable due to the changes in other risks. Whether a risk is accepted depends on its per-ceived importance relative to others as well as other factors that have been clarified in previous research.
Concerning flood risk acceptability, however, only a few previous studies exist, and these have focused on either the acceptance criteria or the determinants of acceptance within a single-risk context: the relation between flood risk and its
socioeconomic and engineering factors (e.g., Dantzig, 1956; Turkstra, 1962; Vrijling et al., 1998; USSD, 2002; Vrijling et al., 2004; Motoyoshi et al., 2004; Zhai and Ikeda, 2006; Zhai et al., 2006b). Among the risks confronting us, flood risk is not yet fully understood in terms of how it is perceived and its acceptability from the viewpoint of a trade-off between flood risk and other risks.
Our aim is to make two contributions to risk analysis. The first is to establish a multi-risk context framework for ana-lyzing acceptable risk (here, the chance of flood occurrence) that is based on RAP and constrained by limited resources like money, information, and knowledge. The second is to empirically examine how other risks affect flood risk accept-ability by applying this framework with a survey conducted in the Toki-Shonai River region of Japan. In addition, we dis-cuss how residents perceive the possibility that their homes will be flooded, what level of flood risk they accept, and the relationship between flood risk perception and acceptability. Finally, implications for understanding and managing flood risks and other risks are provided.
2 Method: multi-risk context framework
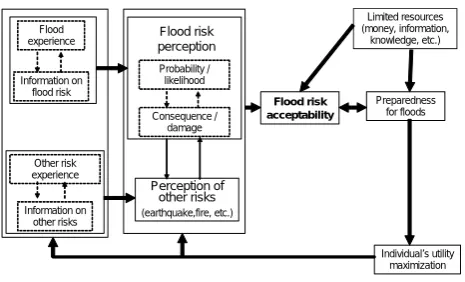
Whether a person accepts a risk depends on such factors as the person’s risk experiences and perceptions, resource lim-itations, personality, and current risk levels. The expected utility theory of economics tells us that whether an individ-ual accepts a risk depends on whether his utility reaches a maximum. Utility refers to the satisfaction or happiness that a person gets from a good or service. The theory is strictly confined to factors directly related to the risk being focused on. The empirical studies mentioned above usually focus on the determinants of a certain risk without taking into account the risk’s relationship with other risks. Various kinds of risks, such as earthquakes, traffic accidents, fires, and disease, exist in our modern society. Because of the limitations of individ-uals’ resources (time, money, etc.), the risk that should be dealt with preferentially depends on its perceived priority or position in a multi-risk context. If an individual perceives that flood risk is severer than other types of risks, he may consider a flood risk to be less acceptable and may devote more attention and resources to reducing this risk than to re-ducing other types of risks. Furthermore, an individual may seek to maximize his utility by reducing either the flood risk or other types of risks under various conditions. Therefore, the trade-off between flood risk perception and perception of other risks may affect the flood risk acceptability.
Figure 1 shows the theoretical framework used in this study for analyzing acceptable flood risk. If the perception of other risks is omitted, the framework becomes a single-risk context similar to those used in previous studies. Within this framework, individuals allocate limited resources to pay-ment for flood risk reduction depending on perceptions and the need for reducing other sources of risk (earthquakes, fire,
G. Zhai and S. Ikeda: Japanese flood risk acceptability 1051
1. Please delete references: Cohen, J. 2001 and Dawes, R. M., 1988.
2. The last reference of Zhai et al. 2006 should be changed to Zhai et al. 2006b.
P1, 1. Introduction
Second para.: “Perry, Greene et al. 1980” should be changed to “Perry et al., 1980” and
“Covello, Slovic et al., 1988” to “Covello et al., 1988”.
P2 first line of left column, “Lave, 1989” should be changed to “Lave and Byrd, 1989”.
P3 Fig.2, Please delete unnecessary three point lines which are due to different PC OS. Originally, they were the words of Nagoya and Tokyo.
Tokyo Osaka Nagoya Tokyo Osaka Nagoya Nagoya Nishi Ward Shinkawa-cho Nishibiwajima-cho S h in k a w a R . S h yo n ai R .
Failure point of embankment
Shonai R iver Toki Rive r Nagoya city Toki city Gifu Pref. Gifu Pref. Aichi Pref. Aichi Pref. N Tokyo Osaka Nagoya Tokyo Osaka Nagoya Nagoya Nishi Ward Shinkawa-cho Nishibiwajima-cho S h in k a w a R . S h yo n ai R .
Failure point of embankment Tokyo Osaka Nagoya Tokyo Osaka Nagoya Nagoya Nishi Ward Shinkawa-cho Nishibiwajima-cho S h in k a w a R . S h yo n ai R .
Failure point of embankment
Shonai R iver Toki Rive r Nagoya city Toki city Gifu Pref. Gifu Pref. Aichi Pref. Aichi Pref. N
Fig. 2 Location of the survey area
P4, Sixth lines from bottom at left side. “Hidano (1999)” should be changed to “Hidano and Kato
(2000)”.
P14 Last two lines, “others” should be changed to “Others” and “none” to “None”.
Fig. 2. Location of the survey area.
etc.), their perceived current flood risk and its consequences, as well as costs that may have already been borne in terms of individual preparedness (emergency supplies like food and water). Given these considerations several variables were identified as measures for each of the components of the hy-pothesized framework.
However, things are usually uneven due to an incomplete market, limited resources and bias. Integrating risk-cost-benefit analysis that shows how much cost or risk-cost-benefit there is for one unit of risk reduction has made the analysis of people’s risk reduction decision making more sophisticated. With the refinement of risk reduction theory and the decrease of risk reduction cost, risk reduction measures that were im-possible in the past may become im-possible in the future, and accordingly, risks considered tolerable in the past may be deemed unacceptable in the future. This may alter the align-ment among the multiple risk coordinates. Therefore, risk ac-ceptability should be discussed beyond a single-risk context. We empirically discuss risk acceptability within a multi-risk context based on RAP.
3 Data
The Toki-Shonai River basin (Fig. 2) was selected as a study area highly representative of Japan. It features a ge-ographically central location, has a diverse landscape, is an intersection of Japanese western and eastern cultures, and experiences a variety of regional flood occurrences. The main stream is 96 km in length. The basin has an area of 1010 square km and is home to about 4 million residents. The upper and lower reaches of the river system are called the Toki River and the Shonai River, respectively. The upper
reach is quite different from the lower reach in terms of not only the natural environment (climate, geographical features) but also the socio-economic conditions (urbanization, popu-lation, and property accumulation).
Disastrous floods frequently occur in the survey area; for example, during the last 50 years, major floods have included the Isewan Typhoon in 1960, Typhoon No. 17 in 1971, floods in 1989 and 1994, and the Tokai Flood in 2000. In particular, the Tokai Flood, which resulted from heavy rainfall with a maximum hourly precipitation of 97 mm and 567 mm of to-tal precipitation, inundated the Tokai area, including the city of Nagoya, home to 2.1 million residents. This storm, re-garded as greater than a 200-year event, caused 10 deaths, major injuries to 20 people, and ¥ 978.3 billion in direct eco-nomic losses. It was one of the most serious flood disasters in Japanese history, according to the statistics of the Ministry of Land, Infrastructure and Transport.
The sewage systems in the region are designed to approx-imately the level of a 5-year internal flood, while the levees and banks are designed to the level of a 100-year flood in Toki city and a 200-year flood in Nagoya city. Because the recurrence of a 100-year flood or a 200-year flood may have been difficult for respondents to understand, the probability of a flood occurring within the next 50 years was also in-cluded in the survey.
A criterion for selecting the survey area was that the re-spondents lived in a watershed area that had experienced flooding and was at risk of serious floods. In addition, many surveys and much research including ours had been imple-mented after the 2000 Tokai flood and the many significant findings that resulted were beneficial for interpreting and ver-ifying our findings. Therefore, Kita ward of Nagoya city, Aichi prefecture, along the lower reach, and Toki city, Gifu
1052 G. Zhai and S. Ikeda: Japanese flood risk acceptability
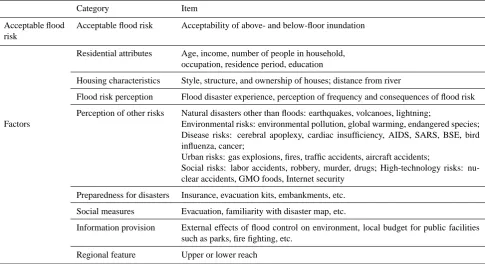
Table 1. Dataset for analysis of acceptable flood risk.
Category Item
Acceptable flood risk
Acceptable flood risk Acceptability of above- and below-floor inundation
Factors
Residential attributes Age, income, number of people in household, occupation, residence period, education
Housing characteristics Style, structure, and ownership of houses; distance from river
Flood risk perception Flood disaster experience, perception of frequency and consequences of flood risk
Perception of other risks Natural disasters other than floods: earthquakes, volcanoes, lightning;
Environmental risks: environmental pollution, global warming, endangered species; Disease risks: cerebral apoplexy, cardiac insufficiency, AIDS, SARS, BSE, bird influenza, cancer;
Urban risks: gas explosions, fires, traffic accidents, aircraft accidents;
Social risks: labor accidents, robbery, murder, drugs; High-technology risks: nu-clear accidents, GMO foods, Internet security
Preparedness for disasters Insurance, evacuation kits, embankments, etc.
Social measures Evacuation, familiarity with disaster map, etc.
Information provision External effects of flood control on environment, local budget for public facilities such as parks, fire fighting, etc.
Regional feature Upper or lower reach
prefecture, along the upper reach were selected as survey ar-eas to examine whether public preferences regarding flood control were different in the two areas.
The survey (Appendix A) was conducted by mail method from the end of March to the beginning of April, 2004. It included questions concerning household characteristics, flood experience, risk perceptions, flood preparedness and so on (Table 1). The 500 households were randomly cho-sen from a commercial phone directory database, Kurofune, 2004 (Datascape and Communications Inc., 2004) for Toki City in Gifu prefecture, and Kita ward, Nagoya City in Aichi prefecture. Of a total of 962 surveys that were validly dis-tributed, 428 (a response rate of 44.5%) were received.
4 Results
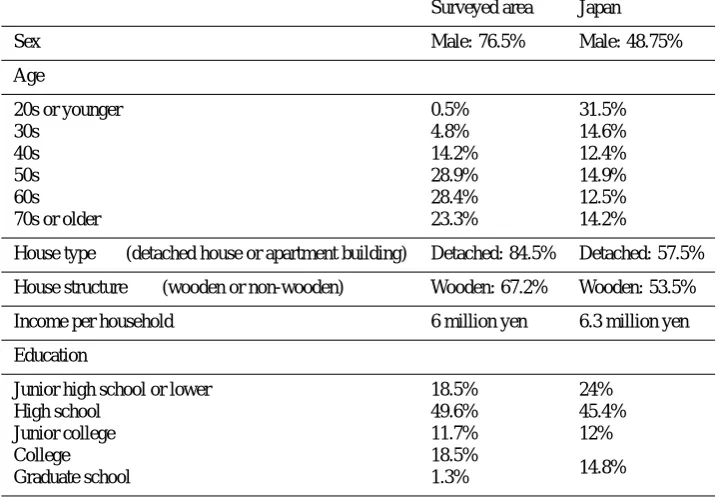
Table 2 shows the demography of the respondents in this questionnaire survey. The sample seems biased in sex and age considering national demographics, but the results are consistent with other survey research on flooding risks in Japan such as by Hidano and Kato (2000) and Motoyoshi et al. (2004). The gender bias in the response rate may re-sult from two factors. Primarily, traditional representatives of households in Japan are males. Secondly, women are less concerned with political events like decision-making on flood control measures than men are.
The age bias may stem from the following two facts. One is that those who are under 30 have less ability to buy a house and show less attention to flood risk. In 1998, 26.75% of Japanese who were under 30 owned private houses but 75.3% of those who were over 40 did. The other possible reason for age bias is that those who retired may have had more spare time to respond to the survey, and therefore the distribution of ages was biased.
Single-family houses accounted for 84.5% of the respon-dents’ dwellings (compared to 57.5% for all of Japan in 1998). Wooden houses totaled 67.2% of the dwellings (53.5% for all of Japan in 1998), and houses with embank-ments composed 13.2% of the total. The survey areas were typical private residential areas, rather than special areas such as college towns or popular tourist sites, which could have impacted the distribution and density of housing.
The average values and distributions of annual income per household and education level in the survey area seemed typ-ical for Japan. Therefore, this sample was not biased due to socioeconomic aspects, though it may have been biased with respect to natural aspects like sex and age.
The lengths of residence in the study area were distributed as follows: less than 10 years for 9.9% of the respondents, 10–20 years for 19.3%, 20–30 years for 21.1%, 30–40 years for 18.3%, 40–50 years for 12.2%, 50–60 years for 9.4%, and more than 60 years for 9.7%.
Table 2. Demography of respondents in this questionnaire survey.
Surveyed area Japan
Sex∗ Male: 76.5% Male: 48.75%
Age∗
20s or younger 0.5% 31.5%
30s 4.8% 14.6%
40s 14.2% 12.4%
50s 28.9% 14.9%
60s 28.4% 12.5%
70s or older 23.3% 14.2%
House type∗∗∗(detached house or apartment building) Detached: 84.5% Detached: 57.5%
House structure∗∗∗(wooden or non-wooden) Wooden: 67.2% Wooden: 53.5%
Income per household 6 million yen 6.3 million yen
Education∗∗
Junior high school or lower 18.5% 24%
High school 49.6% 45.4%
Junior college 11.7% 12%
College 18.5%
14.8%
Graduate school 1.3%
Note:∗refers to the data of all of Japan obtained from 2005 Japanese Population Census (Statistical Bureau 2005),
∗∗from 2000 National Census (Statistical Bureau 2000), and
∗∗∗from 1998 Japanese Census of Housing and Land (Statistical Bureau 1998).
4.1 Perception of the probability of a house flooding in the future
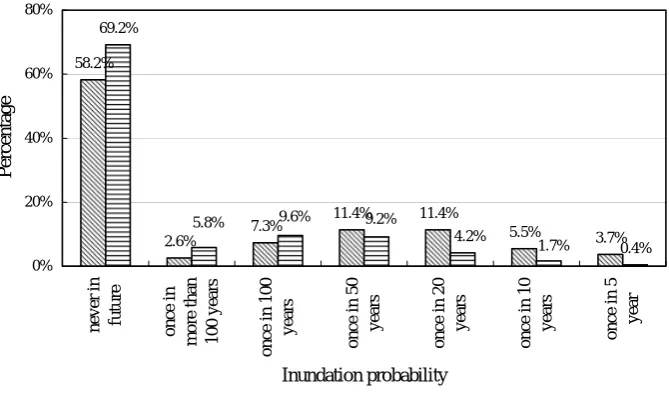
In the survey, two questions dealt with residents’ perception of the probability of their houses flooding in the future. Inun-dation is usually divided into two types: below- and above-floor inundation (Fig. 3). The questions were worded as fol-lows: “How often do you think your house will be flooded below (above) floor in the future? Please choose the most appropriate answer from the choices below. Once in 5 years, 10 years, 20 years, 50 years, 100 years, or more than 100 years; absolutely never; don’t know.” Because the recur-rence of a 100-year flood or a 200-year flood may have been difficult for respondents to understand, the probability of a flood occurring within the next 50 years was also included in the survey. Of 391 and 364 valid responses to the questions of below- and above-floor inundation, respectively, the re-spective percentages of respondents answering “don’t know” were 30% and 34%. If the “don’t know” responses are ex-cluded, the results (Fig. 4) indicate that nearly 60% and 70% of respondents did not correctly perceive the probabilities of below- and above-floor inundation, respectively. Among the group that did correctly perceive the probability of flood-ing, the median below-floor inundation probability was once
3
Water level
Ground level Floor
Above-floor inundation Below-floor inundation Water level
Ground level Floor
Above-floor inundation Below-floor inundation
Fig. 3 Definition of inundation
Fig. 3. Definition of inundation.
in 50 years and once in 20 years (both 11.4%), while the median above-floor inundation probability was once in 100 years (9.6%).
4.2 Acceptable flood probability
Regarding the acceptable flood probability, the survey asked the following question: “What do you think about flood occurrence? Please choose the most appropriate answer from the choices below. A. Without regard to living in a flood-prone area, I accept absolutely no flood occurrence.
1054 G. Zhai and S. Ikeda: Japanese flood risk acceptability
4
58.2%
2.6%
7.3% 11.4% 11.4% 5.5%
3.7% 69.2%
0.4%
5.8% 9.6% 9.2%
4.2%
1.7% 0%
20% 40% 60% 80%
never
in
fu
tu
re
once in
mo
re t
h
an
100 year
s
once in 100
year
s
once in 50
year
s
once in 20
year
s
once in 10
year
s
once in 5
year
Inundation probability
P
er
centage
Below-floor inundation (N=273) Above-floor inundation (N=240)
Fig. 4 Perception of probability of house inundation
Fig. 4. Perception of probability of house inundation.
5
0% 1% 2%
11%
23%
12%
3%
0% 3%
4%
23% 48%
5% 3%
14% 47%
0% 10% 20% 30% 40% 50% 60%
absolutely unallow
a
ble
once in 1000
years
once in 500
years
once in 200
years
once in 100
years
once in 50
years
once in 20
years others
Acceptability of flood occurrence
pe
rc
en
ta
ge
Below-floor inundation (N=238) Above-floor inundation (N=237)
Fig. 5 Distribution of acceptable flood probability
Fig. 5. Distribution of acceptable flood probability.
B. Because I live in a flood-prone area, I have no choice but to accept flood occurrence to some extent. C. Don’t know.” Of 312 valid responses, “absolutely unacceptable,” “acceptable to some extent,” and “don’t know” constituted 37%, 25%, and 38%, respectively. Of the “acceptable to some extent” group, residents accepting below- and above-floor inunda-tion no more frequently than once in 100 years accounted for 88% and 77%, respectively (Fig. 5). The median below-floor inundation acceptability was once in 50 years (23%), while the median above-floor inundation acceptability was once in 100 years (23%).
4.3 Main determinants of the acceptability of flood risk In this section, we first carry out cross-sectional analysis to determine the relationships between the acceptability of flood risk and each possible factor. Then, we discuss the main determinants of the acceptability of flood risk, as ob-tained through covariance structure analysis.
4.3.1 Cross-sectional analysis
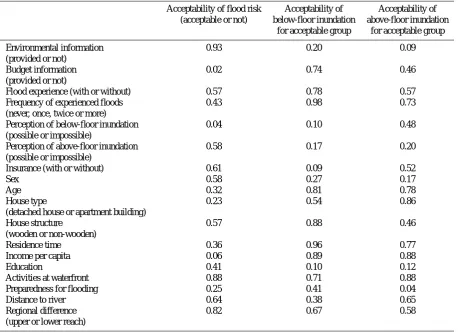
Cross-sectional analysis with SPSS (1999a) can be applied to determine the relationships between the acceptability of flood risk and each of its possible factors through statistical tests. Table 3 summarizes the significance levels of each fac-tor according to a chi-square test. The results show that the
Table 3. Significance levels of main factors according to a chi-squared test.
Acceptability of flood risk Acceptability of Acceptability of (acceptable or not) below-floor inundation above-floor inundation
for acceptable group for acceptable group
Environmental information (provided or not)
0.93 0.20 0.09
Budget information (provided or not)
0.02 0.74 0.46
Flood experience (with or without) 0.57 0.78 0.57
Frequency of experienced floods (never, once, twice or more)
0.43 0.98 0.73
Perception of below-floor inundation (possible or impossible)
0.04 0.10 0.48
Perception of above-floor inundation (possible or impossible)
0.58 0.17 0.20
Insurance (with or without) 0.61 0.09 0.52
Sex 0.58 0.27 0.17
Age 0.32 0.81 0.78
House type
(detached house or apartment building)
0.23 0.54 0.86
House structure
(wooden or non-wooden)
0.57 0.88 0.46
Residence time 0.36 0.96 0.77
Income per capita 0.06 0.89 0.88
Education 0.41 0.10 0.12
Activities at waterfront 0.88 0.71 0.88
Preparedness for flooding 0.25 0.41 0.04
Distance to river 0.64 0.38 0.65
Regional difference (upper or lower reach)
0.82 0.67 0.58
acceptability of flood risk, categorized into acceptable and unacceptable groups, is related to the provision of budget information and the perception of the probability of below-floor inundation at the statistically significant level of 0.05. Income per capita is included at the level of 0.1. If the accept-ability levels for the acceptable group are further analyzed, it is found that at the significance level of 0.05, there is no factor for the acceptability of below-floor inundation, while preparedness for flooding is a factor for the acceptability of above-floor inundation. At the level of 0.1, the perception of the probability of below-floor inundation, insurance, and education are included for the acceptability for below-floor inundation, and the provision of environmental information is a factor for above-floor inundation. No statistical evidence indicates that geographical differences, like the distance to a river and the regional differences between the upper and lower reaches of the basin, affect flood risk acceptability.
Regarding the acceptability of flood risk, respondents pro-vided with budget information had a higher acceptability (proportionally, 18%) than did those who were not provided with such information (Fig. 6). Respondents who perceived
6
47
68 45
33
0% 20% 40% 60% 80% 100%
not provided (N=92) provided (N=101)
Budget information
P
er
cen
ta
g
e
unacceptable acceptable
Fig. 6
Acceptability of inundation and provision of budget information
Fig. 6. Acceptability of inundation and provision of budget.the possibility of inundation may have had a higher accept-ability (proportionally, 17%) than did those who did not per-ceive this possibility (Fig. 7).
1056 G. Zhai and S. Ikeda: Japanese flood risk acceptability
7 42
37 23
41
0% 20% 40% 60% 80% 100%
impossible (N=65) possible (N=78)
Perceived flooding probability of houses
P
er
cent
age
unacceptable acceptable
Fig. 7 Acceptability of inundation and risk perception on below-floor inundationFig. 7. Acceptability of inundation and risk perception on below-floor inundation.
4.3.2 Covariance structure analysis
Covariance structure analysis is an extension of the regres-sion model and is used to test the fit of a correlation ma-trix against two or more causal models being compared (e.g., Krzanowski and Marriott, 1998; Wakui and Wakui, 2003). Utilizing the theoretical framework of Fig. 1, here, we in-troduce an unobserved variable: the flood risk acceptability, consisting of the observed variables of the acceptabilities of above- and below-floor inundation, which are ranked as 0 for never in the future, 1 for less than once in 1000 years, 2 for once in 500 years, 3 for once in 200 years, 4 for once in 100 years, 5 for once in 50 years, and 6 for once in 20 years.
The main determinants of the flood risk acceptability are assumed to be observed and unobserved variables. The observed variables are income per capita, preparedness for flooding (derived from insurance, evacuation kits, embank-ments, etc.), provision of budget information and informa-tion on the environmental effects of flood control, distance to a river, education, and activities at the waterfront. The unob-served variables are flood risk perception and other risk per-ception, which derive from the following unobserved vari-ables, respectively: flood probability and flood consequence perception; and natural disaster risks, environmental risks, disease risks, social risks, urban risks, and high-technology risks.
These unobserved variables are determined by the ob-served variables in the survey. The flood probability percep-tion determines the perceppercep-tions of the probabilities of below-and above-floor inundation (ranked as described above). The flood consequence perception is composed of 12 detailed perceptions of flood consequences, ranked in a range from 0 for “not worried at all” to 10 for “extremely worried,” as follows: building collapse, inundation, damage to roads and bridges, damage to public transport, communication distur-bances, confirmation of family safety, disturbances due to news or rumors, evacuation life, nearness of evacuation sites,
difficulty of preserving drinking water, utility disruptions, and infectious diseases.
Similarly, the other risk perceptions are grouped into 6 types and consist of the perceptions on 25 main risks in the survey, ranked from 0 to 10 as described above. These in-clude non-water-related natural disaster risks, such as earth-quakes, volcanoes, and lightning; environmental risks, such as environmental pollution, global warming, and threats to endangered species; disease risks, such as cerebral apoplexy, cardiac insufficiency, AIDS, SARS, BSE, bird influenza, and cancer; urban risks, such as gas explosions, fires, and traffic accidents; social risks, such as labor accidents, robbery, mur-der, and drugs; and high-technology risks, such as nuclear accidents, the effects of GMO foods on ecology and human health, and Internet security. Water-related natural disaster risks (Typhoons, Storms, River flooding and Landslide) are excluded from the following analysis.
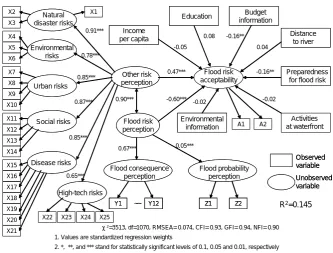
We applied Amos 4.0 for Windows (SPSS Inc., 1999b) to conduct covariance structure analysis on the flood risk ac-ceptability. The results obtained through many modifications are shown below (Fig. 8 and Table 4). The root mean square error of approximation (RMSEA), the comparative fit index (CFI), the goodness-of-fit Index (GFI), and the normed fit index (NFI) are 0.074, 0.93, 0.94, and 0.90, respectively. Furthermore, the chi-square to degree-of-freedom ratio is 3336/1024=3.28. Together, these fit statistics suggest that the model fits the data reasonably well1appears to be supported. The squared multiple correlation of the flood risk acceptabil-ity is 0.145.
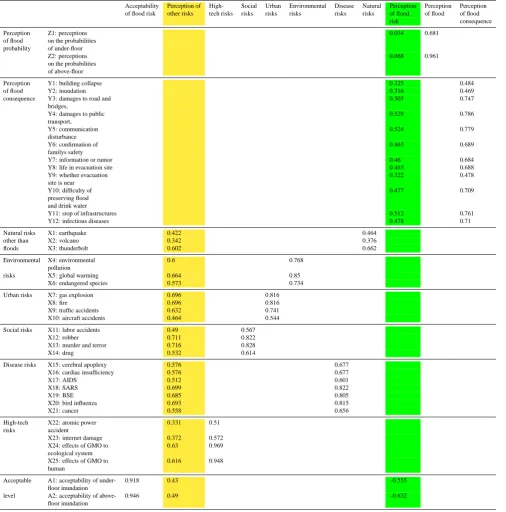
The results of the covariance structure analysis shows that the most important factors for flood risk acceptability are the flood risk perception and the perception of other risks, which have the largest standardized regression weights of the total effects, –0.6 and 0.45, respectively. The significance levels of both probabilities are less than 0.01. The coefficient signs suggest that the severer the flood risk is perceived or the less other risks are recognized, the lower the acceptability of a large chance of flood occurrence becomes, and vice versa. Furthermore, because the standardized regression weight of the flood risk perception to the flood consequence perception (0.67) is much more than that of the flood risk perception to the flood probability perception (0.05), it is reasonable to consider the public flood risk perception to be mainly related to the flood consequence perception. Concerning the percep-tion of other risks, the standardized regression weights of the different risk groups show that natural disaster risks (0.91) play the most important role in the perception of other risks. In order of importance, these risks are as follows: social risks (0.87), disease risks and urban risks (0.85), environmental risks (0.78), and high-technology risks (0.65).
1The magnitudes of the fit statistics should be interpreted in light
of the fact that the individual items were analyzed, rather than multi-item composites that would more closely satisfy the assumption of multivariate normality.
Table 4. Standardized regression weights from covariance structure analysis.
Acceptability Perception of High- Social Urban Environmental Disease Natural Perception Perception Perception of flood risk other risks tech risks risks risks risks risks risks of flood of flood of flood
risk consequence
Perception of flood probability
Z1: perceptions on the probabilities of under-floor
0.034 0.681
Z2: perceptions on the probabilities of above-floor
0.068 0.961
Perception Y1: building collapse 0.325 0.484
of flood Y2: inundation 0.316 0.469
consequence Y3: damages to road and bridges,
0.503 0.747
Y4: damages to public transport,
0.529 0.786
Y5: communication disturbance
0.524 0.779
Y6: confirmation of familys safety
0.463 0.689
Y7: information or rumor 0.46 0.684
Y8: life in evacuation site 0.463 0.688
Y9: whether evacuation site is near
0.322 0.478
Y10: difficulty of preserving flood and drink water
0.477 0.709
Y11: stop of infrastructures 0.512 0.761
Y12: infectious diseases 0.478 0.71
Natural risks X1: earthquake 0.422 0.464
other than X2: volcano 0.342 0.376
floods X3: thunderbolt 0.602 0.662
Environmental X4: environmental pollution
0.6 0.768
risks X5: global warming 0.664 0.85
X6: endangered species 0.573 0.734
Urban risks X7: gas explosion 0.696 0.816
X8: fire 0.696 0.816
X9: traffic accidents 0.632 0.741
X10: aircraft accidents 0.464 0.544
Social risks X11: labor accidents 0.49 0.567
X12: robber 0.711 0.822
X13: murder and terror 0.716 0.828
X14: drug 0.532 0.614
Disease risks X15: cerebral apoplexy 0.576 0.677
X16: cardiac insufficiency 0.576 0.677
X17: AIDS 0.512 0.601
X18: SARS 0.699 0.822
X19: BSE 0.685 0.805
X20: bird influenza 0.693 0.815
X21: cancer 0.558 0.656
High-tech risks
X22: atomic power accident
0.331 0.51
X23: internet damage 0.372 0.572
X24: effects of GMO to ecological system
0.63 0.969
X25: effects of GMO to human
0.616 0.948
Acceptable A1: acceptability of under-floor inundation
0.918 0.43 –0.555
level A2: acceptability of above-floor inundation
0.946 0.49 –0.632
1058 G. Zhai and S. Ikeda: Japanese flood risk acceptability
8
2=3513, df=1070, RMSEA= 0.074, CFI= 0.93, GFI= 0.94, NFI= 0.90
1. Values are standardized regression weights
2. *, **, and *** stand for statistically significant levels of 0.1, 0.05 and 0.01, respectively 3. Natural disaster risks refer to those other than flood risk.
Flood risk acceptability Flood risk perception Flood risk perception Income per capita Income per capita -0.05 -0.02 -0.60*** -0.16** Distance to river Distance to river Other risk perception Other risk perception Environmental information Environmental information Preparedness for flood risk Preparedness
for flood risk 0.04 -0.02 0.47*** 0.90*** Activities at waterfront Education Education 0.08 Budget information Budget information -0.16** Flood consequence perception Flood consequence perception Flood probability perception Flood probability perception Natural disaster risks Natural disaster risks Environmental risks Environmental risks Disease risks Disease risks Social risks Social risks Urban risks Urban risks High-tech risks High-tech risks 0.91*** 0.78*** 0.85*** 0.87*** 0.85*** 0.65*** 0.05*** 0.67***
R2=0.145 Observed variable Unobserved variable Observed variable Unobserved variable X1 X2 X16 X15 X3 X4 X5 X6 X7 X8 X9 X10 X11 X12 X13 X14 X18 X17 X19 Y1 ~~ Y12 Y1 ~~ Y12
X20
X21
X22 X23 X24 X25
Z1 Z2
Z1 Z2
A1 A2
Fig. 8 Empirical model of flood risk acceptance within a multi-risk context
withcovariance structure analysis
Fig. 8. Empirical model of flood risk acceptance within a multi-risk with covariance structure analysis.
In addition, the preparedness for flooding and the provi-sion of budget information impact the flood risk acceptabil-ity to some extent, at the significance level of 0.05. Those who prepare much more for flooding may have lower flood risk acceptability. In other words, those who have a low ac-ceptability of flood risk may prepare much more for floods. Providing more budget information may decrease the flood risk acceptability. This is in accordance with the results of the cross-sectional analysis. Because the standardized re-gression weights are very small, however, at less than 0.1, and the significant probabilities are greater than 0.1, the fac-tors such as distance to a river, activities at the waterfront, income per capita, education, and provision of environmen-tal information seem statistically insignificant with respect to flood risk acceptability.
If we examine the role of each observed variable in flood risk perception and the perception of other risks (Ta-ble 4), then similarly, according to the standardized regres-sion weights of the total effects, we find that the top three sig-nificant factors for flood risk perception are damage to pub-lic transport (0.529), communication disturbances (0.524), and utility disruptions (electricity, water, gas) (0.512), while those for the perception of other risks are murder and terror-ism (0.716), robbery (0.711), and SARS (0.699).
5 Discussion
The analyses of the acceptability of flood risk described above yield some interesting results regarding flood risk management in Japan’s Toki-Shonai River basin. First and foremost, our hypothesis was that the flood risk acceptabil-ity is affected not only by the perception and the factors of flood risk itself, but also by the perception of other risks. This is indeed what was observed. For flood risk percep-tion, flood consequence perceppercep-tion, especially including the perceptions of flood damage to public infrastructure (i.e., transport, communications, electricity, water, gas, roads, and bridges), plays a much greater role than does flood proba-bility perception. This implies that in a highly technological society like Japan, the perception of the loss of public fa-cilities and services due to floods may increase the public acceptability of flood risk. On the other hand, the effects of other types of risks on flood risk acceptability show that the top one-third of perceived risks consists of murder and terror-ism (0.716), robbery (0.711), SARS (0.699), gas explosions (0.696), fires (0.696), bird influenza (0.693), BSE (0.685), and global warming (0.664). All of these have been widely reported and discussed in Japan during recent years, in cases such as the September 11, 2001 terrorist attacks in the US; the frequent occurrence of robbery; and the gas explosions in Mie prefecture, in July, 2003, and in Hokkaido, in Septem-ber, 2003. Though there have been no victims of SARS, bird influenza, or BSE in Japan, the media has offered many
detailed accounts. This may imply that the media can affect public acceptability of flood risk by providing accurate infor-mation on this and other risks. To appropriately understand and manage flood risk in Japan, the following actions are im-portant. The public must be provided with accurate and suf-ficient information on both flood risk and the other risks via all possible tools means like such as TV, newspapers, govern-ment gazettes, workshops, and public symposiums and so on to improve the perception on of risks. In the decision-making process of flood risk reduction, the focus should be extended from the flood risk to all existing major risks to optimize the resource use from a regional or national viewpoint.
Second, in addition to the flood risk perception and the perceptions of other risks, the provision of budget informa-tion and preparedness for flooding may also affect the accept-ability of flood risk, even though the effects are small (both –0.16). In 2002, the budgets per capita of both Nagoya city and Toki city for flood control measures were close to those for fire prevention and emergency services, and for parks and green projects, but much less than those for education (6– 7 times). Flood control and prevention have been usually considered the responsibility of the Japanese Government since the Meiji period (1868–1912), and this is still claimed not only by some politicians but also by the public. As men-tioned above, the study areas have frequently experienced disastrous floods during the last 50 years. Residents might think that the budget (investment) for flood control should be much larger than what was provided in the survey. Thus, pro-viding budget information that is quite different from what people expect may decrease the acceptability of flood risk. Concerning the preparedness for flooding, a similar covari-ance structure analysis on the causal relation between flood risk perception and preparedness shows that the standardized regression weight of flood risk perception to preparedness is 0.341, with a significant probability of 0.027. This suggests that those who prepare much more strongly for flooding may have higher flood risk perception than those do not. On the other hand, geographical factors (such as the distance to a river and regional differences in the river basin), activities at the waterfront, income per capita, education, and provision of environmental information seem statistically insignificant with respect to flood risk acceptability. To appropriately un-derstand and manage flood risk in Japan, administrative in-formation and possible flood risk reduction measures must be disseminated so that the public may know how to allocate their limited public and private resources to what they feel is most urgent.
Third, Japanese have relatively higher acceptability of flood risk than would be expected from their supposed risk-averse nature. Usually, Japanese are said to favor risk aver-sion and even to prefer no risk. According to an international comparative survey conducted by the Japan Consumer
Mar-keting Research Institute (2002) in 2001, when asked, “If you had 1 million yen, would you invest in a financial prod-uct that would return 1.5 million yen with a probability of 50% and 0.5 million yen with a probability of 50%?”, more than 60% of Japanese answered that they did not invest in financial products with any risk. The risk acceptability of Japanese was ranked the lowest among the 10 countries in-vestigated in this survey. Those who did not accept any flood risk accounted for approximately 50% of respondents in our survey, or 10% less than the percentage who accepted no fi-nancial risk. This is consistent with the findings of Nakay-achi (2000). To appropriately understand and manage flood risk in Japan, Japanese risk acceptability must be improved via education, even though it is a very difficult and lengthy learning process because no risk is impossible.
Finally, Figs. 4 and 5 show that 60–70% respondents an-swered that they had no possibility of inundation, and that near 50% replied that they would accept no flood risk at all despite living near a river. This may be related to the “not me” factor noted by Joffe (1999). That is, due to the low probability of natural hazards occurring, some people tend not to consider them problems. This was also observed by Motoyoshi et al. (2004). On the other hand, the percentage of respondents who accepted flood risk was larger than the percentage who may be flooded. As there are obvious differ-ences in risk perception between natural and technological disasters, natural disasters like floods and earthquakes may be mainly considered inevitable, as a risk to be mitigated. This finding also implies that building public risk literacy is very important for appropriately understanding and manag-ing flood risk in Japan.
6 Concluding remarks
We have investigated the acceptability of flood risk and the main factors affecting it by analyzing survey conducted in the Toki-Shonai River region of Japan from the end of March to the beginning of April, 2004. The main findings, obtained by cross-sectional analysis and covariance structure analysis within a multi-risk context, can be summarized as follows.
– Nearly half of respondents answered that they would ac-cept no flood risk at all.
– The flood risk acceptability depends on not only the fac-tors of flood risk itself but also other types of risks in-volved in our technological society.
– Flood risk acceptability should be handled within a multi-risk context. The provision budget information and preparedness for flooding may also affect the ac-ceptability of flood risk.
1060 G. Zhai and S. Ikeda: Japanese flood risk acceptability Some important implications for flood control management can be derived from our findings. First, since flood risk cannot be completely reduced, the fact that nearly half of respondents accepted no flood risk at all implies the necessity and importance communicating with the public about flood risk. Second, in developing flood control plans, public involvement has become an essential procedure in Japan. To achieve good practices in flood risk communication and acceptability, it is very important to provide information not only on flood risk and its associated factors, but also on other types of risks. Finally, a hard and long-term risk literacy building of public becomes very important for appropriately understanding and managing flood risk in Japan.
Appendix A
Survey on flood risk acceptability in Toki-Shonai river region, Japan (paper related questions) A1 We would ask your activities at water front
Q1 How about your activities at water front? (Please check applicable one with◦) 1. Swimming 6. Surfing
2. Fishing 7. Camping
3. Walking 8. Traditional festival 4. Observing nature 9. Dining at restaurant 5. Tennis 10. Others, please fill in:
Q2 How often is your activity at water front? (Please check one and only one) 1. never 3. some times 5. very often
2. a few 4. frequently 6. don’t know Q3 Do you experienced floods?
1. Yes (How many times? Please fill in ) 2. No
Q4 How often do you think your house will be flooded below (above) floor in the future? (Please check one and only one) 1. The probability of below-floor inundation in the future is ( )
2. The probability of above-floor inundation in the future is ( ) 1. Once every 5 years 5. Once every 100 years
Legends 2. Once every 10 years 6. Once every more than100 years 3. Once every 20 years 7. Never
4. Once every 50 years 8. Don’t know
A2 We would like to provide you with some information on flood risk reduction measures
After 2000 Tokai Flood Disaster, emergency response and recovery project were decided to improve the level of flood control, which had the investment of 57 billion yen in total within following 5 years. Even though the large scale project is implemented and may improve the flood prevention level, when a rain is larger than the design level of levees, there is still the possibility of levee collapse like the collapse of Shinkawa-river in 2000 Tokai flood. However, it is fact that flood control project may reduce flood damages. For example, if inundation depth is reduced from 120 cm to 70 cm, the damages to contents and to house may decrease 2.68 million yen/household and 5.8 million yen/household, respectively (Fig. A1). In addition, the deaths and injuries due to floods also can be reduced.
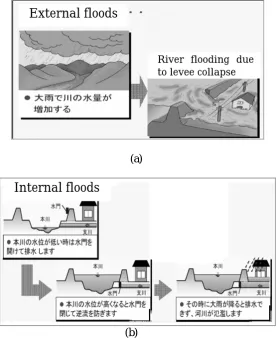
Floods can be divided into external floods and internal floods according to the source of water. External floods refer to the floods due to collapses or overflow of dikes or and dams as a result of rains exceeding those that would be expected on the basis of probability while internal flood to those due to limited sewage and pumping capacity during raining (Fig. A2). The design level of levees in Shonai river is 200 year flood, while the level of sewage system is 5 year floods.
In addition to the structural measures like external and internal flood measures, non-structural measures like early warning system listed below is also very important.
17
216
486 1752
2420
0 500 1000 1500 2000 2500 3000
70cm 120cm
Inundation depth
D
amage (10000
yen/
h
ous
ehol
d)
content damage house damage
1
2
Figure 1 Flood damage and inundation depth
3
4
5
6
7
(A)
8
9
10
(B)
11
Figure 2 Illustration of external and internal floods
12
13
Disaster insurance not only compensates flood damages but also help quick recovery from
14
disasters.
15
Early warning system can reduce the life loss by predicating an imminent flood and warning
16
those in the risk area.
17
Hazard and evacuation map shows the dangerous area and evacuation site and therefore may
18
help people smoothly and efficiently evacuate.
19
River flooding due
to levee collapse
External floods
Internal floods
Fig. A1. Flood damage and inundation depth.17
216
486 1752
2420
0 500 1000 1500 2000 2500 3000
70cm 120cm
Inundation depth
D
amage (10000
yen/
h
ous
ehol
d)
content damage house damage
1
2
Figure 1 Flood damage and inundation depth
3
4
5
6
7
(
a
)
8
9
10
(
b
)
11
Figure 2 Illustration of external and internal floods
12
13
Disaster insurance not only compensates flood damages but also help quick recovery from
14
disasters.
15
Early warning system can reduce the life loss by predicating an imminent flood and warning
16
those in the risk area.
17
Hazard and evacuation map shows the dangerous area and evacuation site and therefore may
18
help people smoothly and efficiently evacuate.
19
River flooding due to levee collapse
External floods
Internal floods
Fig. A2. Illustration of external and internal floods.
1062 G. Zhai and S. Ikeda: Japanese flood risk acceptability – Disaster insurance not only compensates flood damages but also help quick recovery from disasters.
– Early warning system can reduce the life loss by predicating an imminent flood and warning those in the risk area. – Hazard and evacuation map shows the dangerous area and evacuation site and therefore may help people smoothly and
efficiently evacuate.
– Regulation of land use may reduce the economic damages and the deaths and injuries due to floods by restricting the use of dangerous area where floods may occur.
However, expenses are necessary for flood control measures to prevent external flooding, and are ultimately paid by residents. A region may be developed due to population accumulation and the decrease of flood risk by constructing flood control projects like dams and levees. However, in exchange for the flood risk reduction, river environment and ecological system may be degraded(optional in the survey. Treated as environmental information in the study).
Provided that flood control measures take approximately 20 years, we would ask your willingness to pay for the reduction of flood risk. For your references, totaled national and municipal budgets in the fiscal year of 2002, residents in Nagoya city spent approximately 17200 yen per capita on flood control, 10800 yen per capita for fire and ambulance, 9100yen for park improvement and 82800 yen for education (optional in the survey. Treated as budget information in the study).
A3 We would like to ask you about your preparedness for floods
Q5 What is your household preparing for floods? CHECK All APPLICABLE 1. Survival food
2. Survival drink water 3. Hazard map 4. Target tuner/TV 5. Flash lamp
6. Packing valuable contents in case of emergency 7. Conformation of evacuation site
8. Conformation of contact method during flooding 9. Paying attentions to disaster information 10. Preparing shelves for contents in case of floods 11. Flood insurance
12. Asking government to improve the river maintenance 13. Making air conditioner not inundated
14. Elevating the building base 15. Moving to no flood risky area 16. Improving regional communication
17. Making ground floor garage and living room more than first floor
18. Others ( )
19. None
Q6 What do you think about flood occurrence? (Please check one and only one)
1. Without regard to living in a flood-prone area, I accept absolutely no flood occurrence (Go to Q7)
2. Because I live in a flood-prone area, I have no choice but to accept flood occurrence to some extent. (Go to Q6-1) 3. Don’t know (Go to Q7)
Q6-1 Please answer what is your acceptability of below-floor inundation (Please check one and only one) 1. Once for every 20 years 5. Once for every 500 years
2. Once for every 50 years 6. Once for every 1000 years 3. Once for every 100 years 7. Others ( ) 4. Once for every 200 years
Q6-2 Please answer what is your acceptability of above-floor inundation (Please check one and only one) 1. Once for every 20 years 5. Once for every 500 years
2. Once for every 50 years 6. Once for every 1000 years 3. Once for every 100 years 7. Others ( ) 4. Once for every 200 years
Q7 What do you think of flooding and its consequence? Please indicate your worry degree on each item below with 0 for not worried and 10 for very worried. (Please check one and only one)
1. Building collapse 0- - -1- - -2- - -3- - -4- - -5- - -6- - -7- - -8- - -9- - -10 2. Inundation 0- - -1- - -2- - -3- - -4- - -5- - -6- - -7- - -8- - -9- - -10 3. Damages to roads and bridges and the disruption 0- - -1- - -2- - -3- - -4- - -5- - -6- - -7- - -8- - -9- - -10 4. Damages to traffic and the disruption 0- - -1- - -2- - -3- - -4- - -5- - -6- - -7- - -8- - -9- - -10 5. Disruption of communications like telephone 0- - -1- - -2- - -3- - -4- - -5- - -6- - -7- - -8- - -9- - -10 6. Confirmation of family safety 0- - -1- - -2- - -3- - -4- - -5- - -6- - -7- - -8- - -9- - -10 7. Information confusion like rumor 0- - -1- - -2- - -3- - -4- - -5- - -6- - -7- - -8- - -9- - -10 8. Life at evacuation site 0- - -1- - -2- - -3- - -4- - -5- - -6- - -7- - -8- - -9- - -10 9. No evacuation site in the vicinity 0- - -1- - -2- - -3- - -4- - -5- - -6- - -7- - -8- - -9- - -10 10. Assurance of food and drink water 0- - -1- - -2- - -3- - -4- - -5- - -6- - -7- - -8- - -9- - -10 11. Disruption of electricity, water and gas 0- - -1- - -2- - -3- - -4- - -5- - -6- - -7- - -8- - -9- - -10 12. Spread of infectious diseases 0- - -1- - -2- - -3- - -4- - -5- - -6- - -7- - -8- - -9- - -10 13. If you have other items, please indicate and evaluate them 0- - -1- - -2- - -3- - -4- - -5- - -6- - -7- - -8- - -9- - -10 A4 We would like to ask your attitudes to the other risks
Q8 What do you think of the other risks? Please indicate your worry degree on each item below with 0 for not worried and 10 for very worried. (Please check one and only one)
1. Earthquakes 0- - -1- - -2- - -3- - -4- - -5- - -6- - -7- - -8- - -9- - -10 2. Volcanos 0- - -1- - -2- - -3- - -4- - -5- - -6- - -7- - -8- - -9- - -10 3. Typhoons 0- - -1- - -2- - -3- - -4- - -5- - -6- - -7- - -8- - -9- - -10 4. Storms 0- - -1- - -2- - -3- - -4- - -5- - -6- - -7- - -8- - -9- - -10 5. River flooding 0- - -1- - -2- - -3- - -4- - -5- - -6- - -7- - -8- - -9- - -10 6. Landslides 0- - -1- - -2- - -3- - -4- - -5- - -6- - -7- - -8- - -9- - -10 7. Thunderbolts 0- - -1- - -2- - -3- - -4- - -5- - -6- - -7- - -8- - -9- - -10 8. Environmental pollution 0- - -1- - -2- - -3- - -4- - -5- - -6- - -7- - -8- - -9- - -10 9. Global warming 0- - -1- - -2- - -3- - -4- - -5- - -6- - -7- - -8- - -9- - -10 10. Endangered species 0- - -1- - -2- - -3- - -4- - -5- - -6- - -7- - -8- - -9- - -10 11. Cerebral apoplexy 0- - -1- - -2- - -3- - -4- - -5- - -6- - -7- - -8- - -9- - -10 12. Cardiac insufficiency 0- - -1- - -2- - -3- - -4- - -5- - -6- - -7- - -8- - -9- - -10 13. AIDS 0- - -1- - -2- - -3- - -4- - -5- - -6- - -7- - -8- - -9- - -10 14. SARS 0- - -1- - -2- - -3- - -4- - -5- - -6- - -7- - -8- - -9- - -10 15. BSE 0- - -1- - -2- - -3- - -4- - -5- - -6- - -7- - -8- - -9- - -10
1064 G. Zhai and S. Ikeda: Japanese flood risk acceptability 16. Bird influenza 0- - -1- - -2- - -3- - -4- - -5- - -6- - -7- - -8- - -9- - -10
17. Cancer 0- - -1- - -2- - -3- - -4- - -5- - -6- - -7- - -8- - -9- - -10 18. Gas explosion 0- - -1- - -2- - -3- - -4- - -5- - -6- - -7- - -8- - -9- - -10 19. Fire disaster 0- - -1- - -2- - -3- - -4- - -5- - -6- - -7- - -8- - -9- - -10 20. Traffic accident 0- - -1- - -2- - -3- - -4- - -5- - -6- - -7- - -8- - -9- - -10 21. Air accident 0- - -1- - -2- - -3- - -4- - -5- - -6- - -7- - -8- - -9- - -10 22. Labor accident 0- - -1- - -2- - -3- - -4- - -5- - -6- - -7- - -8- - -9- - -10 23. Robber 0- - -1- - -2- - -3- - -4- - -5- - -6- - -7- - -8- - -9- - -10 24. Murder and terror 0- - -1- - -2- - -3- - -4- - -5- - -6- - -7- - -8- - -9- - -10
25. Drug 0- - -1- - -2- - -3- - -4- - -5- - -6- - -7- - -8- - -9- - -10
26. Atomic power accident 0- - -1- - -2- - -3- - -4- - -5- - -6- - -7- - -8- - -9- - -10 27. Internet damage 0- - -1- - -2- - -3- - -4- - -5- - -6- - -7- - -8- - -9- - -10 28. Effects of GMO on ecological system 0- - -1- - -2- - -3- - -4- - -5- - -6- - -7- - -8- - -9- - -10 29. Effects of GMO on human health 0- - -1- - -2- - -3- - -4- - -5- - -6- - -7- - -8- - -9- - -10 30. If you have other items, please indicate and evaluate them 0- - -1- - -2- - -3- - -4- - -5- - -6- - -7- - -8- - -9- - -10
A5 We would like to ask some information on you and the information will only be used for the purpose of the study. Your personal information and answers will be absolutely guaranteed not to be leaked to outside
Q9 Are you. . .
Male Female
Q10 What is your age?
1) 10s, 2) 20s, 3) 30s, 4) 40s, 5) 50s, 6) 60s, 7) more than 70s Q11 How many people, including yourself, live in your household?
Number
Q12 Which of the following best describes your employment status? PLEASE SELECT ONE ONLY 1. Office Worker
2. Governmental Official 3. School Teachers 4. Farmers 5. Self-Employed 6. Student 7. Housewife
8. Unemployed/jobless 9. Other
Q13 For analysis purposes, how much is your total ANNUAL household income before taxes? CHECK ONE ONLY 1. Less than 2 000 000 JPY
2. 2 000 000–4 000 000 3. 4 000 000–6 000 000 4. 6 000 000–8 000 000 5. 8 000 000–10 000 000
6. 10 000 000–12 000 000 7. 12 000 000–14 000 000 8. More Than 14 000 000
Q14 What is the highest level of education that you have completed? CHECK ONE AND ONLY ONE 1. Junior high
2. High school
3. Junior College diploma/degree 4. University undergraduate degree
5. Post graduate university degree (e.g., Masters or Ph.D.)
Q15-1 How about your house type? CHECK ONE AND ONLY ONE 1. Private house and land 4. House provided by employers 2. Private house but rented land 5. Rented multi-family building 3. Rented house 6. Private multi-family building Q15-2 How about your house structure? CHECK ONE AND ONLY ONE
1. Single family house 2. Multi-family mansion
Q15-3 Is your house wooden? CHECK ONE AND ONLY ONE 1. Wooden 2. Non-wooden
Q15-4 Did you begin to live here from your birth? CHECK ONE AND ONLY ONE 1. after the birth 2. Immigrated from other place
Q15-5 How many years have you been here?
Period: years
Q15-6 How far away from a river is your house? CHECK ONE AND ONLY ONE 1. Less than 100 m 5. 2 km∼5 km
2. 100 m∼500 m 6. More than 5 km 3. 500 m∼1 km 7. Don’t know. 4. 1 km∼2 km
Thank you very much!
1066 G. Zhai and S. Ikeda: Japanese flood risk acceptability
Acknowledgements. Authors thank two anonymous referees and Editor Tinti for their valuable comments and suggestions. Any er-rors are the sole responsibility of the authors.
Edited by: S. Tinti
Reviewed by: two anonymous referees
References
Covello, V. T., Slovic, P., and von Winterfeldt D.: Disaster and Crisis Communications, Findings and Implications for Research and Polciy, in: Risk Communication, edited by: Jungermann, H., Kasperson, R. E., and Wiedemann, P. M., Research Center Julich, 1998.
Datascape and Communications Inc.: Kurofune 2004 for Windows, 2004.
EPA (Environmental Protection Agency): National Emission Stan-dards for Hazardous Air Pollutants, 53 Fed. Reg. 28 495, 1988. Fischhoff, B., Slovic, P., Lichtenstein, S., Read, S., and Combs,
B.: How safe is safe enough? A psychometric study of attitudes towards technological risks and benefits., Policy Science, 9, 127– 152, 1978.
Fischhoff, B.: Acceptable Risk: A Conceptual Proposal, RISK: Health, Safety and Environment, 5.1, 1–28, 1994.
Hidano, N. and Kato, T.: A comparison of tax and donation for-mats in contingent valuation surveys: The case of Japan, Dis-cussion Paper No.00-1, available at www:http://www.soc.titech. ac.jp/∼library/discuss/text/dp00-1.pdf (in Japanese with English
abstract), accessed on 19 May 2005, 2000.
Japan Consumer Marketing Research Institute: Risk aversion ori-entation, available at http://www.jmrlsi.co.jp/menu/yougo/my10/ my1006.html, accessed on 9 December 2004, 2002.
Jeager, C. C, Renn, O., Rosa, E. A., and Webler T.: Risk, Uncer-tainty, and Rational Action, Earthscan Publications Ltd, London and Sterling, VA, 2001.
Joffe, H.: Risk and “the other”, Cambrige: Cambrige University Press, 1999.
Katada Lab: Report on the 2004 Niigata-Fukushima Flood, at http://www.ce.gunma-u.ac.jp/regpln/katada/kataweb/atop.htm, accessed on 16 January 2005, 2004, (in Japanese).
Krzanowsk, W. J. I and Marriott, F. H.: Multivariate Analysis: Clas-sification, Covariance Structures and Repeated Measurements, Oxford University Press, 1998.
Lave, L. B. and Byrd, D. M.: How much Risk Is Acceptable? Fo-rum for Applied Research and Public Policy, 42, 93–95, 1989. Motoyoshi, T., Takao, K., and Ikeda S.: Determinant factors of
res-idents’ acceptance of flood risk, Japanese Journal of Social Psy-chology, 20(1), 58–67, 2004, (in Japanese).
Nakayachi, K.: Do people actually pursue risk elimination in envi-ronmental risk management? Risk Analysis, 20, 705–711, 2000. Nigg, J. M.: Risk Communication and Warning Systems, 369–382 in: Natural Risk and Civil Protection, edited by: Horlick-Jones, T., Amendola, A., and Casale, R., London: Chapman and Hall, 1995.
Pasman, H. J.: Risk Perception and the Acceptable Risk-influence Factors. 2nd World Congress on Safety Science, Budapest 21–
24 November, 1993.
Perry, R. W., Greene, M. R., and Lindell, M. K.: Enhancing Evac-uation Warning Compliance: Suggestions for Emergency Plan-ning., Disasters, 4, 433–449, 1980.
Philley, J. O.: Acceptable Risk – An Overview, Plant/Operations Progress, 11(4), 218–223, 1992.
Pilgrim, N. K.: Landslides, Risk and Decision-Making in Kinnaur District: Bridging the Gap between Science and Public Opinion, Disaster, 23(1), 45–65, 1999.
Slovic, P., Fischhoff, B., and Lichtenstein, S.: Rating the risks, En-vironment, 21(3), 14–20, 36–39, 1979.
Slovic, P. and Monahan, J.: Probability, Danger and Coercion: A Study of Risk Perception and Decision-Making in Mental Health Law, Law and Human Behaviour, 19(1), 49–65, 1995.
SPSS Inc.: SPSS 10.0J for Windows, SPSS Inc., 1999a (in Japanese).
SPSS Inc.: A mos 4.0 for Windows, SPSS Inc., 1999b (in Japanese). Starr, C.: Social benefit versus technological risk, Science, 165,
1232–1238, 1969.
Statistical Bureau: Japanese census of housing and land, available at http://www.stat.go.jp/data/jyutaku/1998/11.htm (in Japanese), accessed on 10 December 2004, 1998.
Statistical Bureau: National Census, available at http://www.stat. go.jp/data/kokusei/2000/kekka.htm (in Japanese), accessed on 10 December 2005, 2000.
Statistical Bureau: Japanese Population Census, available at http: //www.stat.go.jp/data/jinsui/tsuki/index.htm (in Japanese), ac-cessed on 10 December 2005, 2005.
Travis, C. C., Crouch, E., Wilson, R., Klema, E.: Cancer risk man-agement: A review of 132 federal regulatory decisions, Environ. Sci. Technol., 21(5), 415–420, 1987.
Turkstra, C. J.: A formulation of structural design decisions, PhD thesis, University of Waterloo, Canada, 1962.
USSD (United States Society on Dams): Dam Safety Risk Assess-ment: What is it? Who’s using it and why? Where should we be going with it?USSD Emerging Issues White Paper, December 2002.
van Dantzig, D.: Economic Decision Problems for Flood Preven-tion, Econometrica, 24, 276–287, 1956.
Vrijling, J. K., van Hengel, W., and Houben, R. J.: Acceptable risk as a basis for design, Reliability Engineering and System Safety, 59, 141–150, 1998.
Vrijling, J. K., van Gelder, P. H. A. J. M., Goossens, L. H. J., Voort-man, H. G., and Pandey, M. D.: A framework for risk criteria for critical infrastructures: fundamentals and case studies in the Netherlands, J. Risk Res., 7(6), 569–579, 2004.
Wakui, Y. and Wakui, S. : Covariance Structural Analysis, Nippon Jitsugyo Publishing Co., Ltd., 2003 (in Japanese).
Zhai, G., Fukuzono, T., and Ikeda, S.: An empirical model of fatal-ities and injuries due to floods in Japan, Journal of the American Water Resources Association, 42(4), 863–875, 2006a.
Zhai, G. and Ikeda, S.: Flood Risk Acceptability and Eco-nomic Value of Evacuation, Risk Analysis, 26(3), 683–694. doi:10.1111/j.1539-6924.2006.00771.x, 2006.
Zhai, G., Sato, T., Fukuzono, T., Ikeda, S., and Yoshida, K.: Will-ingness to pay for flood risk reduction and its determinants in Japan, Journal of the American Water Resources Association, 42(4), 927–940, 2006b.