Statistical and regression analysis of Material
Removal Rate for wire cut Electro Discharge
Machining of SS 304L using design of
experiments
Vishal Parashar a*, A.Rehman b, J.L.Bhagoria c, Y.M.Puri d
a, b ,c Department of Mechanical Engineering, Maulana Azad National Institute of Technology, Bhopal, M.P., 462051, India.
d Department of Mechanical Engineering, Vishweshvariya National Institute of Technology, Nagpur, Maharastra, India.
Abstract
In this paper, statistical and regression analysis of Material removal rate (MRR) using design of experiments is proposed for WEDM operations. Experimentation was planned as per Taguchi’s L’32 (21 X 44) mixed orthogonal
array. Each experiment has been performed under different cutting conditions of gap voltage, pulse ON time, pulse OFF time, wire feed and dielectric flushing pressure. Stainless Steel grade 304L was selected as a work material to conduct the experiments. From experimental results, the MRR was determined for each machining performance criteria. Analysis of variance (ANOVA) technique was used to find out the variables affecting the MRR. Assumptions of ANOVA were discussed and carefully examined using analysis of residuals. Variation of the MRR with machining parameters was mathematically modeled by using the regression analysis method. Finally, the developed model was validated with a new set of experimental data and appeared to be satisfactory.
Keywords: ANOVA, Material Removal Rate (MRR), Taguchi method, WEDM.
1. Introduction
production. In setting the machining parameters, the main goal is the maximum MRR with the minimum Kerf Width. It is the measure of the amount of material that is wasted during machining.
The main purpose of this paper is to investigate effects of machining parameters on the material removal rate of wire EDMed Stainless Steel grade 304L. From the basic principle and characteristic feature of the WEDM process for the machining of SS 304L , It has been observed that the machining parameters, such as gap voltage, pulse on-time, pulse off-time, wire feed and dielectric flushing pressure are the important controllable process parameters of the WEDM process, therefore, these machining parameters are used for the investigation. A proper design of experiments (DOE) is conducted to perform more accurate, less costly, and more efficient experiments. In the present research, an L’32 (21 X 44) Taguchi standard orthogonal array was selected for the design of experiments [10]. Analysis of variance (ANOVA) was used as the analytical tool in studying effects of these machining variables. Assumptions of ANOVA were discussed and carefully examined using analysis of residuals. A mathematical model was developed using multiple regression method to predict MRR.
2. Experimental details
2.1 Material
In this study, stainless steel grade 304 L was applied as work material for experimentation. The chemical composition of the selected work material is shown in table 1.
Table 1: Chemical composition of Stainless Steel grade 304L.
S.no. Chemical Percentage
1. Chromium 18.37%
2. Nickel 8.19%
3. Manganese 1.80%
4. Copper 0.58% 5. Silicon 0.54% 6. Phosphorus 0.039% 7. Nitrogen 0.037% 8. Carbon 0.021% 9. Sulphur 0.019%
10. Fe Balance
2.2 Machine, electrode and dielectric
The Experiments were carried out using CNC Ezeecut plus WEDM machine. Brass wire of 0.25 mm diameter was used as tool electrode in the experimental set up. This is a diffused wire of brass of type Duracut-E. Blasocut 4000 strong that is used as a dielectric fluid was chosen for this experimentation. This is a water miscible metal working fluid.
2.3 Planning of experiments
MRR = Vc x B x H (mm3/min) (1) Where, Vc = machining speed (mm/min),
B = (2Wg + d) (mm)
Wg = wire gap (mm)
D = diameter of electrode wire (mm) H = thickness of the job (mm)
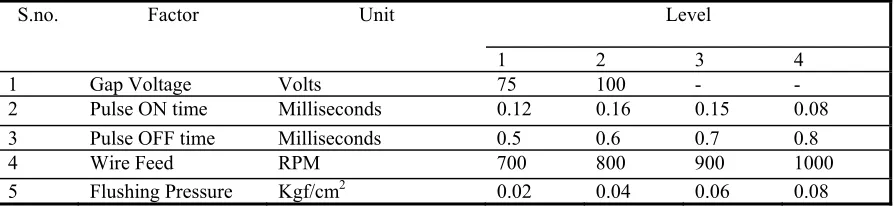
The machining parameters which vigorously affect the MRR are identified based on experience, discussion made with the expert, survey of literature [1, 3, 4, 8, 9]. Those are shown in table 2.
Table 2: Selected machining parameters and their levels
S.no. Factor Unit Level
1 2 3 4
1 Gap Voltage Volts 75 100 - -
2 Pulse ON time Milliseconds 0.12 0.16 0.15 0.08
3 Pulse OFF time Milliseconds 0.5 0.6 0.7 0.8
4 Wire Feed RPM 700 800 900 1000
5 Flushing Pressure Kgf/cm2 0.02 0.04 0.06 0.08
3. Data analysis
To obtain a reliable database, each experiment was repeated three times and the mean values were calculated. After all experiments are conducted, decisions must be made concerning which parameters affect the performance of a process and a mathematical model is developed to predict output amounts close to the actual amounts.
4. Analysis of variance
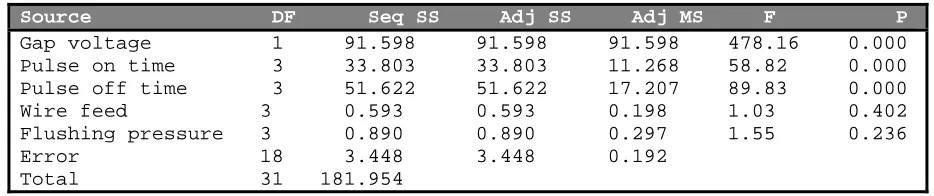
Analysis of variance (ANOVA) for material removal rate was performed to study influences of the wire EDM machining variables. It is used to test the null hypothesis with regard to the data gained through experiments. Through null hypothesis it is assumed that there is no difference in treatment means (H0 : µ1 = µ2 = ….. = µa). Table
3 is ANOVA table for MRR. Before any inferences can be made based on ANOVA table, the assumptions used through ANOVA process have to be checked. The assumptions underlying the ANOVA tell the residuals are determined by evaluating the following Equation [11].
eij = yij - ŷij (2)
Where eij is the residual, yij is the corresponding observation of the experimental runs, ŷij is the fitted value.
478.16 F ratio and importance of other factors based on the F ratio was respectively pulse on time and pulse off time. Wire feed with 1.03 F ratio and flushing pressure with 1.55 F ratio has no effect on material removal rate. Table 4 provides information about proportionality of influential factors with regard to ANOVA results.
Table 3: Analysis of variance for MRR
Source DF Seq SS Adj SS Adj MS F P Gap voltage 1 91.598 91.598 91.598 478.16 0.000 Pulse on time 3 33.803 33.803 11.268 58.82 0.000 Pulse off time 3 51.622 51.622 17.207 89.83 0.000 Wire feed 3 0.593 0.593 0.198 1.03 0.402 Flushing pressure 3 0.890 0.890 0.297 1.55 0.236 Error 18 3.448 3.448 0.192
Total 31 181.954
Fig1: Normal plot of residuals
5 10 15 20 25 30
-0.5 0.0 0.5
Observation Order
R
es
idual
Residuals Versus the Order of the Data (Response is material removal rate)
Fig 2: Residuals in time order
-0.5 0.0 0.5
-2 -1 0 1 2
Nor
m
al
S
c
or
e
Residual
Normal Probability Plot of the Residuals
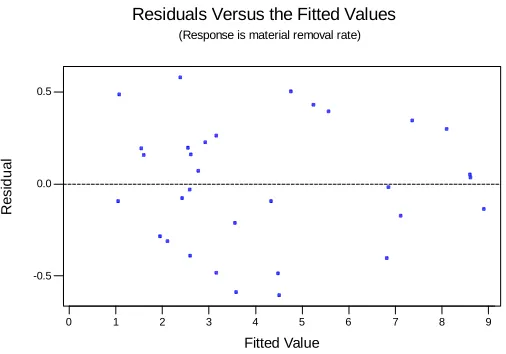
Fig 3: Residuals vs. fitted values
Table 4: Summarization of factor effects.
Factors Significance level Proportionality with
regard to MRR
Gap voltage Pulse on time Pulse off time Wire feed Flushing pressure
Most significance Significance Significance No effect No effect
Direct Reciprocal Reciprocal -- --
It can be seen from table 3 that the gap voltage, pulse on time and pulse off time (p = 0.000) have the most significant impact on MRR. Wire feed with p value 0.402 and flushing pressure with p value 0.236 has no effect on MRR.
5. Regression analysis
Regression analysis is performed to find out the relationship between factors and material removal rate. In conducting regression analysis, it is assumed that factors and the response are linearly related to each other. A multiple regression technique was used to formulate the gap voltage, pulse on time and pulse off time to the MRR. Wire feed and flushing pressure were dropped from the consideration because, based on the statistical analysis, the p value in table 3 for wire feed and flushing pressure is drastically larger than α – level of confidence (0.05) (compared to the rest of the factors). This fact implies that the presence of these two factors only increases the volume of calculation and has almost no effect on the results yielded by regression equation. In general, the units of process factors differ from each other. Even if some of the factors have the same units, not all of these factors will be tested over the same range. Since factors gap voltage, pulse on time and pulse off time have different units and different ranges in the experimental data set, regression analysis should not be performed on the raw or natural factors themselves. Instead they must be normalized before performing a regression analysis. The normalized factors are called coded factors. In this study, coded factors of gap voltage, pulse on time and pulse off time are used as the independent factors in the regression analysis. A coded factor must be defined for each of the actual factor.
0 1 2 3 4 5 6 7 8 9
-0.5 0.0 0.5
Fitted Value
Res
id
u
al
Residuals Versus the Fitted Values
Regression analysis is then performed on the response variable as a function of coded factors. The general model to predict the MRR over the experimental region can be expressed as Equation 3.
y = β0 + β1x1 + β2x2 + β3x3 (3)
Where y is the response and x1, x2, x3 are the coded factors respectively. βs are regression coefficients. The
derived regression equation is as follows
MRR = 9.29 + 6.77 Gap voltage + 1.09 Pulse on time – 1.57 Pulse off time (4)
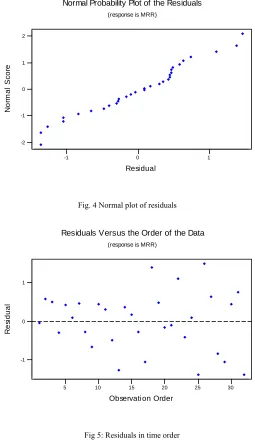
From Equation 4, the factors gap voltage and pulse on time have an additive effect on the MRR and pulse off time has negative impact on MRR. Analysis of the residuals of the model shown in equation 4 was performed to test assumptions of normality (fig 4), independence (fig 5), and constant variance (fig 6) of residuals. The quantitative test methods mentioned earlier were employed again, and none of the assumptions was violated.
-1 0 1
-2 -1 0 1 2
N
or
m
al
S
c
or
e
Residual
Normal Probability Plot of the Residuals
(response is MRR)
Fig. 4 Normal plot of residuals
5 10 15 20 25 30
-1 0 1
Observation Order
R
es
idual
Residuals Versus the Order of the Data
(response is MRR)
1 2 3 4 5 6 7 8 9 -1
0 1
Fitted Value
R
es
idual
Residuals Versus the Fitted Values
(response is MRR)
Fig 6: Residuals vs. fitted values
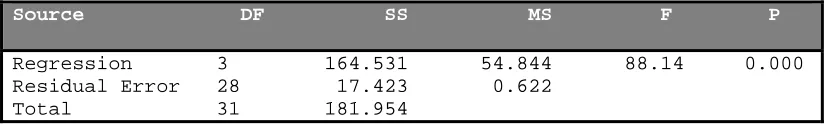
Table 5: ANOVA for regression analysis
Source DF SS MS F P
Regression 3 164.531 54.844 88.14 0.000 Residual Error 28 17.423 0.622
Total 31 181.954
Analysis of variance was derived to examine the null hypothesis for the regression model that is presented in table 5. The results indicate that the estimated model by the regression procedure is significant at the α–level of confidence (0.05). R-squared (R2) amount was calculated to check the goodness of the fit. R2 is a measure of the
amount of reduction in the variability of response obtained by using the regressor variables in the model. Because R2
always increases as we add terms to the model, some regression model builders prefer to use an adjusted R2 statistic.
In general, the R2
adj statistic will not always increase as variables are added to the model. In fact, if unnecessary
terms are added, the value of R2
adj will often decrease. When R2 and R2adj differ dramatically, there is a good chance
that non significant terms have been included in the model [12]. For this experiment the R2 value indicates that the
predictors explain 90.4% of the response variation. Adjusted R2 for the number of predictors in the model was
89.4% both values shows that the data are fitted well.
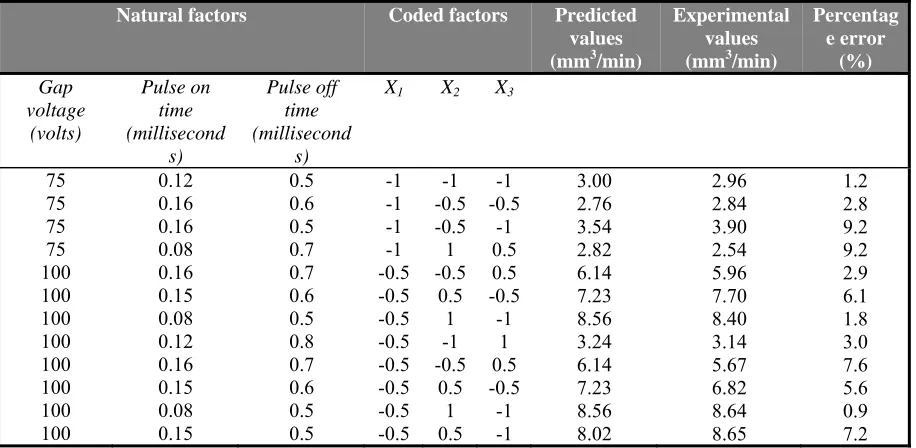
The prediction model was then validated with another set of data. Table 6 shows verification of the tests results for material removal rate. The predicted machining parameters performance is compared with the actual machining performance and a good agreement is observed between these performances. In table 6 process factors are shown in terms of natural factors and their corresponding coded factors. In order to evaluate the accuracy of the prediction model, percentage error and average percentage error were used. Percentage of prediction errors is shown in the last column of table 6. The maximum prediction error was 9.2 % and the average percentage error of this method validation was about 4.7 %. As a result, the prediction accuracy of the model appeared satisfactory.
6. Conclusion
Table 6: Prediction values and errors
Natural factors Coded factors Predicted
values (mm3/min)
Experimental values (mm3/min)
Percentag e error (%) Gap voltage (volts) Pulse on time (millisecond s) Pulse off time (millisecond s)
X1 X2 X3
75 75 75 75 100 100 100 100 100 100 100 100 0.12 0.16 0.16 0.08 0.16 0.15 0.08 0.12 0.16 0.15 0.08 0.15 0.5 0.6 0.5 0.7 0.7 0.6 0.5 0.8 0.7 0.6 0.5 0.5 -1 -1 -1 -1 -0.5 -0.5 -0.5 -0.5 -0.5 -0.5 -0.5 -0.5 -1 -0.5 -0.5 1 -0.5 0.5 1 -1 -0.5 0.5 1 0.5 -1 -0.5 -1 0.5 0.5 -0.5 -1 1 0.5 -0.5 -1 -1 3.00 2.76 3.54 2.82 6.14 7.23 8.56 3.24 6.14 7.23 8.56 8.02 2.96 2.84 3.90 2.54 5.96 7.70 8.40 3.14 5.67 6.82 8.64 8.65 1.2 2.8 9.2 9.2 2.9 6.1 1.8 3.0 7.6 5.6 0.9 7.2
and pulse off time are the significant factors, while wire feed and flushing pressure are the non significant factors to the MRR of wire EDMed SS304L. Finally a mathematical model was developed using multiple regression method to formulate the gap voltage, pulse on time and pulse off time to the MRR. The developed model showed high prediction accuracy within the experimental region. The maximum prediction error of the model was 9.2% and the average percentage error of prediction was 4.7%.
References
[1] K. Kanlayasiri, S. Boonmung ,An investigation on effects of wire-EDM machining parameters on surface roughness of newly developed DC53 die steel, journal mate Process.technol.187 (2007)26-29.
[2] P.M. George, B.K. Raghunath , L.M.Manocha, Ashish M. Warrier, EDM machining of carbon–carbon composite—a Taguchi approach, Journal of Materials Processing Technology 145 (2004) 66–71.
[3] R. Ramakrishnan, L. Karunamoorthy, Multi response optimization of wire EDM operations using robust design of experiments, Int J Adv Manuf Technol (2006) 29: 105–112.
[4] Shajan Kuriakose, M.S. Shunmugam, Multi-objective optimization of wire-electro discharge machining process by Non-Dominated Sorting Genetic Algorithm, journal mater. Process.technol.170 (2005)133-141.
[5] A. Manna, B. Bhattacharyya,Taguchi and Gauss elimination method: A dual response approach for parametric optimization of CNC wire cut EDM of PRAlSiCMMC, Int J Adv Manuf Technol (2006) 28: 67–75.
[6] Aminollah Mohammadi, Alireza Fadaei Tehrani, Ehsan Emanian, Davoud Karimi, statistical analysis of wire electrical discharge turning on material removal rate, Journal of Materials Processing Technology 205 (2008) 283-289.
[7] Ting-Cheng Chang, Feng-Che Tsai, Jiuan-Hung Ke, Data mining and Taguchi method combination applied to the selection of discharge factors and the best interactive factor combination under multiple quality properties, Int J Adv Manuf Technol (2006) 31: 164–174. [8] S. S. Mahapatra, Amar Patnaik, Optimization of wire electrical discharge machining (WEDM) process parameters using Taguchi method,
Int J Adv Manuf Technol (2007) 34:911–925.
[9] Aminollah Mohammadi, Alireza Fadaei Tehrani, Ehsan Emanian, Davoud Karimi, A new approach to surface roughness and roundness improvement in wire electrical discharge turning based on statistical analyses, Int J Adv Manuf Technol (2008) 39:64–73.
[10] M.S. Phadke, Quality Engineering Using Robust Design, Prentice- Hall, Englewood Cliffs, NJ, 1989.
[11] P. Matoorian, S. Sulaiman, M.M.H.M. Ahmad, An experimental study for optimization of electrical discharge turning (EDT) process, journal of materials processing technology 2 0 4 ( 2 0 0 8 ) 350–356