ISSN: 2231-5381
http://www.ijettjournal.org
Page 2278Optimal Location and Sizing of Static Var Compensator
(SVC) by Particle Swarm Optimization (PSO) Technique for
Voltage Stability Enhancement and Power Loss
Minimization
Mr. Vinod K. Shende
1, Prof.P.P.Jagtap
2,
1
(Project Scholar, Department of Electrical Engineering, G.H. Raisoni college of Engineering Nagpur, Maharashtra (India), 2
(Department of Electrical Engineering G.H. Raisoni college of Engineering, R.T.M.Nagpur University, Maharashtra (India),
ABSTRACT: In recent years, the transmission lines are operated under the heavily stressed condition, hence there is a risk of consequent voltage instability in the power network. There is a multi-functional control device which can be effectively control the load flow distribution and the power transfer capability is the flexible alternating current transmission system (FACTS) device. The facts device performance is depend upon its location and parameter setting. In this paper the optimal location and optimal sizing of static var compensator (SVC) is studied on the basis of particle swarm optimization (PSO) technique to minimize load voltage magnitude deviations and network losses using particle swarm optimization have been presented. Particle swarm optimization (PSO) is one of the artificial intelligent search approaches which have the potential to solve such problems. For this study, static var compensator (SVC) is chosen as the
compensator device. Validation through the
implementation on the IEEE 14 bus system shows that the PSO is found feasible to achieve the task.
Keywords:
FACTS Device, optimal location and sizing, Particle swarm optimization (PSO), Voltage deviation, power loss, Static var compensator (SVC) etc…
1. INTRODUCTION:
The power network is more difficult to operate and more insecure due to the ever increasing demand for the electrical power.
On the other hand, Flexible AC transmission system (FACTS) device, which can provide direct and flexible control of power transfer and are very helpful in the operation of power network. The power system performance and the power system stability can be enhanced by using FACTS device. [1] Static var compensator (SVC) is one of the most effective measure device for enhancing the power stability and power transfer capability of transmission network, for this the SVC should be properly installed in the
system with appropriate parameter setting. The some factors considering for optimal installation and the optimal parameter of SVC, Which are the Stability margin improvement, power loss reduction, power blackout prevention and the power transmission capacity enhancement.
In last 20 years, there are algorithm have been developed for optimal power flow incorporating with SVC device and for the optimal placement of SVC; such as are Newtons-Raphson load flow algorithm, Genetic algorithm and the Particle swarm optimization technique for optimal location of the FACTS device. [2], [3] & [4]. It is an actual and important subject to appropriately select the suitable location of the FACTS device installation at the viewpoint of the voltage stability enhancement and power loss minimization. The world wide researchers in the power system have retained the interest in this problem. The various method and criteria were proposed and used to optimal allocation of FACTS devices in power network. [5]
In this paper the application of particle swarm optimization (PSO) for the optimal location and optimal sizing of the SVC with consideration of active power loss reduction and voltage deviation minimization in the power system is highlighted.
2. PROBLEM FORMULATION:
For minimizing the load voltage magnitude deviation and loss of power system the determination of the optimal location and the optimal parameter setting of the SVC in the power network is the main objective. For this the performance index is selected:
Min F = F1+F2 = Ploss + VD (1)
ISSN: 2231-5381
http://www.ijettjournal.org
Page 2279Ploss = network real power loss VD = voltage deviation
F1=Ploss= [Vi2+Vj2-2ViVjcosθij] (2)
∑ NPQ ׀ Vi-Vref. ׀
F2 = VD = __________________ (3)
NPQ
Subjected to this there is some equality and inequality constraints are as follows:
3.1 Equality constraints:
PGi - PDi - Vi j (Gij Cos (θi-θj) +Bij Sin (θi-θj)
= 0
i = 1, 2, --- NB ---- (4)
QGi - QDi - Vi j (Gij Sinθij - Bij Cosθij = 0
i = 1, 2, --- NB ---- (5)
3.2 Inequality constraints:
Pgimin ≤ Pgi ≤ Pgimax (6)
Qgimin ≤ Qgi≤ Qgimax (7) Vimin ≤ Vi≤ Vimax (8) Xsvcmin ≤ Xsvc ≤ Xsvcmax (9)
where,
F is the objective function.
Pgi is the acrive power generation at bus i .
Qgi is the active power load at bus i.
Pdi is the active power load at i.
Qdi is the reactive power load at bus i.
Vi is the voltage magnitude at bus i.
Vj is the voltage magnitude at bus j.
Vref is the reference voltage magnitude
Gij, Bij are mutual conductance and susceptance between bus i and bus j
Xsvc is the reactance of SVC
θij is voltage angle difference between bus i and j
NB is total number of buses excluding slack bus
NPQ is number of PQ buses
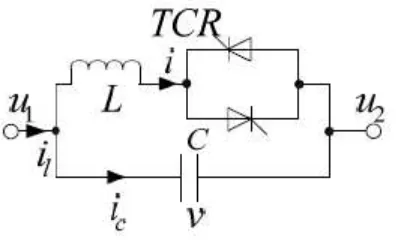
3. STATIC VAR COMPENSATOR
Static var compensator (SVC) is a simplest, low cost FACTS device which is connected in shunt at load buses as a VAR generator or absorber, whose output is adjusted to enhance capacitive or inductive current
so as to control specific parameters of electric power system, typically a bus voltage. The performance characteristics and construction are details in [12]. SVC can be used as susceptance model to adjust the susceptance of the transmission line and as VAR compensator to control the reactive power of the buses. for the connection of steady state model of SVC in a particular load bus „ i „ then the exchanged reactive power at that bus is Qi = QSVC. The
equivalent circuit of the SVC is shown in figure 1.
Fig 1: Equivalent circuit of SVC
3. METHODOLOGY FOR OPTIMAL LOCATION AND SIZING OF SVC. 3.1PARTICAL SWARM OPTIMIZATION
(PSO):
ISSN: 2231-5381
http://www.ijettjournal.org
Page 2280Fig.2: The swarm direction of a particle is defined by the set of particle neighboring the particle and its history
experience.
Sk : current searching point, Sk+1: modified searching point, Vk : current velocity,
V k+1 : modified velocity, Vpbest: velocity based on Pbest,
Vgbest: velocity based on Gbest.
Each particle keeps track of its coordinates in the problem space which are associated with the best solution (fitness) it has achieved so far. The fitness value is also stored. This value is called Pbest. When a particle takes all the population as its topological neighbors, the best value is a global best and is called
Gbest. After finding the two best values, the particle updates its velocity and positions with following equations.
(11)
i=1,2,……..,n, d=1,2,……m. Where,
is the particle best of agent i.
is the globle best.
n is the number of particles in a group. m is the number of members in a particle.
t is the pointer of iterations(generations) w is the inertia weight factor .
c1 and c2 are two acceleration constants .
rand0 and rand1 are two uniform random values in the range [0,1].
is the velocity of particle i at iteration t,
is the current position of particle i at iteration i.
3.1.1. PSO Parameters:
The performance of the PSO is greatly affected by its parameter values. Therefore, a way to find a suitable set of parameters has to be chosen. In this case, the selection of the PSO parameters follows the strategy of considering different values for each particular parameter and evaluating its effect on the PSO performance.
3.1.2. Number of Particles:
There is a trade-off between the number of particles and the number of iterations of the swarm and each particle fitness value has to be evaluated using a power flow solution at each iteration, thus the number of particles should not be large because computational effort could increase dramatically. Swarms of 5 and 25 particles are chosen as an appropriate population sizes.
3.1.3. Inertia Weight:
The inertia weight is linearly decreased. The purpose is to improve the speed of convergence of the results by reducing the inertia weight from an initial value of 0.9 to 0.1 in even steps over the maximum number of iterations as shown in equation
wi = wmax - x iter (12)
Where,
Wi = The inertia weight at iteration i.
iter = the iteration number.
maxiter = The maximum number of iterations.
4. SIMULATION RESULTS
ISSN: 2231-5381
http://www.ijettjournal.org
Page 2281Fig-3: The IEEE-14 Bus system.
It is observed from the obtained results that the
unique advantages of these particle swarm
optimization (PSO) technique, on one hand, there capability of finding the global optimal solution to the optimal location, parameter settings and sizing of SVC problem, on the other hand, they don‟t suffer from the extant computational complexity and other limiting mathematical assumptions that the traditional optimization techniques suffer from.
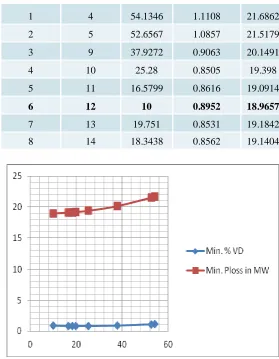
The program is tested for the various buses of the IEEE 14 test bus system, for which the voltage deviation as well as power loss is minimum. The table no.1 and figure no.4 shows the simulation results for various buses.
Table No.1: Simulation result at various buses
SR. NO. BUS NO.
SVC SIZE IN
(MVA) MIN. % VD
MIN. PLOSS
IN (MW)
1 4 54.1346 1.1108 21.6862
2 5 52.6567 1.0857 21.5179
3 9 37.9272 0.9063 20.1491
4 10 25.28 0.8505 19.398
5 11 16.5799 0.8616 19.0914
6 12 10 0.8952 18.9657
7 13 19.751 0.8531 19.1842
8 14 18.3438 0.8562 19.1404
Fig. no. 4: simulation result at various buses for which VD and Ploss is minimum.
5. CONCLUSION:
In this paper, the optimal location and optimal sizing of SVC device is find out to minimize voltage deviation and the active power losses in the power system network using particle swarm optimization (PSO) technique.
ISSN: 2231-5381
http://www.ijettjournal.org
Page 2282percentage voltage deviation as well as power loss is minimum.
6. REFERENCES
[1] Jing Zhang,J.Y. Wen, S.J. Cheng, and Jia Ma , “
A Novel SVC Allocation Method for Power System Voltage Stability Enhancement by Normal Forms of Diffeomorphism,” IEEE Trans . on power System,
Vol.22,No.4,pp1819-1825,Nov.2007.
[2] C.R.Fuerte-Esquivel and E.Acha, and
H.Ambriz-Perez , “ A Thyristor Controlled Series Compensator
Model for the Power Flow Solution of Practical Power Network,” IEEE Trans. Power system,
Vol.15,No.1,pp 58-64, Feb-2000.
[3] M.A.Abdel Moamen, P.P.Narayana , “
Newton-Raphson TCSC Model for the Power flow Solution Of Practical Power Networks,” IEEE Power
Engineering Society Summer Meeting, Vol.3,pp 1488-1493,2002.
[4] M.Saravanam, etal, “Application of PSO
Technique for optimal Location of FACTS Devices Considering System Loadability and Cost of Installation,” Power Engineering conference, Vol.2
pp.716-721 29 Nov-2Dec.2005.
[5] Y.Mansour et al. “ SVC Placement Using Critical
Modes of Voltage Instability,” IEEE Trans. On power
System, Vol.9,no.2, pp.757-763, May 1994.
[6] J.Kennedy and R Eberhart, “ Particle Swarm
optimization,” proc. IEEE Int. Conf.Neural
Networks, Vol 4 , pp 1942-1948, 1995.
[7] Park, K. Lee, Shin, and K. Y. Lee, "A Particle Swarm Optimization for Economic Dispatch with Non smooth Cost Function," IEEE Trans. on Power Systems, Vol. 20, No.1, pp. 34-42, Feb. 2005. [8] Kundur, Paserba, V. Ajjarapu, G. Andersson, A. Bose, C.A. Canizares, N. Hatziarg Y fiou, D. Hill, A. Stankovic, C. Taylor, T. Van Cutsem, and V. Vittal, "Definition and Classification of Power Systeln Stability," IEEE Trans. On Power Systems, Vol. 19,No.2, pp.1387-1401, May 2004.
[9] A.K. Sharma, "Optimal Number and Location of TCSC and Loadability Enhancement in Deregulated Electricity Markets Using MINLP," International Journal of Emerging Electric Power Systems, Vol. 5, Issue 1, Article 6, 2006.
[10] H Yoshida, Y. Fukuyama, "A Particle Swarm Optimization for Reactive Power and Voltage Control Considering Voltage Security Assessment," IEEE Trans. On Power Systems, Vol. 15,No.4, pp.1232 -1239, Nov. 2001.
[11] G.I.Rashed, H.I.Shaheed,S.J.Cheng, “ optimal
location and Parameter setting of TCSC by Both Genetic Algorithm and Partical swarm Optimization.” IEEE Trans. On power systems
,Vol.1,pp.1141-1147. 2007.
[12] R. Minguez, F. Milano, R. Zarate-Mifiano, A. 1.
Conejo,"Optimal Network Placement of SVC
Devices," IEEE Trans. On Power Systems, Vo1.22, No.4, Nov. 2007.
--- Mr.V.K. Shende , Project Scholar,
Department of Electrical
Engineering, G.H. Raisoni college of Engineering Nagpur, Maharashtra (India),
E-mail: [email protected],
participated in many national / internation conferences and journals.
Prof. P.P.Jagtap, Professor in
Department of Electrical Engineering G.H. Raisoni college of Engineering,
R.T.M.Nagpur University,
Maharashtra (India), E-mail: