RESEARCH
Validation of a new WIND classification
compared to ICC classification for weaning
outcome
Byeong‑Ho Jeong
1†, Kyeong Yoon Lee
2†, Jimyoung Nam
2, Myeong Gyun Ko
2, Soo Jin Na
3, Gee Young Suh
1,3and Kyeongman Jeon
1,3*Abstract
Background: Although the WIND (Weaning according to a New Definition) classification based on duration of ventilation after the first separation attempt has been proposed, this new classification has not been tested in clinical practice. The objective of this cohort study was to evaluate the clinical relevance of WIND classification and its associa‑ tion with hospital mortality compared to the International Consensus Conference (ICC) classification.
Methods: All consecutive medical ICU patients who were mechanically ventilated for more than 24 h between July 2010 and September 2013 were prospectively registered. Patients were classified into simple, difficult, or pro‑ longed weaning group according to ICC classification and Groups 1, 2, 3, or no weaning (NW) according to WIND classification.
Results: During the study period, a total of 1600 patients were eligible. These patients were classified by the WIND classification as follows: Group NW = 580 (36.3%), Group 1 = 617 (38.6%), Group 2 = 186 (11.6%), and Group 3 = 217 (13.6%). However, only 735 (45.9%) patients were classified by ICC classification as follows: simple weaning = 503 (68.4%), difficult weaning = 145 (19.7%), and prolonged weaning = 87 (11.8%). Clinical outcomes were significantly different across weaning groups by ICC classification and WIND classification. However, there were no statistical differ‑ ences in successful weaning rate (96.6% vs. 95.2%) or hospital mortality (22.5% vs. 25.5%) between simple and difficult weaning groups by the ICC. Conversely, there were statistically significant differences in successful weaning rate (98.5% vs. 76.9%) and hospital mortality (21.2% vs. 33.9%) between Group 1 and Group 2 by WIND.
Conclusions: The WIND classification could be a better tool for predicting weaning outcomes than the ICC classification.
Keywords: Mechanical ventilation, Ventilator weaning, Treatment outcome, Classification
© The Author(s) 2018. This article is distributed under the terms of the Creative Commons Attribution 4.0 International License (http://creat iveco mmons .org/licen ses/by/4.0/), which permits unrestricted use, distribution, and reproduction in any medium, provided you give appropriate credit to the original author(s) and the source, provide a link to the Creative Commons license, and indicate if changes were made.
Introduction
Weaning from mechanical ventilation (MV) is a complex process involving daily assessment of readiness to wean and spontaneous breathing trial (SBT) to extubation [1]. The weaning process comprises at least 40% of the total
duration of MV [2], and prolonged weaning is associated with higher mortality [3, 4]. A good understanding of the weaning process will reduce the duration of MV, lead to successful extubation, and eventually reduce the mortal-ity rate and length of stay (LOS) in the intensive care unit (ICU) [1, 5].
In 2007, an International Consensus Conference (ICC) on weaning from MV proposed a classification into three different groups (simple, difficult, and prolonged wean-ing) according to the number, duration, and results of SBTs as well as extubation outcomes to simply classify
Open Access
*Correspondence: [email protected]
†Byeong‑Ho Jeong and Kyeong Yoon Lee contributed equally to this study 1 Division of Pulmonary and Critical Care Medicine, Department
and deeply understand the weaning process [1]. However, ICC classification had some problems when applied in clinical practice: (a) it does not apply to patients without a weaning trial (unplanned extubation, death, or transfer out), (b) patients with tracheostomy tube before weaning trials are difficult to classify with ICC, and (c) ICC clas-sification is based only on the successful results of SBT. Therefore, approximately half of mechanically ventilated patients could not be classified by the ICC classification [3, 4, 6, 7]. To overcome these limitations, the WIND (Weaning according to a New Definition) Study Group and the REVA (Réseau Européen de Recherche en Venti-lation Artificielle) Network proposed a new classification using four different groups (Groups 1, 2, 3, and no wean-ing [NW]) [8]. However, WIND classification has not yet been fully validated and has not been sufficiently com-pared with ICC classification. Therefore, the objective of this cohort study was to evaluate the clinical relevance of WIND classification and its association with hospital mortality compared to ICC classification.
Methods Study population
All consecutive patients admitted to the medical ICU and requiring MV for more than 24 h between July 2010 and September 2013 were prospectively registered at Sam-sung Medical Center, a 1989-bed tertiary referral hospital with tertiary-level ICU, in Seoul, South Korea [3, 9, 10]. If a patient was re-admitted to the ICU for MV support during the same hospital admission, only the first wean-ing episode was included in analysis. Multiple ICU visits during different hospital admissions were enrolled sepa-rately. Patients who were transferred from other hospitals after more than 48 h of intubation or were successfully treated by noninvasive ventilation (NIV) were excluded. The Institutional Review Board of Samsung Medical Center approved this study and allowed review and pub-lication of information from patient records. Informed consent was waived because of the study’s observational nature.
Standardized weaning process
Since 2010, the medical ICU of our hospital has utilized a specific protocol-based weaning program according to the recommendations by Boles et al. [1]. Details of our weaning program were described in previous reports [3,
9, 10] and an additional file provided. In short, respira-tory care practitioners (RCP), who are registered nurses specializing in respiratory care, screened patients daily for weaning readiness and conducted SBTs according to the protocol. When a patient passed the SBT, extubation proceeded. If a patient failed the SBT, MV was resumed,
and the team reviewed possible reversible etiologies for the failure. Again, when a patient proved ready for wean-ing, the SBT was repeated the following day.
Weaning classification by ICC and WIND
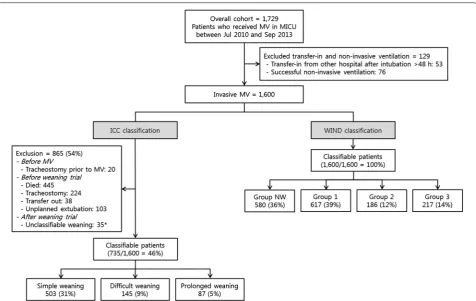
Patients were classified into simple, difficult, or prolonged weaning groups according to ICC classification [1] and Groups 1, 2, 3, or NW according to WIND classification [8]. The three weaning groups by ICC classification were defined as follows: simple weaning, patients who proceed from initiation of weaning to successful extubation (no need to reinstitute ventilator support within 48 h of extu-bation) on the first attempt without difficulty; difficult weaning, patients who failed initial weaning and required up to three SBTs or as long as 7 days from the first SBT to achieve successful extubation; or prolonged weaning, patients who required more than three SBTs or > 7 days of weaning after the first SBT. To apply the ICC classi-fication, unclassifiable patients were excluded as follows: patients with tracheostomy prior to MV; patients who died, underwent tracheostomy, transferred out, or had unplanned extubation before weaning trial; and patients with unclassifiable weaning after SBT who died or were transferred to another hospital after failure of the first SBT and before the third SBT or 7 days (Fig. 1). The four weaning groups by WIND classification were defined as follows: Group NW, patients who never experienced any separation attempt (SA); Group 1, the first SA resulted in termination of the weaning process within 1 day (suc-cessful separation or early death); Group 2, weaning was completed after more than 1 day but in less than 1 week after the first SA (successful separation or death); and Group 3, weaning was not terminated by 7 days after the first SA (by successful separation or death). In WIND classification, SA is defined as SBT or extubation directly performed without SBT (including unplanned extuba-tion) for intubated patients and as ≥ 24 h with sponta-neous ventilation through tracheostomy without any mechanical ventilation for tracheostomized patients.
Weaning outcomes
extubation without death or reintubation within the next 7 days whether postextubation NIV was used or not or ICU discharge without invasive MV within 7 days, whichever comes first; for tracheostomized patients, spontaneous ventilation through tracheos-tomy without any MV for 7 consecutive days or dis-charged with spontaneous breathing, whichever comes first. The date of successful weaning was counted to the actual day of extubation or spontaneous ventilation through tracheostomy after the patient had completed 7 days without reintubation or any MV through trache-ostomy (or was alive and discharged earlier).
Statistical analysis
The data are presented as medians and interquartile ranges (IQR) for continuous variables and as numbers and percentages for categorical variables. The Jonck-heere–Terpstra test for continuous variables [11] and the Mantel–Haenszel test for categorical variables [12] were used to analyze trends of baseline characteristics and outcomes across weaning groups. The Mann–Whitney
U test was used for continuous variables, and Pearson’s
Chi-square test was used for categorical variables to identify statistical differences of main weaning outcomes between weaning groups according to the ICC and WIND classifications, respectively. All tests were two-tailed, and a P value < 0.05 was considered significant. The data were analyzed using PASW Statistics 18 (SPSS Inc., Chicago, IL, USA).
Results
Application of ICC and WIND classifications to the same cohort
During the study period, a total of 1600 patients were eligible after excluding patients who transferred from other hospitals after more than 48 h of intubation (n= 53) or underwent successful NIV (n= 76) (Fig. 1). All eligible patients were classified by the WIND clas-sification as follows: Group NW = 580 (36.3%), Group 1 = 617 (38.6%), Group 2 = 186 (11.6%), and Group 3 = 217 (13.6%). However, only 735 (45.9%) patients could be classified by the ICC classification as follows: simple weaning = 503 (31.4%), difficult weaning = 145 (9.1%), and prolonged weaning = 87 (5.4%).
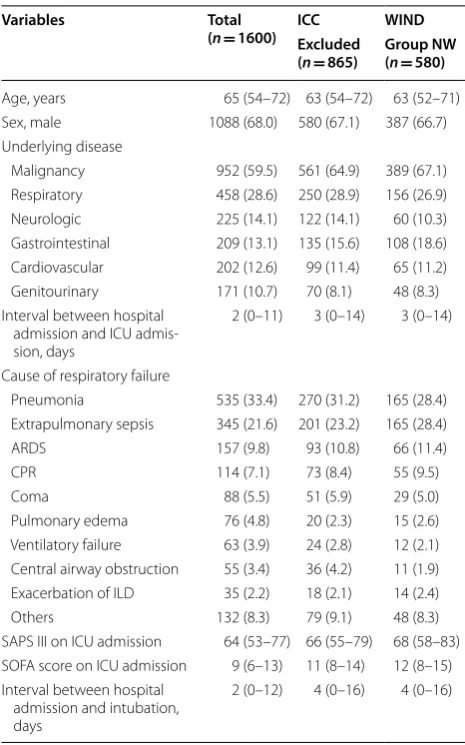
Baseline characteristics of the total cohort are pre-sented in Table 1. Median age was 65 years, and 68.0% of patients were male. The most common comorbidity was malignant disease (59.5%), and the most common cause of respiratory failure was pneumonia (33.4%), fol-lowed by extrapulmonary sepsis (21.6%) and acute res-piratory distress syndrome (9.8%).
Comparison of baseline characteristics among groups according to ICC and WIND classifications
Agreement of weaning results between ICC and WIND classifications is presented in Table 2. Although most patients in the simple weaning (462/503, 91.8%) or pro-longed weaning groups (76/87, 87.4%) were classified as Group 1 or 3, respectively, only 59.3% (86/145) of patients in the difficult weaning group by ICC classifi-cation were classified as Group 2 by WIND classifica-tion. Of 865 patients whose weaning results could not be classified by ICC, 285 were classifiable to Group 1 (n= 109), 2 (n= 68), or 3 (n= 108) by WIND.
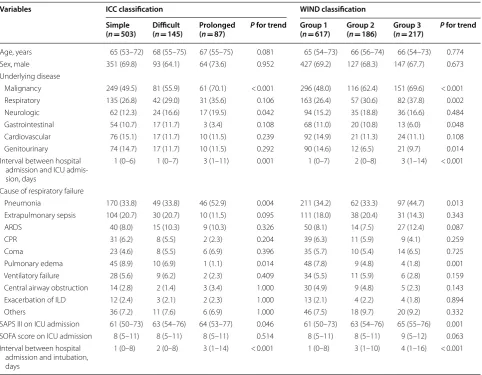
In a comparison of baseline characteristics among weaning groups, there were statistically significant trends with more underlying malignancy and neuro-logic disorders, longer interval between hospital admis-sion and ICU admisadmis-sion, more pneumonia as a cause of respiratory failure, less pulmonary edema as a cause of respiratory failure, and longer interval between hospital admission and intubation across the ICC classification from simple to prolonged weaning groups (Table 3). In addition to this trend, except for neurologic disorders, there were statistically significant trends with more res-piratory disorders and less gastrointestinal and geni-tourinary disorders as underlying diseases across the WIND classification from Group 1 to Group 3.
Clinical outcomes among groups according to ICC and WIND classifications
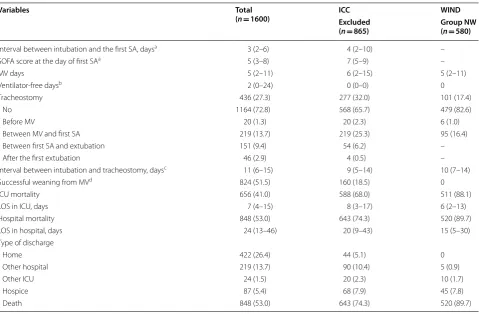
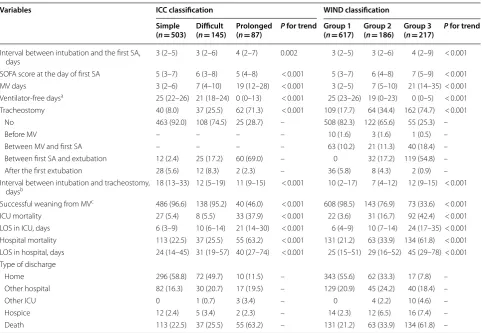
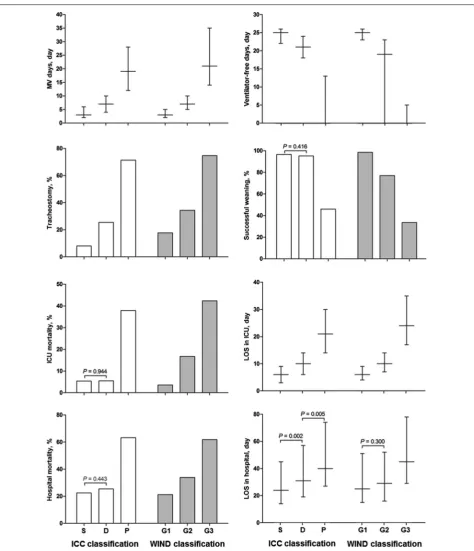
Clinical outcomes of the total cohort are listed in Table 4. Median interval between intubation and first SA was 3 days (IQR, 2–6 days), and median MV requirement was 5 days (IQR 2–11 days). Tracheos-tomy was needed in 416/1580 (26.3%) patients after a median of 11 days (IQR, 6–15 days) of intubation. The successful weaning rate was 51.5%, and ICU and hospi-tal morhospi-tality were 41.0% and 53.0%, respectively.
All of these clinical outcomes showed statistically sig-nificant trends across the ICC and WIND classifications (Table 5). However, there were no statistical differences in successful weaning rate (96.6% vs. 95.2%, P= 0.416), ICU mortality (5.4% vs. 5.5%, P= 0.944), and hospital mortality (22.5% vs. 25.5%, P= 0.443) between simple and difficult weaning groups by ICC (Fig. 2). Conversely,
there were statistically significant differences in success-ful weaning rate (98.5% vs. 76.9%, P < 0.001), ICU mor-tality (3.6% vs. 16.7%, P < 0.001), and hospital mortality (21.2% vs. 33.9%, P < 0.001) between Group 1 and Group 2 by WIND. By the WIND classification, only the LOS between Group 1 and Group 2 had no statistically signifi-cant difference (median 25 days [IQR 15–51 days] versus median 29 days [IQR 16–52 days], P= 0.300).
Discussion
To the best of our knowledge, this is the first valida-tion study of WIND classificavalida-tion compared to ICC classification. Our study demonstrates that the WIND Table 1 Baseline characteristics of the total cohort, excluded patients by ICC classification, and Group NW by WIND classification
ICC International Consensus Conference, NW no weaning, WIND Weaning according to a New Definition, ICU intensive care unit, ARDS acute respiratory distress syndrome, ILD interstitial lung disease, CPR cardiopulmonary resuscitation, SAPS III Simplified Acute Physiology Score III, SOFA Sequential Organ Failure Assessment
Variables Total
(n= 1600) ICCExcluded WIND (n= 865) Group NW(n= 580)
Age, years 65 (54–72) 63 (54–72) 63 (52–71)
Sex, male 1088 (68.0) 580 (67.1) 387 (66.7)
Underlying disease
Malignancy 952 (59.5) 561 (64.9) 389 (67.1)
Respiratory 458 (28.6) 250 (28.9) 156 (26.9)
Neurologic 225 (14.1) 122 (14.1) 60 (10.3)
Gastrointestinal 209 (13.1) 135 (15.6) 108 (18.6)
Cardiovascular 202 (12.6) 99 (11.4) 65 (11.2)
Genitourinary 171 (10.7) 70 (8.1) 48 (8.3)
Interval between hospital admission and ICU admis‑ sion, days
2 (0–11) 3 (0–14) 3 (0–14)
Cause of respiratory failure
Pneumonia 535 (33.4) 270 (31.2) 165 (28.4)
Extrapulmonary sepsis 345 (21.6) 201 (23.2) 165 (28.4)
ARDS 157 (9.8) 93 (10.8) 66 (11.4)
CPR 114 (7.1) 73 (8.4) 55 (9.5)
Coma 88 (5.5) 51 (5.9) 29 (5.0)
Pulmonary edema 76 (4.8) 20 (2.3) 15 (2.6)
Ventilatory failure 63 (3.9) 24 (2.8) 12 (2.1)
Central airway obstruction 55 (3.4) 36 (4.2) 11 (1.9)
Exacerbation of ILD 35 (2.2) 18 (2.1) 14 (2.4)
Others 132 (8.3) 79 (9.1) 48 (8.3)
SAPS III on ICU admission 64 (53–77) 66 (55–79) 68 (58–83) SOFA score on ICU admission 9 (6–13) 11 (8–14) 12 (8–15) Interval between hospital
admission and intubation, days
classification could be operational for every patient under MV and better discriminates clinical outcomes by wean-ing group compared to ICC classification.
In this study, only 46% of patients receiving inva-sive MV were classifiable by ICC. However, WIND classification was applicable to all patients, even in Table 2 Agreement according to ICC and WIND classifications
For each line and column, agreement was calculated as follows: (number of patients classified in the same group by 2 classifications)/(total number of patients in line or column)
ICC International Consensus Conference, WIND Weaning according to a New Definition, NW no weaning, NA not accessible
ICC Simple Difficult Prolonged Not classified Total Agreement, %
WIND
Group NW 0 0 0 580 580 NA
Group 1 462 46 0 109 617 74.9
Group 2 21 86 11 68 186 46.2
Group 3 20 13 76 108 217 35.0
Total 503 145 87 865 1600
Agreement, % 91.8 59.3 87.4 NA 39.0
Table 3 Comparison of baseline characteristics according to ICC and WIND classifications
ICC International Consensus Conference, WIND Weaning according to a New Definition, ICU intensive care unit, ARDS acute respiratory distress syndrome,
ILD interstitial lung disease, CPR cardiopulmonary resuscitation, SAPS III Simplified Acute Physiology Score III, SOFA Sequential Organ Failure Assessment
Variables ICC classification WIND classification
Simple
(n= 503) Difficult(n= 145) Prolonged(n= 87) P for trend Group 1(n= 617) Group 2(n= 186) Group 3(n= 217) P for trend
Age, years 65 (53–72) 68 (55–75) 67 (55–75) 0.081 65 (54–73) 66 (56–74) 66 (54–73) 0.774
Sex, male 351 (69.8) 93 (64.1) 64 (73.6) 0.952 427 (69.2) 127 (68.3) 147 (67.7) 0.673
Underlying disease
Malignancy 249 (49.5) 81 (55.9) 61 (70.1) < 0.001 296 (48.0) 116 (62.4) 151 (69.6) < 0.001
Respiratory 135 (26.8) 42 (29.0) 31 (35.6) 0.106 163 (26.4) 57 (30.6) 82 (37.8) 0.002
Neurologic 62 (12.3) 24 (16.6) 17 (19.5) 0.042 94 (15.2) 35 (18.8) 36 (16.6) 0.484
Gastrointestinal 54 (10.7) 17 (11.7) 3 (3.4) 0.108 68 (11.0) 20 (10.8) 13 (6.0) 0.048
Cardiovascular 76 (15.1) 17 (11.7) 10 (11.5) 0.239 92 (14.9) 21 (11.3) 24 (11.1) 0.108
Genitourinary 74 (14.7) 17 (11.7) 10 (11.5) 0.292 90 (14.6) 12 (6.5) 21 (9.7) 0.014
Interval between hospital admission and ICU admis‑ sion, days
1 (0–6) 1 (0–7) 3 (1–11) 0.001 1 (0–7) 2 (0–8) 3 (1–14) < 0.001
Cause of respiratory failure
Pneumonia 170 (33.8) 49 (33.8) 46 (52.9) 0.004 211 (34.2) 62 (33.3) 97 (44.7) 0.013
Extrapulmonary sepsis 104 (20.7) 30 (20.7) 10 (11.5) 0.095 111 (18.0) 38 (20.4) 31 (14.3) 0.343
ARDS 40 (8.0) 15 (10.3) 9 (10.3) 0.326 50 (8.1) 14 (7.5) 27 (12.4) 0.087
CPR 31 (6.2) 8 (5.5) 2 (2.3) 0.204 39 (6.3) 11 (5.9) 9 (4.1) 0.259
Coma 23 (4.6) 8 (5.5) 6 (6.9) 0.396 35 (5.7) 10 (5.4) 14 (6.5) 0.725
Pulmonary edema 45 (8.9) 10 (6.9) 1 (1.1) 0.014 48 (7.8) 9 (4.8) 4 (1.8) 0.001
Ventilatory failure 28 (5.6) 9 (6.2) 2 (2.3) 0.409 34 (5.5) 11 (5.9) 6 (2.8) 0.159
Central airway obstruction 14 (2.8) 2 (1.4) 3 (3.4) 1.000 30 (4.9) 9 (4.8) 5 (2.3) 0.143
Exacerbation of ILD 12 (2.4) 3 (2.1) 2 (2.3) 1.000 13 (2.1) 4 (2.2) 4 (1.8) 0.894
Others 36 (7.2) 11 (7.6) 6 (6.9) 1.000 46 (7.5) 18 (9.7) 20 (9.2) 0.332
SAPS III on ICU admission 61 (50–73) 63 (54–76) 64 (53–77) 0.046 61 (50–73) 63 (54–76) 65 (55–76) 0.001
SOFA score on ICU admission 8 (5–11) 8 (5–11) 8 (5–11) 0.514 8 (5–11) 8 (5–11) 9 (5–12) 0.063
Interval between hospital admission and intubation, days
tracheostomized patients and patients not receiving the SBT. Our results are similar to those of the origi-nal study that proposed WIND classification, which classified only 1330/2709 (51%) patients by ICC and all patients by WIND [8]. In previous studies related to ICC classification, 40–60% of mechanically ventilated patients were excluded from studies because they died, had a tracheostomy, transferred to another hospital, had unplanned extubation before they were ready to wean or during weaning, or did not use SBT to wean [3, 4, 6, 7]. However, all patients could adopt the WIND classification because (a) the starting point of weaning in WIND classification was defined as SA including methods other than SBT, even unplanned extubation, (b) WIND classification provided clear criteria for the starting point of weaning and successful weaning in both intubated and tracheostomized patients, and (c)
the WIND classification is based on duration of ven-tilation between the first SA and the end of weaning, regardless of the results, such as successful separation or death.
Although most previous studies have shown that pro-longed weaning increases ICU and hospital mortality rates, there are no statistical differences between simple and difficult weaning [3, 4, 6, 7, 13]. As with previous studies, ICU and hospital mortality and successful wean-ing rates between simple and difficult weanwean-ing groups by ICC classification showed no differences in the present study. However, WIND classification had stepwise dif-ferences in Groups 1–3 for these weaning outcomes. In Table 4, successful weaning was noted in 18.5% (160/865) of the unclassifiable patients by ICC. In addition, their ICU survival rate was 32.0%, which was higher than that of Group NW (11.9%). Because these patients were Table 4 Clinical outcomes of total cohort, excluded patients by ICC classification, and Group NW by WIND classification
ICC International Consensus Conference, NW no weaning, WIND Weaning according to a New Definition, SA separation attempt, SOFA Sequential Organ Failure Assessment, MV mechanical ventilation, ICU intensive care unit, LOS length of stay
a Excluded patients who had no SA from MV. Therefore, total patients, excluded patients by ICC, and Group NW by WIND numbered 1020, 285, and 0, respectively
b Ventilator-free days are defined as 28 minus the total number of days with invasive MV. Nonsurvivors were considered as having 0 ventilator-free days
c Excluded patients with no tracheostomy or tracheostomy prior to mechanical ventilation
d Successful weaning is defined as in the WIND Study (Intubated patients: extubation without death or reintubation within 7 days after extubation [whether postextubation noninvasive ventilation was used or not] or ICU discharge without invasive mechanical ventilation within 7 days, whichever comes first. Tracheostomized patients: spontaneous ventilation through tracheostomy without any mechanical ventilation during 7 consecutive days or ICU discharge with spontaneous breathing, whichever comes first)
Variables Total
(n= 1600) ICCExcluded WIND
(n= 865) Group NW(n= 580)
Interval between intubation and the first SA, daysa 3 (2–6) 4 (2–10) –
SOFA score at the day of first SAa 5 (3–8) 7 (5–9) –
MV days 5 (2–11) 6 (2–15) 5 (2–11)
Ventilator‑free daysb 2 (0–24) 0 (0–0) 0
Tracheostomy 436 (27.3) 277 (32.0) 101 (17.4)
No 1164 (72.8) 568 (65.7) 479 (82.6)
Before MV 20 (1.3) 20 (2.3) 6 (1.0)
Between MV and first SA 219 (13.7) 219 (25.3) 95 (16.4)
Between first SA and extubation 151 (9.4) 54 (6.2) –
After the first extubation 46 (2.9) 4 (0.5) –
Interval between intubation and tracheostomy, daysc 11 (6–15) 9 (5–14) 10 (7–14)
Successful weaning from MVd 824 (51.5) 160 (18.5) 0
ICU mortality 656 (41.0) 588 (68.0) 511 (88.1)
LOS in ICU, days 7 (4–15) 8 (3–17) 6 (2–13)
Hospital mortality 848 (53.0) 643 (74.3) 520 (89.7)
LOS in hospital, days 24 (13–46) 20 (9–43) 15 (5–30)
Type of discharge
Home 422 (26.4) 44 (5.1) 0
Other hospital 219 (13.7) 90 (10.4) 5 (0.9)
Other ICU 24 (1.5) 20 (2.3) 10 (1.7)
Hospice 87 (5.4) 68 (7.9) 45 (7.8)
classified as Groups 1–3 by WIND, the WIND classifica-tion seems to show greater differences in weaning out-comes between groups than does the ICC classification.
Although this study provides new information on weaning outcome based on new definitions that allow classification of all mechanically ventilated patients, our study has some limitations that should be considered. First, given its observational nature in a single tertiary referral hospital, there could be a selection bias that might have influenced the significance of our results. However, the data were collected prospectively between July 2010 and September 2013 from all consecutive patients who were admitted to the medical ICU and mechanically ventilated for more than 24 h. The patients were screened daily for weaning readiness according to a
protocol-based weaning program [3, 9]. Thus, our cohort is more likely to reflect the patients encountered in rou-tine ICU practice, and our findings are therefore readily applicable in similar settings. Second, our cohort was weaned from MV according to a protocol-based program with SBT using a T-piece. In addition, tracheostomy was performed in a quarter of patients, which is higher than the rate of 11–15% in an international multicenter study [14]. Although SBT using a T-piece is a general method of withdrawal from MV [4] and tracheostomy may improve aspects of care of patients on MV [15], our findings have limitations in their generalizability to other groups that underwent methods such as SBT using low pressure support, continuous positive airway pressure, gradual reduction in support using pressure support Table 5 Clinical outcomes according to ICC and WIND classifications
ICC International Consensus Conference, WIND Weaning according to a New Definition, SA separation attempt, SOFA Sequential Organ Failure Assessment,
MV mechanical ventilation, ICU intensive care unit, LOS length of stay
a Ventilator-free days are defined as 28 minus the total number of days with invasive MV. Nonsurvivors were considered as having 0 ventilator-free days
b Excluded patients with no tracheostomy and tracheostomy prior to mechanical ventilation
c Successful weaning is defined as in the WIND Study (Intubated patients: extubation without death or reintubation within 7 days after extubation [whether postextubation noninvasive ventilation was used or not] or ICU discharge without invasive mechanical ventilation within 7 days, whichever comes first. Tracheostomized patients: spontaneous ventilation through tracheostomy without any mechanical ventilation during 7 consecutive days or ICU discharge with spontaneous breathing, whichever comes first)
Variables ICC classification WIND classification
Simple
(n= 503) Difficult(n= 145) Prolonged(n= 87) P for trend Group 1(n= 617) Group 2(n= 186) Group 3(n= 217) P for trend
Interval between intubation and the first SA,
days 3 (2–5) 3 (2–6) 4 (2–7) 0.002 3 (2–5) 3 (2–6) 4 (2–9) < 0.001
SOFA score at the day of first SA 5 (3–7) 6 (3–8) 5 (4–8) < 0.001 5 (3–7) 6 (4–8) 7 (5–9) < 0.001
MV days 3 (2–6) 7 (4–10) 19 (12–28) < 0.001 3 (2–5) 7 (5–10) 21 (14–35) < 0.001
Ventilator‑free daysa 25 (22–26) 21 (18–24) 0 (0–13) < 0.001 25 (23–26) 19 (0–23) 0 (0–5) < 0.001
Tracheostomy 40 (8.0) 37 (25.5) 62 (71.3) < 0.001 109 (17.7) 64 (34.4) 162 (74.7) < 0.001
No 463 (92.0) 108 (74.5) 25 (28.7) – 508 (82.3) 122 (65.6) 55 (25.3) –
Before MV – – – – 10 (1.6) 3 (1.6) 1 (0.5) –
Between MV and first SA – – – – 63 (10.2) 21 (11.3) 40 (18.4) –
Between first SA and extubation 12 (2.4) 25 (17.2) 60 (69.0) – 0 32 (17.2) 119 (54.8) –
After the first extubation 28 (5.6) 12 (8.3) 2 (2.3) – 36 (5.8) 8 (4.3) 2 (0.9) –
Interval between intubation and tracheostomy,
daysb 18 (13–33) 12 (5–19) 11 (9–15) < 0.001 10 (2–17) 7 (4–12) 12 (9–15) < 0.001
Successful weaning from MVc 486 (96.6) 138 (95.2) 40 (46.0) < 0.001 608 (98.5) 143 (76.9) 73 (33.6) < 0.001
ICU mortality 27 (5.4) 8 (5.5) 33 (37.9) < 0.001 22 (3.6) 31 (16.7) 92 (42.4) < 0.001
LOS in ICU, days 6 (3–9) 10 (6–14) 21 (14–30) < 0.001 6 (4–9) 10 (7–14) 24 (17–35) < 0.001
Hospital mortality 113 (22.5) 37 (25.5) 55 (63.2) < 0.001 131 (21.2) 63 (33.9) 134 (61.8) < 0.001
LOS in hospital, days 24 (14–45) 31 (19–57) 40 (27–74) < 0.001 25 (15–51) 29 (16–52) 45 (29–78) < 0.001
Type of discharge
Home 296 (58.8) 72 (49.7) 10 (11.5) – 343 (55.6) 62 (33.3) 17 (7.8) –
Other hospital 82 (16.3) 30 (20.7) 17 (19.5) – 129 (20.9) 45 (24.2) 40 (18.4) –
Other ICU 0 1 (0.7) 3 (3.4) – 0 4 (2.2) 10 (4.6) –
Hospice 12 (2.4) 5 (3.4) 2 (2.3) – 14 (2.3) 12 (6.5) 16 (7.4) –
mode, or synchronized intermittent mandatory ventila-tion, and that has lower rate of tracheostomy.
Conclusion
In conclusion, WIND classification could be a better tool for predicting weaning outcomes than ICC classification because WIND classification is applicable to all mechani-cally ventilated patients and has higher discriminatory power for weaning outcomes.
Additional file
Additional file 1. Standardized weaning process.
Abbreviations
ICC: International Consensus Conference; ICU: intensive care unit; IQR: interquartile range; LOS: length of stay; MV: mechanical ventilation; NIV: noninvasive ventilation; NW: no weaning; RCP: respiratory care practitioners; REVA: Réseau Européen de Recherche en Ventilation Artificielle; SA: separation attempt; SBT: spontaneous breathing trial; WIND: Weaning according to a New Definition.
Authors’ contributions
BHJ, KYL, and KJ conceived and designed the study; BHJ, KYL, JN, MGK, SJN, GYS, and KJ analyzed and interpreted the data; BHJ, KYL, and KJ drafted the manuscript for intellectual content; BHJ, KYL, JN, MGK, SJN, GYS, and KJ revised the manuscript. All authors read and approved the final manuscript.
Author details
1 Division of Pulmonary and Critical Care Medicine, Department of Medicine,
Samsung Medical Center, Sungkyunkwan University School of Medicine, 81 Irwon‑ro, Gangnam‑gu, Seoul 06351, Republic of Korea. 2 Intensive Care Unit
Nursing Department, Samsung Medical Center, Sungkyunkwan University School of Medicine, Seoul, Republic of Korea. 3 Department of Critical Care
Medicine, Samsung Medical Center, Sungkyunkwan University School of Medicine, Seoul, Republic of Korea.
Acknowledgements
Not applicable.
Competing interests
The authors declare that they have no competing interests.
Availability of data and materials
All data generated or analyzed during the present study are included in this published article.
Consent for publication
Not applicable.
Ethics approval and consent to participate
The Institutional Review Board of Samsung Medical Center approved this study and waived the requirement for informed consent because of the observational nature of the study.
Funding
This work was supported by a Samsung Medical Center Grant (SMO1180151).
Publisher’s Note
Springer Nature remains neutral with regard to jurisdictional claims in published maps and institutional affiliations.
Received: 13 September 2018 Accepted: 26 November 2018
References
1. Boles JM, Bion J, Connors A, Herridge M, Marsh B, Melot C, et al. Weaning from mechanical ventilation. Eur Respir J. 2007;29:1033–56.
2. Esteban A, Ferguson ND, Meade MO, Frutos‑Vivar F, Apezteguia C, Brochard L, et al. Evolution of mechanical ventilation in response to clinical research. Am J Respir Crit Care Med. 2008;177:170–7.
3. Jeong BH, Ko MG, Nam J, Yoo H, Chung CR, Suh GY, et al. Differences in clini‑ cal outcomes according to weaning classifications in medical intensive care units. PLoS ONE. 2015;10:e0122810.
4. Penuelas O, Frutos‑Vivar F, Fernandez C, Anzueto A, Epstein SK, Apezteguia C, et al. Characteristics and outcomes of ventilated patients according to time to liberation from mechanical ventilation. Am J Respir Crit Care Med. 2011;184:430–7.
5. Blackwood B, Alderdice F, Burns K, Cardwell C, Lavery G, O’Halloran P. Use of weaning protocols for reducing duration of mechanical ventilation in criti‑ cally ill adult patients: cochrane systematic review and meta‑analysis. BMJ. 2011;342:c7237.
6. Funk GC, Anders S, Breyer MK, Burghuber OC, Edelmann G, Heindl W, et al. Incidence and outcome of weaning from mechanical ventilation according to new categories. Eur Respir J. 2010;35:88–94.
7. Pu L, Zhu B, Jiang L, Du B, Zhu X, Li A, et al. Weaning critically ill patients from mechanical ventilation: a prospective cohort study. J Crit Care. 2015;30(862):e7–13.
8. Beduneau G, Pham T, Schortgen F, Piquilloud L, Zogheib E, Jonas M, et al. Epidemiology of Weaning Outcome according to a New Definition. The WIND Study. Am J Respir Crit Care Med. 2017;195:772–83.
9. Jeon K, Jeong BH, Ko MG, Nam J, Yoo H, Chung CR, et al. Impact of delirium on weaning from mechanical ventilation in medical patients. Respirology. 2016;21:313–20.
10. Jeong BH, Nam J, Ko MG, Chung CR, Suh GY, Jeon K. Impact of limb weak‑ ness on extubation failure after planned extubation in medical patients. Respirology. 2018;23:842–50.
11. Bewick V, Cheek L, Ball J. Statistics review 10: further nonparametric meth‑ ods. Crit Care. 2004;8:196–9.
12. Bewick V, Cheek L, Ball J. Statistics review 8: qualitative data: tests of associa‑ tion. Crit Care. 2004;8:46–53.
13. Tonnelier A, Tonnelier JM, Nowak E, Gut‑Gobert C, Prat G, Renault A, et al. Clinical relevance of classification according to weaning difficulty. Respir Care. 2011;56:583–90.
14. Esteban A, Frutos‑Vivar F, Muriel A, Ferguson ND, Penuelas O, Abraira V, et al. Evolution of mortality over time in patients receiving mechanical ventila‑ tion. Am J Respir Crit Care Med. 2013;188:220–30.