CUSTOMER AND ENERGY BASED INDICES CONSIDERATION
FOR RELIABILITY ENHANCEMENT OF DISTRIBUTION
SYSTEM USING IMPROVED TEACHING LEARNING BASED
OPTIMIZATION
Dr. Aditya Tiwary1
1. INTRODUCTION
Reliability evaluation of distribution systems is important from consumer’s view-point. Outage customer oriented and energy based indices are important for analysis of distribution system. Considerable research efforts have been devoted to improve availability of supply due to distribution systems [1]. Preventive maintenance reduces failure rate whereas along with corrective repair availability of supply increases [2]. Gangel and Ringlee [3] initially presented modelling concepts for the individual components of distribution systems for reliability evaluation. Different techniques for evaluating reliability indices have been discussed in literature [4-10]. Pereira and Pinto [11] discussed modelling assumptions and computational aspects of a computational tool for composite system reliability evaluation. Su and Lii [12] used genetic algorithm for distribution system and obtained optimum failure and repair rates. The optimal design of reliability indices in an electrical distribution system and their impact to planning was discussed by Chang et al. [13]. Popov et al. [14] described an algorithm of reliability optimization for operational planning of distribution system. Meziane et al. [15] discussed reliability optimization using ant colony algorithm under performance and cost constraints. Sohn et al. [16] discussed a method for identifying the type and location for protection devices and switches on the pre routed distribution system using value based optimization. Bakkiyaraj and Kumarappan [17] presented a methodology for evaluating optimal reliability indices of system components for a composite electric power system based on state sampling non-sequential Monte Carlo simulation and using particle swarm optimization (PSO) algorithm. Louit et al. [18] presented a methodology for obtaining optimum interval for major maintenance action for a power network. An algorithm for evaluating optimum value of reliability indices for distribution system using gradient projection method was proposed by Sallam et al. [19].
This paper describes an algorithm for reliability improvement of a radial distribution system accounting constraints on energy based and customer oriented indices using Improved Teaching Learning based optimization algorithm. The algorithm propose based on teaching learning based algorithm is implemented on radial distribution system. Statistical analysis is also provided.
2. CUSTOMER ORIENTED AND ENERGY BASED RELIABILITY INDICES
EPRI (Electric Power Research Institute) has identified that most frequently used customer oriented indices are SAIFI, SAIDI, CAIDI and AENS. These indices are defined as follows [20]
System average interruption frequency index (SAIFI)
System average interruption duration index (SAIDI)
1
Associate Professor, Electrical & Electronics Engineering Department, Institute of Engineering & Science, IPS Academy, Indore, MP, India
Abstract-This paper describes an algorithm for optimum modifications for failure rate and repair time for a radial distribution system. The modifications are with respect to a penalty cost function minimization. The cost function has been minimized subject to the energy based and customer oriented indices. Improved Teaching Learning based optimization (I-TLBO) has been used for optimization. The algorithm has been implemented on a sample radial distribution system.
Customer average interruption duration index (CAIDI)
Expressions for the evaluation of system failure rate and system unavailability for each load point are given as follows
S denotes the set of distributor segments connected in series up to ith load point.
One of the most important energy based indices is average energy not supplied (AENS) which is given as follows.
where Li is average load connected at ith load point. Constraint is imposed on AENS by selecting a threshold value of this index.
3. PROBLEM FORMULATION
The cost function in penalty form has been assumed and is given as follows [21]
J = J1 + J2 (1)
where J1 represents total penalty on modifications in failure rates at each distributor segment and is expressed as
(2)
Where , and are current, minimum achievable and modified failure rate of ith segment respectively. NC denotes total number of distributor segments.
J2 represents cost of modification in repair time for all the distributor segments and is given as follows
(3) where ri0, ri and ri,min represent current, modified and minimum achievable repair time for ith segment. It is obvious that the lesser is the value of repair time the more is the penalty. It is assumed that modified repair time of a component is less than the current value.
Finally the objective function (1) is written as follows
(4) The objective function as given by (4) is minimized subject to following constraints
4. OVERVIEW OF IMPROVED TEACHING LEARNING BASED OPTIMIZATION (I-TLBO)
decision variables.
The mean of the population is obtained as follows
]
,...
,
[
1 2 DD
m
m
m
M
(5)Now the mean will be the new teacher, therefore
D teacher D
new
X
M
,
, (6)The difference between the mean is given by
)
(
new,D F DD
r
M
T
M
Difference
(7)TF
is teaching factor and randomly selected as 1 or 2. The modified population is updated as follows:D D
old D
new
X
Difference
X
,
,
(8)Accept
X
new,D if it gives better objective function value. ObtainX
modified from learners phase as follows:if
f
(
X
i)
f
(
X
j)
, thenX
modified
X
old
r
(
X
i
X
j)
Otherwise,
X
modified
X
old
r
(
X
j
X
i)
(9)i
X
is the ith vector andX
j are randomly selected vector. Compare the objective function value ofX
new,D andX
modified. The objective function which provides least value will be the new population. The procedure is terminated if a maximum number of Teaching-Learning generations (k
max) have been executed.The Improved teaching learning based optimization method is proposed by Rao et al. [23]. In the basic TLBO algorithm [22], the result of the learners is improved either by a single teacher (through classroom teaching) or by interacting with other learners. However, in the traditional teaching-learning environment, the students also learn during tutorial hours by discussing with their fellow classmates or even by discussion with the teacher himself/herself. Moreover, sometime students are self-motivated and try to learn by themselves. Furthermore, the teaching factor in the basic TLBO algorithm is either 2 or 1, which reflects two extreme circumstances where a learner learns either everything or nothing from the teacher. In this system, a teacher has to expend more effort to improve the results of learners. During the course of optimization, this situation results in a slower convergence rate of the optimization problem. Considering this fact, to enhance the exploration and exploitation capacities, some improvements have been introduced to the basic TLBO algorithm. Rao et al. [24, 25] made some modifications to the basic TLBO algorithm and applied the same to the optimization of a two stage thermoelectric cooler and heat exchangers. The previous modifications are further enhanced and a new modification is introduced to improve the performance of the algorithm, which consists of number of teachers, adaptive teaching factor, learning through tutorials, self-motivated learning.
5. RESULTS AND DISCUSSIONS
The I-TLBO algorithm developed in this paper for reliability enhancement has been implemented on a radial distribution system [21]. The system has in all seven load points (LP). The system contains seven feeder segments. Initial failure rate and average repair time for each distributor segment is provided in [21]. The same table also gives minimum reachable values of these variables. Average loads and number of customers (Ni) at each load point is provided in [21]. Table 1 presents the statistics of best fitness function values as obtained using I-TLBO, PSO and CAPSO based on 30 numbers of runs.
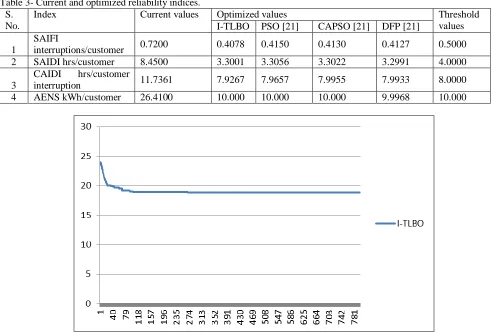
Fig.-1 shows the evolution of best fitness value (objective function) as obtained by I-TLBO algorithm. Table 2 shows the optimized set of decision variables along with least values of objective function as obtained by I-TLBO. These values are with respect to the best run in each case. Table 3 shows un-optimized and optimized values of the customer and energy based indices.
6. CONCLUSIONS
7. REFERENCES
[1] D. Elmakias, New Computational Methods in Power System Reliability. (Springer International Edition, 2000).
[2] I. Gertsbakh, Reliability Theory with Applications to Preventive Maintenance. (Springer International Edition, 2000).
[3] M.W. Gangel, R.J. Ringlee, Distribution system reliability performance. IEEE Trans. PAS-1968 87(7), 1657–1665 (1968).
[4] IEEE Committee Report, Bibliography on the application of probability methods in power system reliability evaluation. IEEE Trans. Power Appar. Syst.
PAS-91, 649–660 (1972).
[5] IEEE Committee Report, Bibliography on the application of probability methods in power system reliability evaluation, 1971 –1977. IEEE Trans. Power
Appar. Syst. PAS-97, 2235–2242, (1978).
[6] R.N. Allan, E.N. Dialynas, I.R. Homer, Modelling and evaluating the reliability of distribution systems. IEEE Trans. PAS -98, 2181–2189 (1979).
[7] R. Billinton, R.N. Allan, Reliability Evaluation of Engineering Systems. (Springer International Edition, 1992).
[8] M.V.F. Pereira, L.M.V.G. Pinto, A new computational tool for composite reliability evaluation. IEEE Trans. PAS 7(1), 258 –263, (1992).
[9] R. Billinton, R.N. Allan, Reliability Evaluation of Power System. (Springer International Edition, 1996).
[10] R.N. Allan, R. Billinton, Probabilistic assessment of power systems. Proc. IEEE 88(2), 140–162 (2000).
[11] M. V. F. Pereira, L. M. V. G. Pinto, “A new computational tool for composite reliability evaluation”, IEEE Trans. on Power Sy stems, Vol. 7, No. 1,
Feb. 1992, pp. 258-264.
[12] C.T. Su, G.R. Lii, Reliability design of distribution systems using modified genetic algorithms. Electr. Power Syst. Res. 60, 201–206 (2002).
[13] W. F. Chang, Y. C. Wu, “Optimal reliability design in an electrical distribution system via polynomial-time algorithm”, Int. J. Electrical Power and Energy Systems, Vol. 25, No. 8, 2003, pp. 659-666.
[14] V. A. Popov, L. N. Canha, F. A. Farret, A. R. Abaide, M. G. Rodrigues, D. P. Bernardon, A. L. Konig, L. Comassetto, A. P. Licht, “Algorithm of Reliability optimization for operational planning of distribution systems”, IEEE/PES Transmission and distribution conf. and exposition : Latin America, 2004, pp. 523-528.
[15] R. Meziane, Y. Massim, A. Zeblah, A. Ghoraf, R. Rahli, “Reliability optimization using ant colony algorithm under performance and cost constraints”,
Electric Power Systems Research, Vol. 76, 2005, pp. 1-8.
[16] J. M. Sohn, S. R. Nam, J. K. Park, “Value-based radial distribution system reliability optimization”, IEEE Trans. on Power Systems, Vol. 21, No. 2,
2006, pp. 941-947.
[17] A. Bakkiyaraj, N. Kumarappan, “Optimal reliability planning for a composite electric power system based on Monte Carlo simulation using particle swarm optimization”, Int. J. of Electrical Power and Energy Systems, Vol. 47, May 2013, pp. 109-116.
[18] D. Louit, R. Pascual, D. Banjevic, “Optimal interval for major maintenance actions in electricity distribution networks”, Int. J. of Electrical Power and
Energy Systems, Vol. 31, No. 7-8, 2009, pp. 396-401.
[19]A.A. Sallam, M. Desouky, H. Desouky, Evaluation of optimal reliability indices for electrical distribution systems, IEEE Transactions on R eliability 39
(August (3)) (1990) 259–264.
[20]R Billinton, R. N. Allan, “Reliability evaluation of engineering systems: Concepts and techniques”, Springer International edition, 1992.
[21]Rajesh Arya, S.C. Choube, L.D. Arya, D.P. Kothari, “Reliability enhancement of a radial distribution system using coordinated aggregation based particle swarm optimization considering customer and energy based indices” Applied soft computing, 12 (2012) 3325–3331.
[22]R.V. Rao, V.J. Savsani, D.P. Vakharia, Teaching-learning-based optimization: an optimization method for continuous non-linear large scale problems.
Int. J. Inf. Sci 183, 1–15 (2012).
[23]R.V. Rao, V. Patel, “An improved teaching-learning-based optimization algorithm for solving unconstrained optimization problems”, Scientia Iranica, Vol. 20, No. 3, June 2013, pp. 710-720.
[24]R.V. Rao, V. Patel, “Multi-objective optimization of two stage thermoelectric cooler using a modified teaching-learning-based optimization algorithm”,
Eng. Appl. Artif. Intell., 26 (1) (2013), pp. 430-445.
[25]R.V. Rao, V. Patel, “Multi-objective optimization of heat exchangers using a modified teaching–learning-based optimization algorithm”, Appl. Math. Model., 37 (3) (2013), pp. 1147-1162.
Table 1- Statistics of best fitness function values as obtained using I-TLBO, PSO and CAPSO based on 30 numbers of runs.
Statistics Technique
I-TLBO CAPSO [21] PSO [21]
Average value of best fitness function values 18.6589 19.0522 19.2545
Standard deviation 0.0147 0.0252 0.1445
Minimum value of best fitness function 18.7845 19.0214 19.0738
Maximum value of best fitness function 18.1899 19.1230 19.5737
Table 2- Optimized values of failure rates and repair times as obtained by I-TLBO, PSO, CAPSO, and DFP techniques.
Variables Magnitudes as obtained by
TLBO PSO [21] CAPSO [21] DFP [21]
1 0.2312 0.2395 0.2387 0.2401
2 0.0915 0.0991 0.0973 0.0948
3 0.1935 0.2065 0.2005 0.2001
4 0.1768 0.1831 0.1839 0.1830
5 0.1916 0.1956 0.1977 0.1982
r2 7.7237 7.9565 7.7865 7.9261
r3 8.1345 7.7388 8.1588 8.2660
r4 11.4038 11.5192 11.7020 11.8820
r5 11.1467 11.3236 11.6383 11.2861
r6 7.9835 8.0000 7.9996 7.9757
r7 11.9832 12.0000 11.9931 11.9024
Objective function, J 18.3634 19.0738 19.0214 19.1054
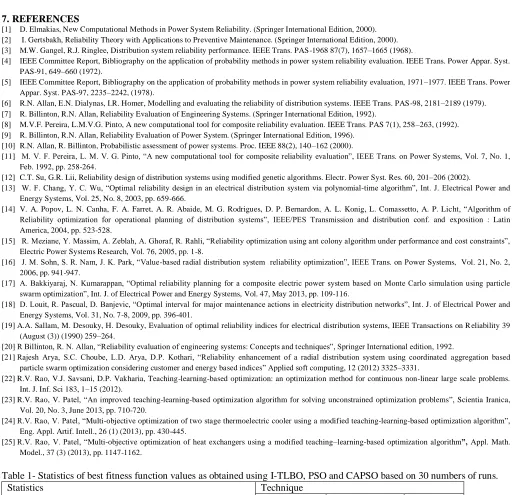
Table 3- Current and optimized reliability indices. S.
No.
Index Current values Optimized values Threshold
values I-TLBO PSO [21] CAPSO [21] DFP [21]
1
SAIFI
interruptions/customer 0.7200 0.4078 0.4150 0.4130 0.4127 0.5000
2 SAIDI hrs/customer 8.4500 3.3001 3.3056 3.3022 3.2991 4.0000
3
CAIDI hrs/customer
interruption 11.7361 7.9267 7.9657 7.9955 7.9933 8.0000
4 AENS kWh/customer 26.4100 10.000 10.000 10.000 9.9968 10.000