ANNUAL REPORT 2015
SEGES Pig Research Centre
ANNUAL REPORT 2015 is published by
SEGES Pig Research Centre Axeltorv 3
DK 1609 Copenhagen V 1st edition, March 2016 Layout: Marianne Kalriis, SEGES Printed by: Nofoprint as ISBN 87-91460-32-8
Financial support from the the EU and the Rural Development Programme under the Danish Ministry of Food, Agriculture and Fisheries is acknowledged under each individual project in the report where relevant.
introduction
THE YEAR 2015
Profits under pressure
The average Danish pig producer has only for brief periods been able to produce a profit from producing pigs. This is the harsh reality that have now persisted for some years.
The forecast bonanza in 2014 never happened because of the Rus-sian import ban, and the situation did not improve in 2015. We still have economic gaps to fill, and with a negative liquidity many pig producers still need to borrow money for the daily operation of their business. Hopefully, pig prices will increase in the years ahead. Within Europe pig production is currently falling and this will increase the chances of upgrading the forecasts rather than the opposite.
Competitive advantage
The pig price in Denmark averages DKK 10.80. This indicates that, in Europe, Danish pig producers are still competitive. Fortunate-ly, the Danish pig production industry possesses a number of strengths that will help maintain pig production in the next two decades. Our slaughterhouses have also regained their competi-tive edge, and that is essential in keeping us ahead of our compet-itors. In terms of efficiency, Danish pig producers are also at the highest end, and, through our co-operative system, we are able to find solutions that will keep ahead.
The total value of efficiency improvements and the increase in slaughter weight over the last ten years amounts to DKK 128 per finished pig. An annual increase of 0.6 weaned pigs per sow/year is the most striking feature of this progress, which is reflected in a national average of 30.6 pigs per sow/year. The 25% best herds wean 33 pigs per sow/year and the most ambitious now have their eyes on a level of 40.
Better business environment on the way
We look forward to the Danish government breaking away from a political mindset that it is acceptable for the Danish business environment to be tougher than that experienced by our competitors. In particular, we are challenged by over-strin-gent environmental constraints which need amending. The current restrictions on fertiliser application once again led to a disastrously low protein content in the grain harvested in 2015. The ‘harmony requirement’ for finishing pigs should be raised from 1.4 to 1.7 livestock units per hectare, and future environmen-tal approvals must treat facilities and land as separate entities. In the last ten years, an average production site in Denmark has im-proved its efficiency by increasing the production of pigs by 10% but with lower nitrogen emissions per pig place. The scheme for reporting changes is a huge step in the right direction, and, within the new rules, pig producers can increase their annual production by up to 600,000 finished pigs in existing units.
Danish pig producers need to be able to build new, large, modern pig facilities. To be competitive in Denmark, pig farmers need to be able to exploit the advantages of large-scale production.
Low investments
Since 2009, less than a fifth of the finisher units necessary to maintain the current production level are new facilities, and there is no indication that this is about to change. Consequently, pig slaughterings have fallen by 3.7 million pigs in Denmark and the export of weaners has risen.
This structural development may make sense to the ‘man in the street’, but it represents the wrong direction for both the industry
and for the Danish economy as a whole. It increases the vulnerability of the sector. We are faced with higher risk of importing disease, and can no longer control the production chain of the pigs that are exported.
Now the basis has been established for a modernising scheme that will partly replace the current environmental support under the EU Rural Development Programme that may move things in a more positive direction.
Antibiotics and animal welfare
Despite the increase in production from 22 to 32 million weaners in the last 15 years, antibiotic use has not increased. From 2013 to 2014, antibiotic use dropped by 5.6% and records show a 9.1% drop in the first half of 2015. MRSA was found in three out of four of 4 herds in a screening programme undertaken last winter. Given this level of incidence, eradication is simply not realistic or economically viable. We need to increase our attention to matters of hygiene and biose-curity both within the farm-gate and beyond. We can demonstrate a responsible approach and undertake to meet the targets set. A report from the Knowledge Centre for Animal Welfare reveals a significant improvement in animal welfare levels in the Danish pig herds, and this is confirmed in our own DANISH audits.
DanAvl
In recent years, DanAvl has developed increased exports of breed-ing stock and semen, and it is our ambition to strengthen this even further. The international demand for our products says a great deal about the high quality of Danish genetics.
African Swine Fever
African Swine Fever is now an everyday occurrence among wild boars close to the Russian border, and it would take just one act of care-lessness to create a catastrophe that would result from the disease entering Denmark. We all have responsibilities and must take every precaution possible. In particular, pig producers must be scrupulous regarding all biosecurity protocols including those relating to wash certificates, overseas staff on the farm and hunting trophies It is in our common interest to protect the country from all exotic pig diseases.
Our competitive edge
We are certain that within Denmark demand for pig meat will continue to rise. However, this does not have to be supplied from pork produced in Denmark. Experience shows that, if an industry is profitable, investments will follow. Our competitive advantage can be maintained. We have every opportunity to stay at the top in terms of efficiency, and it makes good business sense to do so. The pig industry generated around DKK 30 billion in exports but a more favourable business environment is crucial for the future.
Thank you for your support
The work of SEGES Pig Research Centre is based on close co-operation between pig producers, breeders and mul-tipliers, pig advisors, veterinarians, commercial suppliers, universities and the authorities. Together we will succeed with the task ahead in maintaining our competitive edge. Best regards,
Erik Larsen and Claus Fertin SEGES Pig Research Centre
Farmer Peter Sommer Jensen Region 3 (North and Midjutland) Vice-chairman, farmer
Søren Søndergård Region 2 (Funen and South Jutland)
ELECTED BY THE DANISH AGRICULTURAL & FOOD COUNCIL – PRIMARY BOARD
ELECTED BY THE DANISH AGRICULTURAL & FOOD COUNCIL – PIG SLAUGHTERHOUSES
ELECTED BY DANISH PIG PRODUCERS’ ASSOCIATION
Director Claus Fertin Farmer
Niels Aagaard Jørgensen Region 1 (Eastern part of
Farmer Peter Kjær Knudsen Farmer
Niels Christian Borup Farmer
Henrik Mortensen Farmer Søren Foged Overgaard
Farmer Palle Joest Andersen
Farmer Søren Bonde Chairman, farmer
Erik Larsen Torben Lyngsøe PovlsenFarmer Ejnar Kirk ThomsenSmallholder
ELECTED BY THE PIG PRODUCTION COMMITTEES
DIRECTOR
board
CONTENTS
Page
Strategy, organisation and activities . . . . 4-5 STATISTICS
Structural development . . . 6
Modernisation of finisher units. . . 7
Development in productivity . . . 8
Increase in productivity. . . 9
Production economy . . . 10
InterPIG . . . 11
GENETICS New Danavl strategy . . . 13
Genetic progress and sales. . . 14-15 Genetic research and development . . . 16-19 NUTRITION Nutrient standards and feedstuffs table . . . 20
Feed quality . . . 21
Feeding of weaners and finishers. . . 22-24 Feeding of sows. . . 25-27 ENVIRONMENT Environmental regulation . . . 28
Climate and ventilation in pig houses . . . 29
Environmental technology. . . 30-31 HOUSING Weaner and finisher facilities . . . 33-34 Pens for insemination and gestating sows . . . 35
Farrowing and lactation . . . 36-37 WELFARE Animal welfare, action plands and audits . . . 38
DANISH . . . 39
Mortality and daily gain . . . 40
HEALTH Serious pig diseases . . . 41
Biosecurity and safety wash . . . 42
Laboratory for Pig Disease. . . 43
SPF Health Inspection, SPF Health Department and Service Check . . . 44-45 AI semen control – ‘returners’ and hygiene during insemination . . . 46
Antibiotics for treating pigs . . . 47
Vaccination . . . 48 MRSA . . . 49 Chlamydia og leptospirosis . . . 50 Gastric health . . . 51 PRODUCTION MANAGEMENT Campaign: ‘Pattegriseliv’ . . . 52
Project: 30 feed units less . . . 53
‘The Pig Academy’ . . . 54
INFORMATION Published results 2014-15 . . . 55-56 Subject index . . . 57
Director Genetics Development Herd service IT Bøgildgård test station Innovation
Data capture Data management Feed efficiency Environmentaltechnology
Production
management Housingsystems Health Marketing Marketing & Communication SEGES PIG Academy Business Laboratory Health
Inspection DANISH Safety Wash Health Department Commercial tests. Grønhøj test station DANISH Transport and Production Standard DanAvl Service / support Marketing Sales Secretariat
STRATEGY, ORGANISATION AND ACTIVITIES
SEGES Pig Research Centre
On January 1, 2015, the Danish Pig Research Centre and the Knowledge Centre for Agricul-ture merged and into a new company, SEGES. The Danish Pig Research Centre is now known as SEGES Pig Research Centre.
Within the agreement, the research priorities of SEGES Pig Research Centre will still be decided by a Sector Board, comprising twelve pig producers.
It was also agreed that any profit or deficit of SEGES Pig Research Centre will be managed through a development account that is at the disposal of the board of the Pig Research Centre. This means that the anticipated income from the increasing international sales of DanAvl breeding stock may be returned to the Danish pig producers.
Budget and economy
The primary activities in SEGES Pig Research Centre are funded by the joint payment from Danish pig producers of around DKK 130 million or DKK 4 per pig. This originates from DanAvl fees and the Pig Levy Fund.
SEGES Pig Research Centre also handles a range of commercial activities, including the
Laboratory for Pig Diseases and SPF Health Inspection.
A 2014 audit of the projects in which SEGES Pig Research Centre received financial support from the European Agricultural Fund for Rural Development and the Danish Ministry of Food, Fisheries and Agriculture revealed non-compliance with a number of formal requirements. It should be stressed that not a single example was found where funds had been used for anything other than scientific activities.
This audit was a comprehensive examina-tion of projects dating back years, checking compliance between the following project documentation:
• Application • Implementation • Accounts • Final report
If non-compliances were revealed, funds must be repaid together with a fine. Regrettably, these costs have amounted to around DKK 60 million, mainly including legal and accountan-cy charges, with the result that the payment of an annual bonus to Danish pig producers was not possible in 2014 and 2015 but, hopefully, this will be re-instated in 2016.
Strategy
SEGES Pig Research Centre’s strategy includes the following main areas of activity:
• Competitiveness • Environment • Pig welfare
• Animal health and food safety • Knowledge transfer
• Policy and reputation
SEGES Pig Research Centre’s primary activities are to create value for Danish pig producers and strengthen the Danish pig industry. On an international basis, the structure of pig production is moving towards fewer, larger and more professional farms with the main focus on efficient production and competi-tiveness. Danish pig producers must be able to follow this trend and, at the same time, be able to meet market-driven and statutory demands as well as the general expectations for higher levels of animal welfare, health and food safety.
We must therefore actively support the com-petitiveness of Danish pig producers.
New organisation
In 2015, the organisation of SEGES Pig Re-search Centre is based on five departments or business areas:
• Genetics • Innovation • Marketing • Business • DanAvl
Genetics
This business area manages all basic breeding activities. The aim is to generate maximum genetic progress and to apply state of the art technologies in close cooperation with breed-ers and research establishments.
The pig producers on the Sector Board ultimately decide which breeding targets the industry should work towards.
The main principle of breeding is the overall economic optimisation of sow units and finish-er units to make the production of a single kilo of pork as profitable as possible.
A well-functioning, solid foundation will ensure Danish pig producers the best ge-netics. The annual value of genetic progress corresponds to around DKK 11 per finisher produced.
Innovation
This business area was established with the aim of generating knowledge and developing tools and products for immediate imple-mentation. The aim is to seek and generate applicable knowledge that can be implement-ed in practice as quickly as possible. Activities include feed efficiency, amino acid standards, Danish protein sources, milk supply in farrow-ing pens, organic pig production, measures to reduce tail biting, gastric ulcers and use of vaccines.
Research activities will focus on solutions to the challenges faced by Danish pig producers today and in the years ahead.
Annually, the Sector Board selects the activ-ities for the next year from a wide range of ideas and proposals submitted.
It is the intention to engage farmers, advisors and vets to a far greater extent in order to implement new knowledge and research as quickly as possible.
New projects for 2016
• Organic pigs – reduced feed consumption • Production in new large finisher units • Pens for loose lactating sows
• Enrichment as a measure to prevent tail biting
• Database – calculation of national averag-es
• Producing entire males with absence of boar taint
• New standard values for insemination and gestation pens
• Odour and ammonia-reducing initiatives for lowering the environmental impact of sow housing
• Maximum productivity, minimal risk of diarrhoea (amino acids for weaners) • Reduction in gastric ulcers • Optimum use of PCV2 vaccines • Advisory project ‘SPIR’
• Tools for benchmarking, surveillance and follow-up procedures
Marketing
In close cooperation with the Innovation department, the core activity of Marketing is to drive the immediate implementation of new knowledge.
The website www.vsp.lf.dk contains a series
of guidelines and knowledge in several languages. The most up to date knowledge is presented at the annual Congress for Pig Producers.
SEGES Pig Research Centre also conducts a wide range of demonstration projects and campaigns aimed at encouraging pig produc-ers to work harder in particular areas. Current demonstration projects include ’30 feed units less’ and ‘PattegriseLIV’ (piglet life).
Business
Animal health is a core activity and activities supporting this are now carried out by our Business department. The department’s role
also includes the management of the DANISH Product Standard and DANISH Transport Standard, as well as SPF Health Inspection, the Health Department and the Laboratory for Pig Diseases that all contribute to maintaining a high level of health in Danish pig herds. More recently work has focused on improv-ing safety wash procedures for lorries at the Danish borders and promoting biosecurity in Danish herds.
At a time when African Swine Fever has been detected close to the Russian border and PED has been found in Germany, it is crucial to have effective contingency plans in case of an outbreak of exotic animal disease.
DanAvl
One of the primary aims of DanAvl is to strengthen the competitiveness of Danish pig producers through the supply of superior genes, which will generate additional income for DanAvl.
In recent years, the export of breeding stock and semen has increased steadily. Today, DanAvl products are sold worldwide with Northern Europe as the main market. This position will be strengthened further on a commercial basis.
DanAvl is a ‘centre of co-operation’ where the interests of SEGES Pig Research Centre, breeders, multipliers, AI outlets and customers meet. The Sector Board decided to strengthen DanAvl’s marketing and sales activities with a view to increasing its market share in the years ahead.
Highest quality breeding stock is the result of dedicated breeding work in Denmark, and demand for Danish genetics continues to increase in many parts of the world.
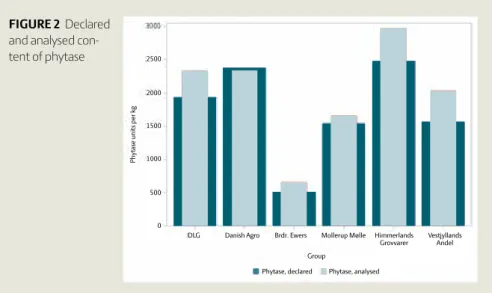
11,6% 12,5% 11,0% 8,6% 8,5% 8,9% 8,3% 9,1% 9,8% 0% 2% 4% 6% 8% 10% 12% 14% 2006 2007 2008 2009 2010 2011 2012 2013 2014 %
Trade in relation to livestock farms
Drop in livestock farms compared to previous year, DST Fall in number of pig herds compared to previous year, PRC 0,12 0,13 0,11 0,09 0,09 0,09 0,08 0,09 0,10 0% 2% 4% 6% 8% 10% 12% 14% 2006 2007 2008 2009 2010 2011 2012 2013 2014
% Trade in relation to livestock farms
Drop in livestock farms compared to previous year, DST Fall in number of pig herds compared to previous year, PRC
statistics
STRUCTURAL DEVELOPMENT
Number of pig farms
Records from SEGES Pig Research Centre show a total of 3,638 pig farms in 2014 in Denmark compared to 8,514 in 2004. If this trend con-tinues, just 1,300 pig farms would remain in Denmark in 2024. This trend does, however, vary from year to year.
Herd development in Denmark
Overall, the number of farms, including pig farms, is decreasing. The speed of this decline depends on multiple factors. Following the economic crisis in 2008, the number of registe-red agricultural trades relative to the overall number of herds dropped from around 11% to 8.5% as shown in figure 1. The figure also shows that the sale of agricultural property is regaining momentum but the level is still roughly 16% lower than before the crisis. In addition, figure 1 shows the percentage decline compared to the previous year. The dramatic drop in pig herds from 2007 is attri-buted to poor profitability in pig production. A large number of pig producers ceased producing pigs in 2008, but many continued working in the agricultural industry. The fall in numbers of pig herds varied bet-ween 6% and 9% in 2011-2014. In the last decade, the drop has averaged 8% annually.
Specialization
Danish pig farms can be divided into three categories:
• Integrated herds with both sows and finis-hers
• Finisher herds with no sows • Sow herds
On the basis of data from the official CHR register, SEGES Pig Research Centre analysed the degree of specialization within the three categories. The result is shown in table 1.
Trend 2013-2014
Sow herds were the only category that increa-sed in number from 2013 to 2014, though the increase was a modest 1.8%. The number of integrated herds fell by 7.7% and the number of finisher herds dropped by 7%. Overall, the number of pig herds dropped by 5.7% from 2013-2014.
Sows per farm type
Records show that there were roughly 700 sows per sow farm and 490 sows per integra-ted farm in 2014. In 2003, around 31% of the total sow population was housed on speciali-zed sow farms. By 2014, this had increased to 47%. This underlines an increasing specializa-tion over a period of years.
Multisite
Around 50% of all sow herds produce pigs on one site. For integrated herds the number is one third, but a multi-site operation would be a sensible solution for this category as keeping
sows and finishers on the same site is not good practice. 70% of all finisher herds produce on one site. They account for 42% within this ca-tegory or 26% of total slaughterings in 2014.
Pigs delivered to Danish
slaughterhouses
When records from 2013 are compared with records from 2014, there is change in the share of each herd category in terms of pigs delivered for slaughter.
The specialized finisher farms delivered 62.3% of all pigs delivered for slaughter at Danish slaughterhouses in 2014, which is largely the same as in 2013. If considered over a period of years, the importance of integra-ted farms to pigs slaughtered in Denmark is decreasing. Integrated farms delivered 42.1% of all pigs slaughtered in Denmark in 2009 compared to 35.2% in 2014.
Conclusion
Generally, pig farms in Denmark have become bigger and fewer in number, but the degree of specialization remains at the 2013 level.
Per Mille Levy Fund, project no. 9739.
TABLE 1Pig structure 2014
FACTS
Danish pig farms have grown in size from 2013 to 2014, but are no more specialized. The average number of pig farms in Denmark falls by 50% every seven to eight years compared to every ten years previously.
Finisher farms with no sows account for approximately 62% of all pigs delivered for slaughter in Denmark.
Sow farms had on average 700 sows in 2014, and integrated farms around 490 sows.
FIGURE 1 Registered trade in agricultural property compared with herds or drop in herds annually
Herds /herdSows Pigs finis-hed/herd
% of slaugh-terings in Denmark % of sow population % of single site farms Sow herds 684 701 714 2.50% 46.50% 52.0% Integrated herds 1,122 492 6,029 35.00% 53.50% 32.3% Finisher herds 1,832 0 6,529 62.30% 0.00% 69.8%
Small and out-dated facilities
Production of finished pigs in Denmark is in a state of crisis. This is underlined by the fact that in the period 2009-2013, investment constituted only 10-25% of what is necessary to maintain an unchanged scale of production. This amounted to a shortfall of roughly DKK 2.4 billion and has been the primary cause of the drop in slaughterings of 2.7 million pigs in the years from 2007 to 2014.
Many Danish finisher facilities are small and fairly worn-out. The average pig facility has about 9,000 pig places and a labour input cor-responding to a quarter of an employee/year. Experience shows that an industry that gener-ates a profit will attract new investments.
Stable sow population
In the years to 2020, a stable sow population of 1 million is expected. A general progress in efficiency is forecast which will produce 34-35 million weaned pigs in 2020.
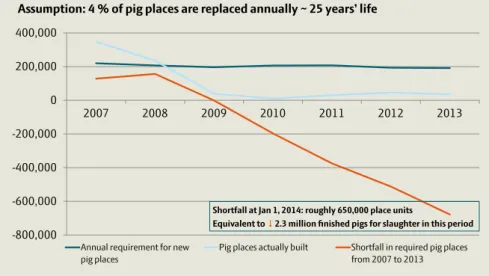
Investments ceased in 2008
In 2014, we see a shortfall of 650,000 pig plac-es within the 5 million required to produce 20 million finishers annually, cf figure 1. If this trend continues, forecasts predict that by 2020 only around 16.6 million finishers will be slaughtered in Denmark and weaner export will amount to 17-18 million weaners.
Can this trend be turned around
Globally, the production of pork will meet the requirements of the market. The question is whether Denmark will be able to regain our national competitiveness to put us back on the growth track and to ensure a sufficient supply of raw material to the slaughterhouses. The agricultural industry must be given far more flexible market environment and other initiatives that support a competitive finisher production must be introduced.
Urgent priority
In the next five years, it will be necessary to establish 285,000 new pig places annually or a total of 280 pig facilities with 5,000 pig places each. 175,000 of these will replace run-down facilities and the remaining 110,000 constitute an annual net increase in produc-tion capacity. Investments on this scale can be expected to lead to 3.0 million extra pigs finished by 2020, corresponding to a total an-nual throughput of roughly 21.5 million pigs slaughtered. In addition, forecasts suggest a
continuing export of 14 to 15 million weaners. The knock-on effect of this investment will be 4,200 new jobs and an increase in export value of DKK 4.5 billion a year.
Rural Development Programme
The setup of a modernisation scheme is part of the Rural Development Programme 2014-2020. The purpose is to fund investments in farm modernisation.
Funding is expected to amount to 20% of a pre-defined standard cost, as shown in table 1. To be eligible for funding, the applicant must be in possession of an approved financing plan when initial application is made. In 2016, DKK 126 million has already been set aside for modernisation of finisher facilities.
With funding up to DKK 740 per pig place, this amount will cover construction of roughly 170,000 new pig places.
Creation of a more flexible market
environment
A draft of new regulation indicates less rigid and more flexible conditions which will not
EXPECTED ADJUSTMENTS IN GENE-RAL FRAMEWORK CONDITIONS
• New, less stringent rules for fertiliser application
• Spreading of 170 kg N/ha from pig manure
• Flexible regulation of livestock farms • Relaxing the links between livestock numbers and land required for sprea-ding of slurry
• Discontinuation of the PSO levy. In 2015 this constitutes DKK 16.60 per pig. In the period 2011-2015, the PSO levy was increased by DKK 10.80 per pig.
statistics
MODERNISATION OF FINISHER UNITS
TABLE 1Expected standard costings for modernisation of finisher facilities in 20161
Project Standard cost Grant up to2
Building on bare land (new
con-struction) DKK 4,300/place unit 20 % = DKK 860
Addition to existing finisher unit DKK 3,700/place unit 20 % = DKK 740
Renovation of existing floor/pens DKK 1,600/ place unit 20 % = DKK 320
1 Basis for application: place units = m2 net pen area/(0.65 m2 x 1.05). (1.05 = increased number of pig places available
as hospital pens)
2 The anticipated funding required per place corresponds to DKK 15-17 per pig over 25 years at 6 % interest rate.
FIGURE 1 Construction of new finisher facilities in proportion to numbers needed
have an adverse environmental impact with-out adversely affecting the environment (for detailed information, see p 28).
In addition, pig farmers of the future must be able to run a pig production facility which is comparable to the 33% most efficient produc-tion sites today. This is an essential com-ponent of the business plan, which aims to ensure long-term and profitable production. Assumption: 4 % of pig places are replaced annually ~ 25 years’ life
-800,000 -600,000 -400,000 -200,000 0 200,000 400,000 2007 2008 2009 2010 2011 2012 2013
Annual requirement for new pig places
Pig places actually built Shortfall in required pig places from 2007 to 2013
Shortfall at Jan 1, 2014: roughly 650,000 place units
statistics
DEVELOPMENT IN PRODUCTIVITY
Changes in productivity
The overall efficiency of Danish pig produc-tion is assessed once per year. The figures show an annual increase in the number of pigs weaned per sow/year and in the daily gain achieved by finishers.
Development on sow breeding farms
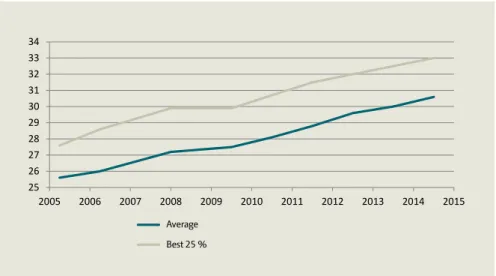
The improvement in productivity on the best 25% farms follows the average for all farms. The best 25% sow breeding units wean approximately 2.4 pigs more per sow/year than the average of all farms. Piglet mortality dropped to an all-time low in 2014 at 21.9%, which is attributed to an increase in the total number of piglets born and a fall in mortality in the farrowing unit.
Development on weaner farms
Productivity on weaner farms is unchanged compared with the previous year. Records show a daily gain of 441 g and a feed conver-sion ratio of 1.93 feed units per kg gain.
Development on finisher farms
Daily gain has increased by 15 g from 2013 to 2014. The best 25% farms achieved a daily gain that is approximately 50 g higher than the average for all farms, which is lower than last year. Put differently, the gap between the 25% best farms and the average farms has narrowed. The feed conversion ratio (FCR) remains largely constant, though, if correction is made for increased slaughter weight, we do see a slight improvement in FCR. This leads to an increase in production value of DKK 25 per pig place.
PROGRESS FROM 2013 TO 2014
• Sows weaned on average 0.6 more pigs per sow per year
• Total piglet mortality dropped by 0.4 percentage points
• Finisher FCR improved by 0.01 feed unit per kg gain
• Finisher daily gain improved by 15 g per day
• Weaner productivity remains un-changed 25 26 27 28 29 30 31 32 33 34 2005 2006 2007 2008 2009 2010 2011 2012 2013 2014 2015 Søer, fravænnede grise pr. årsso, gennemsnit
Søer, fravænnede grise pr. årsso, bedste 25 %
FIGURE 1Sows, weaned pigs per sow per year
150 175 200 225 250 2005 2006 2007 2008 2009 2010 2011 2012 2013 2014 2015 Smågrise, produktionsværdi pr. stiplads pr. år
FIGURE 2 Weaners, production value per pig place per year
400 460 520 580
2005 2006 2007 2008 2009 2010 2011 2012 2013 2014 2015 Slagtesvin, produktionsværdi pr. stiplads pr. år
FIGURE 3Finishers, production value per pig place per year
Average Best 25 %
DKK
10-year increase in productivity
The Danish pig industry has consistently im-proved productivity: the number of weaned pigs per sow/year keeps increasing, daily gain is increasing and FCR among both weaners and finishers is improving. These are the reasons why the cost of producing a kg carcase weight remains largely stable at current prices. They are also a factor explaining why settle-ment prices do not automatically rise with inflation and the cost of food becomes rela-tively cheaper. There are numerous ways of calculating the value of productivity improve-ments. One approach is to use the Theoretical Weaner Prices for 2015 in combination with the productivity levels in 2004 and 2014 to calculate a production price. Productivity must not be impacted by the increase in slaugh-ter weight and adjusted values (100 kg live weight) are therefore applied in these calcula-tions. The result is a comparison of a herd with 2004 productivity values with a similar herd, with 2014 productivity values applied. The changes in productivity are shown in table 1. The increase in productivity is an expression of genetic progress combined with improved nutrition, climate and management. It is the result of all research and development activi-ties of the Danish pig industry combined. In the period until weaning, productivity has improved by six pigs per sow/year and feed consumption has dropped by 9.4 feed units per weaned pig. In this period, daily gain among weaners increased by 22 g, feed conversion improved by 0.14 feed units and mortality dropped by 1.9 percentage points. A corresponding trend is seen for finishers: daily gain has increased by 95 g; feed conver-sion has improved by 0.1 feed units; mortality has dropped by 0.5 percentage points; and lean meat percentage has increased by 0.7 percentage points. This is a significant increase in productivity that measured with current 2015 prices has a significant economic impact on the production costs.
The price of producing a kg carcase weight in 2015 would have been considerably higher without this increase in productivity. At a slaughter weight of 77 kg, the production price of a kg carcase weight is DKK 1.32 lower under the current level of productivity com-pared with 2004. This corresponds to a saving of DKK 102 per pig. At a slaughter weight of 85 kg, the price is DKK 1.51 lower under the current level of productivity, which corre-sponds to a reduction in production costs of
DKK 128 per pig. The 8 kg increase in slaugh-ter weight lowered the cost price by DKK 0.30 net per kg, once correction is made for an in-creased feed consumption, a lower lean meat percentage and more carcase weight to share fixed costs. The value of the overall increase in productivity per pig is roughly DKK 54 until weaning; DKK 17 for weaners 7-30 kg; and DKK 31 for finishers 30-100 kg at a slaugh-ter weight of 85 kg. A continued increase in slaughter weight is important partly to lower the costs per kg carcase weight and partly
to raise the value of a finisher in proportion to a weaned pig. The latter is important to strengthen the competitiveness of Danish finisher producers in relation to countries such as Germany and Poland that import around 11 million Danish weaners. However, a higher slaughter weight must not jeopardise the marketability of the resulting pig meat. The profitability in pig production is deter-mined by costs combined with earning per kg carcase weight.
TABLE 1 Increase in productivity, 2004-2014
statistics
INCREASE IN PRODUCTIVITY
The increase in productivity is an expression of genetic progress combined with improved nutri-tion, climate and management.
Difference 2004-2014
Weaned pigs/sow/year +6
Sow feed per weaned pig -9.4
Feed units, 7-30 kg -0.14 Daily gain 7-30 kg +22 Mortality 7-30 kg -1.9 Feed units 30-100 kg -0.10 Daily gain 30-100 kg +95 Mortality 30-100 kg -0.5 Lean meat % +0.7
Production price per kg carcase
at a slaughter weight of 77 kg, DKK -1.32
Value per pig, DKK -102
Slaughter weight +8
Production price per kg carcase
at a slaughter weight of 85 kg, DKK -1.51
Total value of increase in productivity since 2004, DKK
statistics
PRODUCTION ECONOMY
Gross margin
Analyses from the DB Tjek (‘gross margin check’) software programme reveal a large potential for improved performance in pig production, when the correct strategic choices are made in terms of production systems. Fac-tors such as on-farm mixing of feed, larger unit size, SPF health status, own breeding stock and liquid feed all help increase gross margins. In weaner production, larger herds, herds carrying out on-farm mixing of feed and herds with a high health status all have a significant-ly better gross margin per sow/year than other weaner herds. A high health status and large batches raise the sales price of weaners. The improved gross margin is directly reflected in the financial result. The increased gross mar-gin obtained with on-farm mixing must pay for mixing equipment and for labour taken up mixing the feed. This gross margin of DKK 498 corresponds to a DKK 0.18 drop in feed price per kg. If costs for handling feed mixed on-farm amount to DKK 0.10 per kg, half of the
DKK 498 is still a worthwhile result overall. Productivity levels are slightly higher in herds with a high health status. This in particular affects weaner productivity where mortality drops and FCR improves. Medicine costs are slightly lower in herds with a high health status.
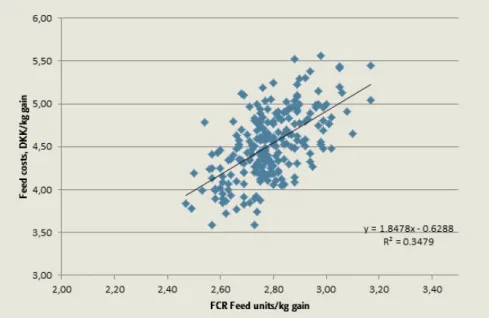
In finisher production, feed consumption and feed price are essential to the financial result. Figures 1 and 2 illustrate the effect of FCR and feed price on feed costs per kg gain.
TABLE 1 Gross margin per sow/year
Gross margin per sow/year
DKK 2006-2014
Feed mixed on-farm, minerals 498
500-1,000 sows/year 461
More than 1,000 sows/year 667
Myc 418
SPF 664
TABLE 3 Gross margin, finishers
Gross margin per finisher,
DKK 2004-2014
Ready mixed feed Feed mixed on-farm,
supplementary feed 24
Feed mixed on-farm, minerals 38
5,000-8,000 finishers 11
More than 8,000 finishers 19
Dry feed
Liquid feed 15
TABLE 2 Statistics, sow units
Sow units 30 kg
Comparison with
conven-tional MS SPF
Weaned pigs per sow/year 0.41 0.69
Farrowing rate NS 0.91
Medication, incl.
vaccinati-ons, DKK per sow/year -65 -107
Mortality post weaning -0.40 -0.55
FCR per kg gain,
feed units -0.03 -0.05
FIGURE 1 Impact of FCR on feed costs
Analyses demonstrate that the effect of the feed price on the feed costs is twice as signif-icant as on FCR. FCR is also important to the feed costs, and pig producers should therefore focus on improving the feed conversion ratio. Home-mixing finisher producers have a sig-nificantly better gross margin per finished pig than pig producers who buy ready-mixed com-pound feed. The use of supplementary feed lowers costs by DKK 24, which corresponds to a feed price that is DKK 0.11 cheaper per kg than purchased feed. Assuming costs for handling feed mixed on-farm amount to DKK 0.05 per kg, profit will increase by DKK 13. The use of liquid feed for finishers increases gross margin by DKK 15 per pig. The addition-al costs of using liquid feeding amount to DKK 8 per pig. Pigs fed liquid feed are typically fed according to a feed curve, and this often results in a slightly lower daily gain than ad-lib dry feeding. However, lean meat percentage
is slightly higher for pigs fed liquid feed and there are several possibilities for using alterna-tive ingredients that may lower the feed price. This is one reason why liquid feeding is an attractive option.
-160 -140 -120 -100 -80 -60 -40 -20 0 20 40 2000 2002 2004 2006 2008 2010 2012 2014 2016 DKK/pig
Figur 2: Forskelle i produktionsomkostning ved 30 kg, Danmark set i forhold til andre lande
DK-the Netherlands DK-Germany DK-Spain
What is InterPIG
InterPig is a global network of expert pig pro-duction economists that annually collects pig production costs and prices in each member country. InterPig enables SEGES Pig Research Centre to stay up to date with production costs in Europe and globally. The average profitability in each country is a guide to pig production expectations for the future. Figure 2 illustrates the importance of keeping up to date with trends as nothing remains static in a highly dynamic pig industry.
Competitiveness
Danish pig producers remain ‘world cham-pions’ in efficiency. The Netherlands are our closest competitor in sow production, but fell further behind in the latest year. In the Netherlands, pig producers weaned 1.28 pigs fewer per sow/year than Danish pig producers in 2014. Finisher productivity is also good in Denmark, but the overall advantage is smaller. Competitiveness is not simply being able to produce pork cheaply. In the UK, production costs in 2014 averaged DKK 12.72/kg pork versus DKK 11.27/kg pork in Denmark, but the pig price was DKK 2.80 higher and British pig production is currently expanding.
Profitability in 2014
Profitability in 2014 was negative for the average Danish pig producer, as was the case for most European pig producers.
The UK and Spain reported a decent profit in 2014. French and Danish pig producers ranked in the upper third with a small profit. Austria also reported a small profit, but only as long as calculations included an investment grant of 15% for construction of new pig housing. The average French and Danish pig producer had a deficit of DKK 0.38 and DKK 0.22 per kg, respectively.
As illustrated in figure 1, Brazil, Canada and the US all showed profits. High pig prices in the US and Canada were primarily caused by outbreak of PEDv. In 2014, US pig production dropped by 1.4% compared with 2013 and pork prices rose sharply as a result.
Brazil was not hit by PEDv and production is increasing and is primarily sold on the domes-tic market at good prices.
Weaner competitiveness
Figure 2 shows the marginal production cost for a 30 kg pig in Denmark compared with other countries over time.
It is clear that Germany is catching up with Denmark: years ago the cost of producing a single weaner in Denmark was DKK 140 lower than in Germany – today the difference is only around DKK 60 per weaner. In that same pe-riod, Spain has overtaken Denmark, whereas the Netherlands are falling behind.
Development in pig numbers
The InterPig network was established in 2002, and since then the sow population in EU-15 has dropped by a sixth.
The smallest drop in the sow population is seen in the Netherlands and Denmark, where every 13th sow has disappeared, while in that same period the population in Germany has dropped by one fifth.
In EU-15 the number of pigs slaughtered increased by 5% in that same period as sow productivity has increased. However, in most countries the number of pigs slaughtered has dropped.
statistics
INTERPIG
Only Spain, Belgium and Germany have seen a rise in the number of pigs slaughtered. In Ger-many, the number increased by 33% in the period 2002-2014 as the import of weaners from Denmark and the Netherlands increased. However, since 2011, the number of slaugh-terings in Germany has remained stable.
FIGURE 2Difference in production costs at 30 kg, Denmark compared with other countries
FACTS
• Denmark ‘world champions’ in effi-ciency, but not in profitability per kg pork produced.
• Denmark ‘world champions’ in pigs weaned per sow per year.
• Spain ‘European champions’ in pro-duction cost per kg pork produced • Profitability varies greatly over time.
-1,29 -0,81 -0,77 -0,61 -0,54 -0,38 -0,22 0,11 0,14 0,41 0,90 1,13 1,85 2,62 4,24 12,05 12,93 11,93 11,58 13,57 11,32 11,27 12,01 10,89 10,64 10,9 12,72 9,35 8,91 8,86 -4 -2 0 2 4 6 8 10 12 14 16 NL Ir el an d G er m any Bel gi um Sw ed en Fr anc e Denm ar k Au str ia Fr anc e3 3 Denm ar k3 3 Sp ai n UK Br azi l S C Canad a US Profitability DKK/kg
Profitability DKK/kg Production costs per kg carcase weight
Annual genetic progress is one
of the most important factors in maintaining
a consistent improvement in efficiency.
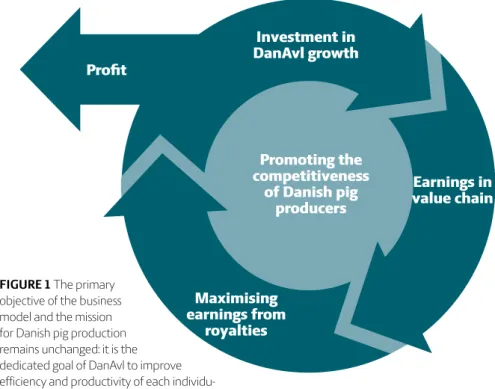
Investment in
DanAvl growth
Profit
Promoting the
competitiveness
of Danish pig
producers
Maximising
earnings from
royalties
Earnings in
value chain
genetics
NEW DANAVL STRATEGY
Increased productivity and efficiency
The need for improved productivity and efficiency in pig production globally further highlights the advantages of DanAvl. There is a ready market for DanAvl products with their unique genetics and a strong focus on production advice, health parameters and meat quality issues.
Customers
DanAvl’s customers are pig producers who face a highly volatile and competitive market environment internationally. European pig production is static while production in South America and Asia is increasing.
In order to maintain or improve competi-tiveness, the pig industry must continue to improve its efficiency, producing more volume with less input. Annual genetic progress is one of the most important factors in maintaining a consistent improvement in efficiency. DanAvl’s breeding objectives remain to pro-mote efficiency and productivity of their pig producing customers. This was and will always be the foundation of the DanAvl business.
Maintaining competitiveness
Since 2008, DanAvl has shown continuous expansion and is today a strong international brand. DanAvl has a significant market share in Europe, but there is still a further potential here as well as in fast-growing markets such as South America. DanAvl is still a leading player in the German market, but sales in Southern Europe have also gained momentum in recent years, and there has been an annual increase in sales in both Spain and France.
Future DanAvl strategy
In order to realise its full potential, DanAvl is currently preparing a new strategy to consolidate its position as one of the top three breeding programmes in the world.
The prime objective of DanAvl is to promote the competitiveness of the Danish pig indus-try. Nothing in our future work will compro-mise this aspiration (see figure 1).
To utilise the potential of Danish pig genetics, DanAvl’s value offer will be sharpened, namely the benefits for our customers in choosing DanAvl solutions to improve the productivity and efficiency of their pig production. DanAvl will focus even more on the needs of individual customers as well as markets, through increased market dialogue, insight and knowledge of what the producers of tomorrow will need.
DanAvl’s value offers will continue to be based on Danish genetics – multiple tests have repeatedly confirmed that Danish genetics are the most efficient genetics when measured on economic KPIs. We will also focus on health, meat quality, conformation and service and advice before, during and after sale of our
products. This work cannot be performed without making structural and organisational changes. A further consolidated value chain will form the core of the company to make DanAvl an even stronger breeding programme and brand with customer focus offering unique solutions.
FIGURE 1 The primary
objective of the business model and the mission for Danish pig production remains unchanged: it is the dedicated goal of DanAvl to improve efficiency and productivity of each individu-al pig producer. This was individu-always and will individu-always be at the core of DanAvl’s activities.
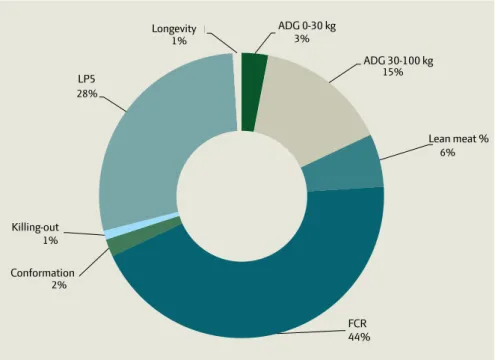
TABLE 1 Genetic progress over 3 years for each trait and breed and average of a D(LY) finisher.
TABLE 2 Importance of genetic progress for gross margin, average of 3 years
Genetic progress Economic weighting, DKK Value of genetic pro-gress, DKK (assum. 100 % dissemina-tion) Disssemi-nation in production % GM im-provement in produc-tion, DKK/ finisher Gain ( 30-100 kg) 17.5 0.13 2.28 80% 1.82 FCR -0.034 -147 4.95 80% 3.96 Lean meat % 0.12 9.7 1.14 150% 1.71 LG5** 0.24 9.8 2.37 85% 2.01 Conformation 0.04 12.5 0.49 100% 0.49 Gain (0-30 kg) 3.17 0.11 0.35 100% 0.35 Killing out -0.03 -5.1 0.17 100% 0.17 Longevity** 0.017 42.5 0.71 100% 0.71 Average of 3 years
and all breeds 12.45 11.22
** Yorkshire and Landrace 50 % contribution each.
Purebred litters Hybrid litters Code 100* Code 200** Code 100* Code 200**
Duroc 3,918 1,672 63 1,042
Landrace 5,150 10,868 5,748 81,453
Yorkshire 4,999 15,865 10,156 81,453
TABLE 3 Number of purebred and hybrid litters in the past year
* Code 100: Litters born in nucleus breeding herds. Litters can be used by all herds.
** Code 200: Litters born in either nucleus or multiplication herds, but cannot be used in future nucleus breeding.
Purebred females
Nucleus herds* Multiplication herds, DK Multiplication herds, int’l
Duroc 1,786 -
-Landrace 2,206 31,966 13,296
Yorkshire 2,367 28,752 19,565
Total 6,359 60,718 32,861
TABLE 4 Purebred females in nucleus breeding and multiplication herd, August 2015
Genetic progress
Table 1 shows the genetic progress in each trait for the three breeds in the programme of the past three years and the average progress in D(LY) (Duroc Landrace x Yorkshire) finishers for that same period.
Daily gain, in the period 0-30 kg as well as 30-100 kg, has improved since last year’s annual report, which is attributed to progress in both the Landrace and Yorkshire strains. Feed con-version has also improved, which is attributed to progress in Duroc lines in particular. Progress in ‘Live Pigs per Litter at 5 Days’ (LP5) and longevity for the sow breeds has also improved: LP5 is now 0.24 vs 0.19 last year, and longevity is now 0.0017% vs 0.0006% last year.
Table 2 shows the economic importance of genetic progress. The table as well as the calculations are updated according to the new economic weightings, described in the Ge-netic Development section. The calculations are based on the economic values used in the index calculations and on the dissemination of the traits in the production chain. Genetic progress and improvement in gross margin in production are assigned a higher value, which is attributed to the implementation of genom-ic selection in 2010-2011.
Herd structure
Currently, 26 nucleus breeders have a contract with SEGES Pig Research Centre, and in total they represent 38 herds with purebred ani-mals: 12 Duroc, 13 Landrace and 13 Yorkshire. As of August 2015, 134 Danish multiplication herds were approved and of these 28 had some affiliation to a nucleus breeding herd. In table 3, the number of purebred litters and hybrid litters produced in the past year is shown, and in table 4 the number of sows currently on contract with SEGES Pig Research Centre (as at August 2015) is shown.
SEGES Pig Research Centre also has contracts with 88 international multiplication herds.
Production
In the past year, 2,558 boars were perfor-mance tested at Bøgildgård Boar Testing Station of which 450 were Landrace Duroc boars and 443 Yorkshire boars as Bøgildgård Boar testing Station was used for testing D(YL) hybrids this past year (for more information, see Genetic Development). The results of the performance tests are shown in table 5.
genetics
GENETIC PROGRESS AND SALES
Breed Year Daily gain (30-100 kg), g/day FCR, FUp/ kg gain Lean meat, % LP5, no. Con- forma-tion, points Daily gain (0-30 kg), g/day Killing out, kg Lon-ge- vity, %
Duroc ave. 3 yrs 20.0 -0.039 0.17 - 0.02 4.0 -0.04
-Landrace ave. 3 yrs 13.3 -0.029 0.08 0.22 0.06 2.0 -0.05 -0.03
Yorkshire ave. 3 yrs 16.7 -0.029 0.04 0.27 0.05 2.7 0.00 0.00
Ave. 3 breeds 3 yrs 17.5 -0.034 0.12 0.24 0.04 3.2 -0.03 0.017
In nucleus breeding herds, 40,215 males and 51,441 females were performance tested. Tables 6 and 7 show the average production level of the past year for males and females, respectively, in nucleus breeding herds.
Litter size and live piglets at 5 days
Table 8 shows the litter size of purebred nu-cleus litters in the past year: the LP5 average 14.2 for Yorkshire (vs 13.8 last year), and 12.3 for Landrace (vs 12.4 last year).
AI boars
Table 9 shows the current (August 2015) index for all three breeds and the number of active boars at Danish AI centres. The average index level for active Duroc boars has increased from 113.4 to117.5, and index levels for Landrace and Yorkshire boars have decreased slightly. In addition, table 9 also shows the number of boars registered at Danish AI cen-tres and their average working age. In total, 12 distributors (August 2015) have 3.147 boars in 70 AI centres internationally. Table 10 shows the distribution of breed and index for AI boars both in Denmark as well as internationally. The index levels for Landrace and Yorkshire boars internationally have increased by 2.9 and 2 index points, respec-tively.
Sale of semen and breeding stock
Sale of Duroc semen nationally as well as internationally continues to increase: global sales have increased by 58.6% compared to last year.
The numbers of on-farm replacement sows also continue to increase globally: records show an average of 581,399 on-farm replace-ment production sows compared to 424,519 the previous year. Sale of genetic breeding stock is shown in table 11.
The sale of purebred females in Denmark as well as the export of purebred females de-creased from 2013 to 2014. The sale of hybrid females continues to increase domestically as well as internationally. The decline in the sale of purebred females is attributed to the Russian import ban.
Fees on genetic material
The income from fees on sales of genetic material totalled DKK 115.9 million in 2014. In 2014, approximately 59% of the fees originated from international sale of genetic products.
TABLE 5 Ave. prod. results from performance-testing at Bøgildgård Boar Testing Station the past year
TABLE 6 Nucleus breeding herds – average production results for boars the past year
Breed Number
Daily gain, g/day
Lean meat % Confor-mation, points Scan-ning obj, mm Scanning weight, kg 0-30 kg 30-100 kg Duroc 7,948 400 1,172 61.3 2.93 7.3 95.7 Landrace 16,064 372 1,045 62.6 2.99 8 94.6 Yorkshire 16,203 359 1,010 61.7 3.13 8.5 94.2 Total 40.215
TABLE 7 Nucleus breeding herds - average production results for females the past year
Breed Number
Daily gain, g/day
Lean meat % Confor-mation, points Scanning objective, mm Scan. weight, kg 0-30 kg 30-100 kg Duroc 10,185 403 1,107 61.5 3.01 7 95.2 Landrace 21,389 377 975 63 3.09 7.5 94 Yorkshire 19,867 362 962 61.5 3.19 8.9 94.1 Total 51,441
TABLE 8 Nucleus breeding herds – litter size of purebred litters the past year
Breed Litter size LP5 Per cent litters from first parity sows
Duroc 9.5 - 73.3
Landrace 15.6 12.3 67.3
Yorkshire 16.7 14.2 63.8
Breed Boars entered the past year of boars departed Months in service in the past year
Active boars, August 2014
Index for active boars, August 2014
Duroc 2,840 12.5 3,115 118
Landrace 715 5.9 425 128
Yorkshire 837 6.0 457 129
TABLE 9 Index and time in production of AI boars
TABLE 10 DanAvl AI boars sold in Denmark and internationally, August 2015
Internationally Denmark Number Index Number Index
Duroc 2,250 101 3,115 118
Landrace 457 111 425 128
Yorkshire 440 114 457 129
Total 3,147 3,997
TABLE 11 Sale of genetic breeding stock from DanAvl in 2014 in Denmark and internationally
2013 2014
Denmark Int’l Denmark Int’l
Purebred females 5,132 28,693 4,695 22,000
Hybrids 249,895 421,347 257,853 440,247
DD and XX boars 543 2,277 432 2,071
LL and YY boars 16 1,562 17 1,287
DD and XX semen, doses 4,864,952 1,116,687 5,127,527 1,771,001
LL and YY semen, doses 232,488 - 218,005
-On-farm replacement production
sows internationally* - 424,519 - 581,399
* Sale of LL and YY semen internationally is not recorded; instead the number of on-farm replacement production sows is shown
Breed Number Daily gain (30-100 kg), g/day FCR, FUb/kg gain Lean meat % Killing out % Scan-ning objecti-ve, mm Duroc 2,558 1,122 2.3 62 25.4 7.3 Landrace 450 1,017 2.4 60.8 25.9 7.7 Yorkshire 443 918 2.48 60.5 25.6 8 Total 3,451
Breeding objectives
The breeding objectives for Duroc, Lan-drace and Yorkshire and economic weights were revised in June 2015. They need to be regularly revised to take account of genetic progress, changes in costs and pig prices and the development of new traits in the breeding objectives.
The latest revision of the breeding objectives for Duroc, Landrace and Yorkshire was carried out in March 2011. Since then, prices of energy and pig feed have soared, the number of live born piglets per litter has increased as has the number of piglets reared by sows, weaner gain has dropped and finisher gain has increased, and payment for lean meat percentage at slaughter has been revised. Based on these significant changes, a new set of economic weights was calculated for the traits included in the breeding objective. Table 12 presents the figures for 2011 and 2015. With the exception of the economic weight for longevity and conformation, all economic weights were revised.
The economic contribution for the traits in the breeding objective was also revised and is shown in figures 1 and 2. These figures cannot be compared directly with the corresponding figures in last year’s report as the genetic parameters were updated.
Analytical methods in DanAvl’s existing bio-economic simulation model (BESI) were also reviewed. It was decided not to add new traits to the breeding objectives. Boar taint was considered, but will not be added at the moment, due to uncertainties relating to trait definition and insufficient knowledge of the economic value of boar taint.
Social interactions
The project “Selection based on interactions between pigs” found a socio-genetic effect on daily gain in Duroc and Yorkshire, which is
genetics
GENETIC RESEARCH AND DEVELOPMENT
expected to improve genetic progress in the future. However, before it can be implemented in the breeding programme, the socio-genetic model needs to be further developed, a more consistent and improved prediction ability is required and validation of the effect on behaviour is necessary. This will be further in-vestigated in the new project “Breeding for feed efficiency and behaviour among pigs in groups” which is financially supported by the Green Development and Demonstration Programme. The structure and documentation of on-farm testing were revised as of January 1, 2014 because the data available regarding social interactions when the project was initiated were no longer applicable. Only data from Bøgildgård test station or data collected after the structural changes were implemented can be used for this purpose.
It is essential that pigs that are removed
from pens during the trial be included in the socio-genetic analyses. Not only on account of unstable estimates when the data basis chang-es, but simply because this information is like-ly to be very relevant in terms of socio-genetic effects. Using data from Bøgildgård, estimates for the direct and the socio-genetic effect in Duroc were compared depending on whether a) all pigs were included, b) culled or dead pigs were excluded, or c) groups with culled or dead pigs were excluded. In terms of daily gain, exclusion of culled pigs (b) led to a reduc-tion in the socio-genetic effect of around 29% compared with all pigs (a), whereas exclusion of the whole group (c) led to a reduction of “only” 18%. In terms of feed intake, exclusion of the culled pigs (b) resulted in a reduction of 29%, while exclusion of whole groups (c) reduced the socio-genetic effect by roughly 86% - in other words, the socio-genetic effect was lost. Based on these results, data where not all pigs in the pens are known cannot be used for estimating socio-genetic effects. A preliminary model for estimation of socio- genetic effects was developed on the basis of the data collected after the structural changes were implemented. The model uses daily gain as the point of departure, and results reveal a significant socio-genetic variation for gain in Duroc and Yorkshire, but not Landrace. This socio-genetic variation contributes to an increased total heritability. The preliminary estimates for heritability and descriptive data collection are shown in table 13.
FIGURE 1 Relative economic of contribution traits in the breeding objective for DanAvl Landrace
and DanAvl Yorkshire.
TABLE 12 Economic weights in the breeding objectives in 2011 and 2015
Trait 2011 2015 Unit Breed
Longevity 85 85 DKK/% LL, YY
LP5 22 19.6 DKK/pig LL, YY
Conformation 12.5 12.5 DKK/points LL, YY, DD
FCR -133 -147 DKK/FU/kg LL, YY, DD
Lean meat % 8.6 9.7 DKK/% LL, YY, DD
Daily gain (0-30 kg) 0.09 0.11 DKK/g/day LL, YY, DD
Daily gain (30-100 kg) 0.14 0.13 DKK/g/day LL, YY, DD
Killing-out % -4,9 -5,1 DKK/kg LL, YY, DD DGL 0-30kg 3% DGL 30-100kg 15% Kød% 6% Foderudnyttelse 44% Styrke 2% Svind 1% LG5 28% Holdbarhed 1% Longevity ADG 0-30 kg ADG 30-100 kg Lean meat % FCR 44% Conformation Killing-out LP5
The model is highly sensitive to (absent) systematic effects that may contain variance between groups, and a conservative approach was therefore selected where adjustments are made for sections. Analyses revealed no sig-nificant social environmental effects or effect of group size on the extent of the socio-ge-netic variance. The prediction ability of the socio-genetic model was in some cases, but not consistently, better than the conventional genetic model.
Stochastic simulations were made with as-sumed genetic parameters that corresponded to the estimated (DD) parameters to assess the potential genetic progress of selection for direct and socio-genetic effects, compared with selection based on the direct genetic effect alone. These simulations demonstrate that, if the estimated parameters prove to be true, a 13% increase in genetic progress may be possi-ble in the future with the socio-genetic model compared with the conventional model. Overall, this indicates that there are socio-ge-netic effects in Duroc and Yorkshire that may in future contribute to an improved genetic progress. However, as mentioned, implemen-tation of the socio-genetic model in the breed-ing programme requires further development of the model to ensure more consistent prediction ability and validity.
The project received financial support from the Pig Levy Fund and the EU and the Rural Development Programme under the Danish Ministry of Food, Agriculture and Fisheries. Journal no. 32101-U-13-00238.
Breeding for feed efficiency and
behaviour within pigs in groups
This is a comprehensive project that runs from July 2015 to June 2019. The project receives financial support from the Green Development and Demonstration Programme and aims at im-proving genetic progress for feed efficiency and improving social behaviour in the Danish pig
breeding programme, including reducing tail biting and aggressive behaviour. This will be done by combining group information, support traits, advanced statistical models and genomic information. However, feed efficiency and be-haviour are extremely complex traits to breed for as they are extremely difficult to record. The development of new methods for analysing group information and genomic knowledge generated in recent years made this project possible. By combining the new methods, we expect to be able to use their combined potential to increase genetic progress for these difficult traits. Combining these methods was made possible through our collaboration with the Centre for Quantitative Genetics and Genomics at Aarhus University that is a leader in quantitative genetic and genomic research.
In this project, group information will be uti-lised in two ways that also complement each
other. We will use observations of feed conver-sion at group level which, in a cost-effective manner, will improve the accuracy of the as-sessment of the pigs’ breeding values. We will also use observations on pen mates to assess the pigs’ social breeding values. Pigs’ social breeding values are expected to reflect vari-ations in the pigs’ social behaviour in groups, but are in fact based on traditional traits such as daily gain and feed conversion. We will also make direct recordings of traits related to behaviour and welfare to be able to assess the effect of selection for social breeding value. This will make improved genetic progress for feed efficiency possible while we will, at the same time, be able to include behaviour in the Danish pig breeding programme.
The project received financial support from the Green Development and Demonstration Programme. Journal no. 34009-14-0849.
LP5 also improves rearing ability
Litter size has increased significantly among Danish sows in the last decades: before 1992, when breeding for litter size was introduced, litter size averaged 10 and 9.5 for first parity Landrace and Yorkshire sows, respectively. After 2004, when ‘Live Pigs per Litter at 5 Days’ (LP5) was implemented, litter size has in-creased further. The most recent records from herds in the breeding system show a total of 12.7 live pigs five days after farrowing among first parity Landrace and Yorkshire sows. With
FIGURE 2 Relative economic contribution of traits in the breeding objective for DanAvl Landrace Duroc
TABLE 13 Data collection and preliminary estimates for the project
“Selection based on interactions between pigs”
Duroc Landrace Yorkshire
Number of pigs 28,600 55,200 57,500
Number of pens* 2,400 5,000 4,800
Av. parentage** 0.11 0.19 0.17
Direct heritability 0.11 0.20 0.25
Total heritability 0.38 - 0.35
* Averagely 12 pigs/pen (8-15 pigs) ** Based on six generations
›
Svind 2% DGL 0-30kg 5% DGL 30-100kg 23% Kød% 13% Foderudnyttelse 52% Styrke 5% Kødprocent ADG 0-30 kg ADG 30-100 kg Lean meat % FCR 52% Conformation Killing-outthis increase in litter size sows must be capable of rearing more piglets.
During the development of LP5 fifteen years ago, sows’ rearing ability was a focus point. Litter weight and litter size of the piglets suckled by the sow for three weeks post-far-rowing were included in the consideration of improved breeding objectives for fertility. The intention was to use litter weight three weeks after farrowing as an objective for the sow’ rearing ability. Litter weight and litter size were therefore recorded in 7,126 Landrace litters and 5,147 Yorkshire litters.
Results show heritability of litter weight as well as the number of pigs still being reared by the sow three weeks after farrowing. Heritability is highest for litter weight at around 0.09, and only around half of this for the number of pigs. However, results do show a clear favourable genetic correlation between the number of pigs and the litter weight. High litter weight is mainly seen in families with large litters. There was no correlation between total piglets born and litter weight: thus, high litter weight was observed in sows that delivered many piglets as well as in those that delivered few piglets. Results also revealed a clear favourable corre-lation between LP5 and litter weight: in litters where LP5 numbers are high, litter weight is also high up to three weeks post-farrowing. This indicates that when we breed for LP5 we also improve the sows’ rearing ability. These results confirm that breeding for LP5 not only helped increase the number of live pigs. It also helped improve sows’ rearing ability through an increase in the weight of the litter up to three weeks post-farrowing. As litter weight is heritable, it will be possible to increase the sows’ rearing ability slightly if litter weight is included in the breeding objec-tive. The close genetic correlation between litter weight and LP5 seems to recommend reconsideration of LP5 as part of the breeding objective, as the breeding objective would then include two, very closely related traits.
Genomic selection
with three-way hybrids
For the last two years, we have worked on de-veloping models for genomic selection using data from three-way hybrids. Roughly 3,000 pigs were produced and data are now ready for testing in the new statistical and genetic tools developed by the Project Group. Analysis of data is a challenge as three-way hybrids are further away from the pure bred nucleus, herd. Hence new models and new ideas are required to determine how we can use this
in the breeding assessment with genomic selection in the future. The models should also be capable of handling heterosis (domi-nance). With data from three-way hybrids, it is possible to include more traits, such as pH at slaughter, that cannot be recorded in the purebred nucleus.
At Bøgildgård test station, phenotypic data were collected in conjunction with recordings of growing pigs and individual recordings were made of feed conversion. Data are collected for daily gain, feed efficiency, fat thickness, mortality, slaughter quality measured as lean meat percentage, pH and boar taint. Hair samples are collected from all parents and all three-way hybrids will be subject to DNA anal-ysis. Genomic data will be generated routinely on all pigs and their parents. Data will now be analysed and used partly to validate the new models and partly to assess if and how best to practically apply data from three-way hybrids in genomic selection.
Model calculations proved that it is possible to obtain more heterosis in hybrids by using DNA information. Calculations show that for the breeds that are similar to each other at DNA level we can use the heterosis that exists between breeds only by combining DNA information with trial recordings of purebred animals. In such cases, DNA information and recordings from hybrids are less important. When, on the other hand, purebred animals differ at DNA level we get a better utilisation of heterosis by gathering DNA information and trial recordings of hybrids. The project ends in 2016.
The project is undertaken in cooperation with Aarhus University and received finan-cial support from the Green Development and Demonstration Programme. Journal no. 34009-12-0540.
GenSAP
SEGES Pig Research Centre is one of the participants in an international consortium called GenSAP (Centre for Genomic Selection in Animal and Plants) that consists of 15 international partners and is led by Aarhus University. The consortium develops new the-ories within genomic selection. The partners in the consortium are representatives from the animal and plant industries in Denmark and from international genetic institutes. We are the only pig breeding company in the consortium. As some of the best scientists in livestock breeding and genetics participate in the consortium, we have a unique opportunity
for jointly generating new knowledge in this area. We participate in the aspects concerning breeding and selection theories. Knowledge generated in this area will give us a head start in genomic research that we can use in DanAvl. Model calculations made in this consortium demonstrated that our current breeding tool, EVA, may restrict in-breeding further by using its DNA information. By using a combination of EVA and genomic informa-tion, it is possible to reduce parentage effects between parents and reduce in-breeding without jeopardising genetic progress. This is an important outcome for us as less in-breed-ing will eventually increase genetic progress. The project ends in 2017.
EVA in the white breeds
EVA is nearly ready for implementation in the white breeds. Implementation will follow the same procedure as for Duroc, and EVA will be used on boars in quarantine and at AI stations for selection of boars for breeding and for assigning nucleus litters to these boars. All breeders will have access to all boars in relation to their proportionate litter quota. However, the white breeds differ from Duroc in a few areas. For instance, there are fewer white boars for AI than Duroc as they are only needed for breeding and multiplication. The percentage of boars selected for quarantine and AI is therefore lower than for Duroc and EVA must therefore be capable of optimising genetic progress and the speed of in-breeding. Furthermore, their breeding objectives also in-clude maternal traits, where genetic progress depends on family information and where information is available at a late point in the boars’ lives. They may vary more in index and for a longer time than Duroc. It is essential that breeders are assured of access to semen from EVA boars to a greater extent today than previously, as the implementation of EVA will restrict the access to semen as the number of boars selected by EVA for breeding will be lower than today. It is therefore proposed that EVA also replaces the current family-related restrictions on access to the quarantine and takes over pre-selection of boars for quaran-tine. A new simulation study indicates that this may result in long-term genetic progress and a decline in in-breeding. It is also proposed that EVA breeding boars be reserved for breeders so that they can only be used for purebreds as long as there is a demand for this. This should solve the challenges with access to semen. Fi-nally, it should also be possible to assign litter to boars for a longer time than with Durocs to take account of possible increases in index due to LP5.
Litter size has increased significantly
among Danish sows in recent decades.
NUTRIENT REQUIREMENT STANDA RDS This is the 22nd edition of the Danish nut
rient standards.