SIMULATION AND MODELING FOR IMPROVING ACCESS TO CARE FOR UNDERSERVED POPULATIONS
Iman Mohammadi
Submitted to the faculty of the University Graduate School in partial fulfillment of the requirements
for the degree Doctor of Philosophy
in the School of Informatics and Computing, Indiana University
ii
Accepted by the Graduate Faculty of Indiana University, in partial fulfillment of the requirements for the degree of Doctor of Philosophy.
Doctoral Committee
______________________________________ Josette F. Jones, RN, PhD, Chair
______________________________________ Edward Berbari, PhD October 29, 2018 ______________________________________ Xiaowen Liu, PhD ______________________________________ Huanmei Wu, PhD
iii © 2018 Iman Mohammadi
iv DEDICATION Dedicated to my parents and my sister.
v
ACKNOWLEDGEMENTS
I would like to start by expressing my deepest gratitude to my advisor, Dr. Huanmei Wu, for her brilliant guidance, caring, patience, and providing me with support for conducting this research. I am sincerely grateful to my thesis committee chair Dr. Josette Jones for her tremendous help during my PhD studies and thesis work. She has been supporting me both morally and scientifically since the days before I was even admitted to the PhD program. I would like to thank my thesis committee member, Dr. Xiaowen Liu for graciously accepting to be part of my thesis committee. I want to specifically acknowledge my gratitude to Dr. Edward Berbari for his guidance since I started my graduate endeavor in engineering space. I want to send my special thanks to Dr. Brad Doebbeling, Dr. Tammy Toscos, Dr. Ayten Turkcan, and Ms. Amy Miller for their guidance and contributions during my PhD study. Finally, I thank Patient-Centered Outcomes Research Institute (PCORI) for supporting this work with PCORI award (IH-12-11-5488).
vi
Iman Mohammadi
SIMULATION AND MODELING FOR IMPROVING ACCESS TO CARE FOR UNDERSERVED POPULATIONS
This research, through partnership with seven Community Health Centers (CHCs) in Indiana, constructed effective outpatient appointment scheduling systems by determining care needs of CHC patients, designing an infrastructure for meaningful use of patient health records and clinic operational data, and developing prediction and simulation models for improving access to care for underserved populations. The aims of this study are 1) redesigning appointment scheduling templates based on patient characteristics, diagnoses, and clinic capacities in underserved populations; 2) utilizing predictive modeling to improve understanding the complexity of appointment adherence in underserved populations; and 3) developing simulation models with complex data to guide operational decision-making in community health centers. This research addresses its aims by applying a multi-method approach from different disciplines, such as statistics, industrial engineering, computer science, health informatics, and social sciences. First, a novel method was developed to use Electronic Health Record (EHR) data for better understanding appointment needs of the target populations based on their characteristics and reasons for seeking health, which helped simplify, improve, and redesign current appointment type and duration models. Second, comprehensive and informative predictive models were developed to better understand appointment non-adherence in community health centers. Logistic Regression, Naïve Bayes Classifier, and Artificial Neural Network found factors contributing to patient no-show. Predictors of appointment non-adherence might be used by outpatient clinics to design interventions reducing overall clinic no-show
vii
rates. Third, a simulation model was developed to assess and simulate scheduling systems in CHCs, and necessary steps to extract information for simulation modeling of scheduling systems in CHCs are described. Agent-Based Models were built in AnyLogic to test different scenarios of scheduling methods, and to identify how these scenarios could impact clinic access performance. This research potentially improves well-being of and care quality and timeliness for uninsured, underinsured, and underserved patients, and it helps clinics predict appointment no-shows and ensures scheduling systems are capable of properly meeting the populations’ care needs.
viii
TABLE OF CONTENTS
CHAPTER ONE: INTRODUCTION & BACKGROUND ... 1
1.1 Opening Remarks ... 1
1.2 Underserved Populations ... 2
1.3 Community Health Centers ... 3
1.4 Access to Health Care ... 4
1.5 Electronic Health Records ... 6
1.6 Problem Statement and Proposed Approaches ... 7
CHAPTER TWO: APPOINTMENT SCHEDULING REDESIGN ... 12
2.1 Appointment Scheduling ... 12
2.2 Previous Works in Appointment Redesign ... 13
2.3 Care Needs of Underserved Populations ... 15
2.3.1 Consensus Clustering for Patient Diagnoses ... 15
2.3.2 Association of Diagnosis and Access to Care ... 16
2.4 Word Embedding ... 19
2.4.1 Methods ... 20
2.4.2 Results ... 24
2.4.3 Discussion... 29
2.5 Potential Medical Applications ... 32
2.6 Conclusion ... 33
CHAPTER THREE: APPOINTMENT NO-SHOW MODELING ... 34
3.1 No-show Phenomenon ... 35
3.2 Previous Studies on No-show Modeling ... 36
3.3 Predictive Modeling ... 38
3.4 Materials and Methods ... 39
3.4.1 Participants ... 39
3.4.2 Data collection and sample size ... 40
3.4.3 Data preprocessing ... 40
3.4.4 Variables Preparation ... 41
3.4.5 Statistical Analyses ... 42
3.4.6 Prediction Model Development ... 43
3.4.7 Model Validation ... 44 3.5 Results ... 44 3.6 Discussion ... 51 3.6.1 Findings ... 51 3.6.2 Limitations ... 55 3.6.3 Future Work ... 55
3.7 Potential Medical Applications ... 56
3.8 Conclusion ... 57
CHAPTER FOUR: SIMULATION OF SCHEDULING SYSTEMS ... 58
4.1 Scheduling Systems ... 59
4.1.1 Appointment Modalities ... 59
4.1.2 Appointment Scheduling Optimization ... 60
4.2 Simulation Modeling Background ... 61
ix
4.3 Workflow Study ... 65
4.3.1 Work and Activity Observation ... 65
4.3.2 Patient Flow in Scheduling System ... 66
4.3.3 Patient Flow During Clinic Visit ... 67
4.3.4 Appointment Scheduling Rules ... 68
4.4 Data Collection and Analysis After Workflow Study ... 71
4.4.1 Patient Distributions ... 72
4.4.2 Care Demands ... 73
4.4.3 Clinic Supply and Capacities ... 75
4.5 Model Building ... 78 4.5.1 Appointment Adherence... 78 4.6 Simulation Run ... 79 4.7 Performance Measures ... 80 4.8 Validation ... 81 4.9 Scenario Analysis ... 82 4.9.1 Recommendations to Clinics ... 83 4.10 Discussion ... 85 4.11 Conclusion ... 88
CHAPTER FIVE: SUMMARY OF CONTRIBUTIONS ... 90
5.1 Significance ... 91
5.2 Innovations ... 93
5.3 Contributions to Health Informatics ... 94
5.4 Conclusion ... 95
APPENDICES ... 96
Appendix A. Supplement Tables... 96
Appendix B. Supplement Figures ... 101
REFERENCES ... 107 CURRICULUM VITAE
1
CHAPTER ONE: INTRODUCTION & BACKGROUND 1.1 Opening Remarks
Underserved populations are individuals suffering from economical disadvantages, being in racial and ethnic minorities, and being under- or un-insured. Community Health Centers (CHCs) provide primary and mental care for underserved populations, and are designed as safety net for these populations. This research, through partnership with seven CHCs in Indiana, sought to determine care needs of CHC patients, develop an infrastructure for meaningful use of patient health data, and develop predictive modeling and simulation tools for improving access to care for our target populations.
Electronic Health Records (EHRs) are “secure, real-time, point-of-care, patient centric information resource for clinicians1.” EHRs cover a wide range of different
information, consisting of both unstructured narrative text as well as structured data. Many different health care professionals and facilities adopt and contribute to an individual medical record that is an in-house EHR. For example, Community Health Centers, federally qualified health centers (FQHCs), FQHC public clinics, private nonprofit clinics, rural health clinics, free clinics, and others serving diverse composition of patients have been adopting EHR systems. EHR data can be leveraged to develop tools for decision-making, research, and health policy purposes2.
Analysis of population-scale clinical data can support discovering appointment needs, barriers to accessing healthcare, strategies to reduce access barriers, and operational strategies for CHCs. Preliminary research and literature review completed as part of this research find that: 1) there is an association between the characteristics of patients, diagnoses, and appointment type, and there is a need to redesign appointments based on
2
those characteristics3; 2) patient and provider characteristics and visit features help predict
appointment adherence4; and 3) clinical workflow analysis and EHR data analysis can be
used to build the simulation models to identify effective scheduling processes and test alternate strategies to improve timely access to care5. The goal of this research is to identify
care needs of underserved populations and to redesign healthcare systems to better meet these needs. Specifically, the objective of this project is to improve access to care for underserved population by using patient and clinic operational data. This project provides an opportunity to expose important correlation between target populations socio-economic statuses and access to care and health conditions.
1.2 Underserved Populations
This study focuses on improving access to care for poor, underserved, uninsured, or underinsured populations. Poverty and poor health outcomes are highly linked. According to World Health Organization, the determinants of health, i.e. factors affecting individual’s health, may include income and social status, health services, education, physical environment, genetics, and gender6. Those determinants of health can
significantly impact on patients’ quality of life. Table 1.1 shows the U.S. Census Bureau demographics comparison between Indiana and the nation in 20167. Indiana had higher
percentage of children compared to the rest of the country. The rate of high school or bachelor’s degree graduates are lower compared to the rest of the country. Indiana had higher percentages of poverty, uninsured, or disables comparing to the average in the United States. This data articulates importance of focus on underserved populations in Indiana.
3
Table 1.1. Demographic distribution comparison between the US and Indiana7.
People Indiana US
Population
Population estimates, July 1, 2016 6,633,053 323,127,513
Age and Sex
Persons under 5 years, percent, July 1, 2015 6.3 6.2
Persons under 18 years, percent, July 1, 2015 23.9 22.9
Persons 65 years and over, percent, July 1, 2015 14.6 14.9
Female persons, percent, July 1, 2015 50.7 50.8
Race and Hispanic Origin
White alone, percent, July 1, 2015 85.8 77.1
Black or African American alone, percent, July 1, 2015 9.6 13.3
American Indian and Alaska Native alone, percent, July 1, 2015 0.4 1.2
Asian alone, percent, July 1, 2015 2.1 5.6
Native Hawaiian and Other Pacific Islander alone, percent, July 1, 2015 0.1 0.2
Two or More Races, percent, July 1, 2015 1.9 2.6
Hispanic or Latino, percent, July 1, 2015 6.7 17.6
Families and Living Arrangements
Persons per household, 2011-2015 2.55 2.64
Living in same house 1 year ago, percent of persons age 1 year+, 2011-2015 85.0 85.1
Language other than English, percent of persons age 5 years+, 2011-2015 8.3 21.0
Education
High school graduate or higher, percent of persons age 25 years+, 2011-2015 87.8 86.7 Bachelor's degree or higher, percent of persons age 25 years+, 2011-2015 24.1 29.8
Health
With a disability, under age 65 years, percent, 2011-2015 9.7 8.6
Persons without health insurance, under age 65 years, percent 11.2 10.5
Economy
In civilian labor force, total, percent of population age 16 years+, 2011-2015 63.9 63.3
Income and Poverty
Median household income (in 2015 dollars), 2011-2015 49,255 53,889
Per capita income in past 12 months (in 2015 dollars), 2011-2015 25,346 28,930
Persons in poverty, percent 14.5 13.5
1.3 Community Health Centers
Community Health Centers (CHCs) are safety-net clinics providing primary care for underserved and under/uninsured populations. CHCs provide primary care services for acute and chronic diseases, injuries, and preventive services. CHCs frequently provide services, such as dental and vision care, counseling services, behavioral health, and substance abuse services8. CHCs may also offer other social or public health services, such
as health education, translation and transportation. Majority of CHC patients are typically female and children9. About half of the patients in CHCs are from ethnic minorities.
Currently, there are 48 Indiana Community Health Centers serving high-need communities, such as medically underserved areas, medically underserved populations, and health professional shortage areas. They provide services, such as comprehensive
4
primary care and supportive services including translation and transportation. They are committed to be available to all residents of their service areas regardless of income status.
1.4 Access to Health Care
Access to health care is defined as having “the timely use of personal health services to achieve the best health outcomes11.” The National Healthcare Quality Report12
discusses that good access can be achieved in three steps: (1) getting into the health care system; (2) having access to sites providing needed health care services; and (3) finding providers that can meet the individual patient’s medical needs. One of the key points in advancement and development of a healthy society is to improve access to care. Access to health care is not only important for improving the patient experience, but also health outcomes13.
The Affordable Care Act14 has provided a foundation to expand the number of
insured Americans; hence, increased demand for healthcare systems. If accessibility and availability of primary care providers could not meet the high demand, it may lead to hospital emergency rooms becoming the default provider of primary care, and that is costly to the healthcare system15. Many studies have reported that limited access to care is
associated with bad health outcomes and poor population health outcomes16. Improving
access to care is critical for establishing health equity, increasing quality, and improving health outcomes. High missed appointment rates have been identified as one of the most significant barriers to access to care for underserved populations5,17. In semi-structured
interviews conducted at our partner CHCs, clinic staff and providers agreed that a high missed appointment rate is a major problem18.
5
Availability, accommodation, and affordability of care are the major areas of access. Availability barriers are the shortage of primary care providers or patients not knowing how to get care. Timeliness of appointments, forgetting about having appointments, and transportation are some examples of accommodation barriers. Not being insured and not being able to pay for medical expenses are some of affordability barriers19.
Improving timeliness of getting care and eliminating barriers to health care access are critical for promoting optimal health and wellness for poor and uninsured individuals20. As
it is shown in table 1.1, Indiana has a high population of underserved. According to National Healthcare Quality and Disparities Report 2014, Indiana is among the states with the lowest quality (shown in figure 1.1) of and access to health care12.
Figure 1.1. Overall healthcare quality in the US (source: National Healthcare Quality and Disparities Report12).
6
1.5 Electronic Health Records
Electronic health records (EHR) can assist in providing vital information and data to better understand the patient and the utilization of CHCs. EHR is “a secure, real-time, point-of-care, patient centric information resource for clinicians1,21.” EHR in CHCs is still
limited with a need to a proper EHR data collection, aggregation, and analysis22. An
example of EHR critical patient-related data include medical history, medication and allergies, immunization status, laboratory test results, vital signs, demographic, and billing data21. Comprehensive data analysis of EHR supports assessments of community health
patients by offering real-time (up-to-date) data linked with their social determinant of health23. For example, researchers used linked EHRs and found a trend in diabetes,
hypertension, and hypercholesterolemia across community hospitals population in the large metropolitan area of Indianapolis23. To document these health care needs and risks in
uninsured population, health conditions were analyzed from the National Health and Nutrition Survey 2007-2010 for about 1042 uninsured adults in comparison with 421 low-income adults with Medicaid insurance24. The uninsured samples were characterized with
a low income of no more than 138% of the federal poverty level. The results indicate that uninsured adults are likely to be obese, “to report a physical, mental, or emotional limitation”, and to have several chronic conditions24.
Most previous studies addressed the importance of health information technology (HIT) for better care quality in general, but a few publications studied use of EHR data in underserved, rural, and other safety-net populations. Improving quality of care for minority and low-income population is one of the focuses of the Commonwealth Fund25. High
7
making are the main objectives of the Commonwealth Fund. In primary care, they found that CHCs have been able to deliver comparable care to other care delivery systems. In a literature review on impacts of EHRs on quality of care in underserved population, they found evidence showing EHRs can improve quality of care26. The literature review
suggests that the effectiveness of EHR data-driven tools should be further studied. In our study, we propose methodologies to make use of EHR data, and to test the effectiveness of such EHR data-driven tools.
1.6 Problem Statement and Proposed Approaches
In our multisite and multiyear Patient-Centered Outcomes Research Institute awarded study entitled “Improving Healthcare Systems for Access to Care and Efficiency by Underserved Patients”, we aimed to 1) identify and prioritize patient-centered strategies to reduce accommodation barriers to care; 2) develop a computer simulation model of community health centers to model and test the feasibility and impact of the proposed strategies; and 3) coach clinics to implement multicomponent strategies to enhance access and continuity of care for all patients. In this study, we partnered with 7 CHCs across Indiana and found that effective scheduling addresses accommodation barriers, and improving CHC appointment scheduling is key to improve access to care for underserved populations. In this PhD dissertation work, we seek to apply simulation and modeling techniques to improve existing CHC appointment scheduling that would consequently improve access to care for underserved populations. This research does not only potentially improve the well-being of underserved populations, it also provides a basis for the development of decision-making tools for healthcare systems redesign. This research reaches its goals by applying a multi-method approach from different disciplines, such as
8
statistics, industrial engineering, computer science, health informatics, and social sciences. The specific aims of this study are illustrated in the following.
Specific aim 1) Redesigning appointment scheduling based on patient characteristics, complaints, and diagnoses in underserved populations. A key to a more efficient scheduling systems is to ensure appointments are designed to meet patient’s needs and to design and simplify appointment scheduling less prone to error. In this specific aim, we used EHR data to investigate the relationship between diagnoses, patient characteristics, and reasons for visit to help providers redesign healthcare systems that can meet the needs of underserved patients.
Specific aim 2) Utilizing predictive modeling to improve understanding the complexity of appointment adherence in underserved populations. One key measure for improving access to care is reducing the number of appointment no-shows. In this aim, we applied predictive modeling and machine learning approaches to identifying factors impacting appointment adherence in underserved populations.
Specific aim 3) Developing simulation models with complex data to guide decision-making in community health centers. Effective scheduling processes can reduce clinic no-show rates and patient waiting time while improving continuity of care and overall clinic performance. In this aim, computer simulation models were developed to assess and simulate the scheduling processes in CHCs, and provide a decision-making tool for clinic managers to analyze the impact of alternate scheduling modalities.
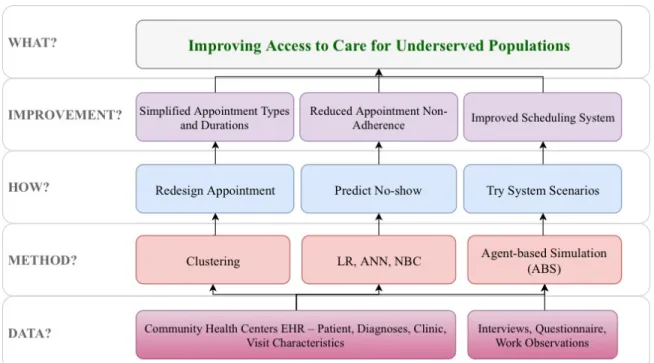
This work tackled the issue of access to care for underserved populations from three different angles (shown in figure 1.2). First, a novel method, a combination of natural language processing and unsupervised machine learning, was developed to use EHR data
9
for better understanding of appointment needs of the target populations based on their characteristics, which helps simplify, improve, and redesign current appointment type and time models. Second, comprehensive and informative predictive models were developed to better understand appointment non-adherence in community health centers. Third, a guide tool described how to extract necessary information and how to develop of simulation modeling of appointment scheduling systems in community health centers.
Figure 1.2. Research strategy. Abbreviations: EHR, Electronic Health Records; LR, Logistic Regression; ANN, Artificial Neural Network; NBC, Naïve Bayes Classifier.
In response to the aims of this research, we answered the following groups of research questions:
RQ1: What are the care needs in underserved population? What are the common diagnoses or disease trends in the target population? How is the socio-economic status associated with diagnoses? What are the potential analytics approaches that can address the population
10
needs? What is the most effective way to redesign appointments in community health centers to meet health care needs of underserved populations?
RQ2: What are the important factors impacting appointment adherence in community health centers? What are the approaches to improve understanding and predicting of no-show behavior of underserved populations? Will machine learning improve accuracy of no-show prediction models compared to statistical models?
RQ3: What are the necessary steps to develop a simulation toolkit for improving scheduling systems in community health centers? What are the approaches to collect data for simulation modeling? How do simulation models of a community health clinic become more realistic?
This research and its findings are described in five chapters. In chapter one, we describe an introduction to the problem and our target populations. In chapter two, we describe the clustering techniques used to redesign appointment types based on patients’ reasons to seek health. It also describes results and discussions around appointment scheduling redesign characterized as aim one. Chapter three describes developments and results of three appointment no-show predictive modeling methodologies that are Logistic Regression, Artificial Neural Network, and Naïve Bayes Classifier. We also discuss the impacts of clinic characteristics, localities, and patient social determinant of health on appointment adherence behavior. Chapter four describes application and development of agent based modeling in healthcare system improvement, and we thoroughly explain the step by step requirements of clinic scheduling and patient flow simulation modeling development. Chapter four also includes an example of a real world problem that was undertaken in our research accompanied by the intervention designed for improved
11
scheduling and access. In chapter five, we discuss potential real world application of this study, and it also includes clinical and scientific significance, and contributions of this study to the field of Health Informatics.
12
CHAPTER TWO: APPOINTMENT SCHEDULING REDESIGN
Meeting the health care needs for underserved populations is crucial3. Appointment
scheduling that is efficient, patient centered, and effective can satisfy health care needs of those populations. In this chapter, we aimed to redesign appointment scheduling in community health centers by identifying care needs of clinic patients and simplifying scheduling templates. In this chapter, we discuss application of “word embedding”, a natural language processing approach, to extract important information from patient records. We used extracted information to cluster patients into groups based on similarity of their reasons for seeking health. We then used patient clusters to redesign appointment types and durations that are simpler and more efficient without adding additional burden on clinics. CHCs managers and other stakeholders might use the findings of this study to restructure their health care systems. The approaches in this chapter can also be a roadmap for developing automated appointment scheduling tools for ambulatory care settings.
2.1 Appointment Scheduling
Appointment scheduling in health care is different from scheduling in other industries as patient medical, physiologic, and mental state is dynamic that would cause uncertainty in patient flow27. In acute health care systems, triaging is applied to evaluate
acuity and meet demands; however, in non-acute settings, triage scheduling is not the most effective way of scheduling. Open access (same day access) models have also been proposed for scheduling appointments in outpatient setting28. Outpatient settings should
consider factors, such as number of services, number of providers, patient arrival process, number of appointments, service times, and provider punctualities to design their scheduling systems29. In this chapter, we focus on redesigning appointment scheduling to
13
meet the needs of patients. Three aspects of the new appointment scheduling include relationship between appointment scheduling and diagnoses, and patient and visit characteristics; redesigning appointment types and durations to help improve access; and focusing on appointment scheduling in underserved settings.
2.2 Previous Works in Appointment Redesign
Many appointment-scheduling methods have been developed to address issues such as demand uncertainty, urgent care, and no-shows. These studies were mostly aimed at improving access to care and clinic service quality that would potentially reduce costs, patient waiting time, and provider idle and over time30. They redesigned appointment types
and time slots using only the clinical constraints rather than the traditional way that required an objective function. Many studies focused on open access scheduling which allows patients to see a provider on the same day of requesting an appointment31. Most of
these studies focused on implementation of open access scheduling and determining the impact of this scheduling system on patient and clinical outcomes. Common conclusion of these studies is that simplifying appointment types is an important principle to implement open access scheduling32-34. Other studies suggest simpler appointment types reduce
complexity in scheduling leading to less error and better access to care35.
One study focused on how to redesign scheduling based on patient characteristics36.
They redesigned a scheduling scheme in a hospital based on patient characteristics to improve utilization of medical resources. They used patient’s characteristics to determine the length of required procedure time. They used a decision tree technique for reclassification of patient groups. They found that the proposed scheduling scheme reduced patient wait time, increased the radiographer utilization, and reduced overall cost. Another
14
study focused on impact of standardizing appointment time slots on quality of care and access to care37,38. They concluded that enforcing standardization on appointment durations
could have negative impact on access and productivity measures.
Most studies on designing appointment scheduling focused on implementation on open access scheduling or the assessment of new scheduling systems. One study proposed a scheduling template by taking clinic goals to considerations rather than designing appointment scheduling based on care needs and characteristics of patients. In studies focusing on improving access and implementation of open access scheduling, decreasing number of appointment types or simplifying appoint types in scheduling systems was recognized as a key step towards successful implementation. However, in these studies, they did not discuss the most appropriate ways to simplify appointment types. They offered appointment types such as new, established, acute, and postoperative as decreased number of appointments. Concerns about management of established patients still remain unanswered. We, through this introductory literature review, found that previous work in redesigning appointment scheduling did not propose patient-centered appointment windows for optimizing scheduling systems. Few studies focused on improving appointment scheduling based on patient characteristics, but the proposals were to accommodate health care settings like emergency department, radiology department, and inpatient settings rather than helping community health centers or outpatient settings providing care for underserved populations. In this chapter, we utilize real world encounter data in community health centers to identify appointment needs of underserved populations. We discuss how we might leverage patients encounter data including
15
diagnoses and reasons for seeking care to construct patient-centered appointment scheduling.
2.3 Care Needs of Underserved Populations
Meeting the health care needs for underserved populations is crucial. We used EHR data to investigate the relationship between diagnoses and patient characteristics to help providers redesign healthcare systems that can meet the needs of underserved patients. Our analyses help healthcare providers and stakeholders identify strategies to improve access to care and health outcomes for underserved populations. Here, we present results of an analysis of EHR data that highlights the relationship between diagnoses, identified by International Classification of Disease (ICD-9) codes, and patient characteristics.
2.3.1 Consensus Clustering for Patient Diagnoses
In our multiyear and multisite study3, we have collected EHR data from seven
CHCs across the state of Indiana. The semi-structured EHR data were extracted using SQL queries for each of the EHR systems utilized by CHCs in our study. We ran SQL queries on the clinics databases, and EHR data was received from CHCs in “csv” format. We followed the Health Insurance Portability and Accountability Act (HIPAA) rules of data de-identification. We use Microsoft SQL database to organize, manage, and query the data. Our database includes five years of EHR data with more than 3M encounters data from 700k patients. In this project, we used a dataset from a CHC in Indianapolis including 10 clinics spread out across the city. The dataset included appointment data (>700k appointments) for more than 85,000 patients from January 1, 2014 to April 30, 2016. We removed appointments scheduled for dental care, vision care, and telephone encounters (e.g. medication refill).
16
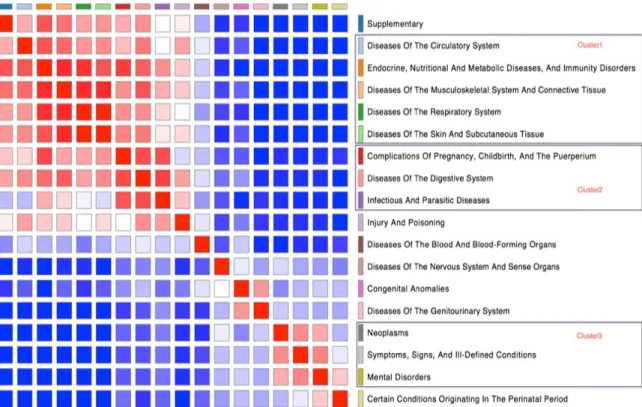
Data fields were pseudo patient ID, encounter date, age, ethnicity, race, sex, zip code, marital status, primary insurance type, income, tobacco use, and ICD-9 codes. We grouped ICD codes based on the “2015 ICD-9-CM Diagnosis Codes” chapters (http://www.icd9data.com/). Labels for each ICD code chapter can be seen in figure 2.1. ICD codes co-occurred in patients, and patients had between 2 to 4 ICD codes on average (Median=2, Mean=2.7). In order to find the associations between chapters in the population, we used consensus clustering to visualize the association using a heat map (shown in figure 2.1). We created three clusters of diagnoses shown in figure 2.1. If 75% or more of ICD codes for a given patient were from a specific cluster, we considered the patient to be in the cluster. We tested the association between patient demographics and clusters to understand what groups of patients were more likely to have a certain cluster of diagnoses. We used SAS 9.4 to perform ANOVA test for continuous variables and Chi-Square test for categorical variables.
2.3.2 Association of Diagnosis and Access to Care
The final dataset included diagnoses of 76,454 patients. Figure 2.1 is the heat map showing the association between diagnosis chapters and the three clusters. Cluster1 included 3,666 patients where at least 75% of the ICD codes belong to one of the chapters in the cluster. Cluster2 included 596 patients. Cluster 3 included 1,912 patients.
17
Figure 2.1. Eighteen groups of ICD codes (right). Heat map showing association between chapters (left).
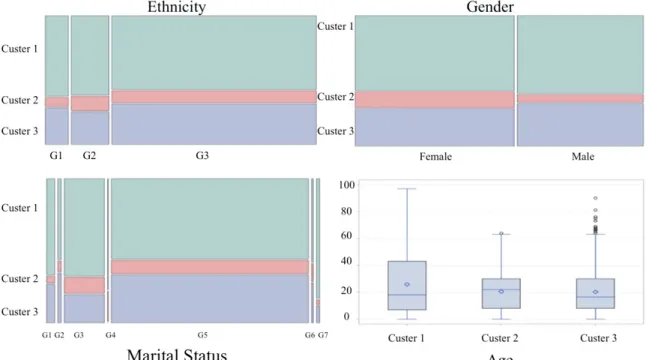
Age, ethnicity, gender, and marital status were found to be statistically significantly associated with clusters (Figure 2.2). Hispanic or Latino patients are more likely to be in cluster 2, and non-Hispanic or non-Latino patients are more likely to be in cluster 3 (p=.0002). Female patients are more likely to be in cluster 2 while male patients are more likely to be in cluster 3 (p<.0001). Single or separated patients are more likely to be in cluster 3 while married patients are more likely to be in cluster 2 (p<.0001). Most widowed patients fall in cluster 1 (p<.0001). Patients in cluster 2 are older than patients in cluster 1 and cluster 3 (p<.0001). Income, smoking status and race are not statistically significantly associated with any of the diagnosis clusters.
18
Figure 2.2. Distribution of statistically significant patient characteristics in 3 clusters. Ethnicity groups: G1, Unspecified; G2, Hispanic or Latino; G3, Not Hispanic or Latino.
Marital Status groups: G1, Divorced; G2, Legally separated; G3, Married; G4, Partner; G5, Single; G6, Unknown; G7, Widowed.
This exploratory work to identify the health care needs of underserved patients revealed factors such as age, ethnicity, gender, and marital status in underserved populations are related to specific group patient types and diagnoses. This information may help clinics define how to cluster appointments for patients to improve access to care. It may also help CHCs prioritize utilization of resources. For example, results from our work could help clinics design culturally appropriate intervention aimed at Hispanic patients targeting diagnoses in cluster 2. While income was not found to be a significant factor to cluster diagnoses, we believe this could be due to the fact that more than 80% of the patients in the population have income less than 100% federal poverty level, therefore patients have similar income level. These insights provide a tool and approach to address the objectives of patient-centered redesign of appointment scheduling.
19
2.4 Word Embedding
Natural Language Processing (NLP) has been widely used to enable computers understand free text and use the information derived from free texts39. NLP includes wide
range of computational techniques used by machines to human-like language processing40.
Word embedding is one of feature learning techniques in NLP that word, phrases, or sentences are mapped to number of vector of numbers41. Word embedding is able to derive
semantic relationships between words using deep learning algorithms42. Many studies in
areas, such as sentiment analysis, information retrieval, and information extractions have applied word embedding42. It also has been utilized in healthcare arena, such medical
synonym extraction43, drug-drug interaction44, and medical abbreviation disambiguation45.
There are some open source word embeddings, such as Google News and GloVe. In a recent study of NLP, word embedding was found successful to capture semantics of medical terms and similarity between them42. The findings of their study were comparable
to human judgments. The source of free text data in our project is patient compliant for seeking health, also known as reason for appointment. This field is entered by schedulers into the partner CHC EHR systems. The objective of this study is to utilize word embedding to extract information from reasons for appointments, and then aggregate the similar reasons into single concepts. Those concepts are used to create new appointment types and durations.
There are various word embedding models that map words to vector of real numbers that generally can be categorized to two methods of matrix factorizations and shallow window-based models. Matrix factorization methods capture the statistical information about the corpus. Approaches, such as latent semantic analysis (LSA)46,
20
capturing the term document frequencies or Hyperspace Analogue to Language (HAL)47
capturing the term-term frequency are of some of matrix factorization methods. The problems with these methods are that most frequent words contribute a disproportionate amount to the similarity measure for instance co-occurrence with words such as “the” or “a” has large effect on the similarity measure despite lack of semantic relatedness. An entropy-based or correlation-based normalization can address this issue as a preprocessing. Shallow Window-Based Methods 48 is another approach to learn the word representation.
The skip-gram and continuous bag-of-words (CBOW) models are two of the widely used word2vec approaches that use neural network structures in learning word representations. In the CBOW, the objective is to predict a word given its context while in skip-gram models the objective is to predict a word’s context given the word itself. These methods suffer from taking advantage of the vast amount of repetition in the data as they scan the corpus on small window size across the corpus.
2.4.1 Methods
Data: We collected the EHR data from an urban community health center included patient, visit, and provider characteristics. The chief complaint or schedulers’ notes was the main data point to extract information. Scheduler note is the reason patient seeking to come to the clinic. For example, when patient calls the clinic and ask for an appointment, the scheduler enters the patient explanation into the EHR system. We used schedulers’ notes to cluster patients based on the similarity of reasons seeking health. Schedulers’ notes are free text fields with many abbreviations; therefore, any attempt to extract information should include dealing with abbreviations.
21
Text mining: MedTagger was developed by Mayo Clinic and contains a suite of programs indexing based on dictionaries49. We used MedTagger50 dictionary list to expand
the abbreviation to their full forms, for example “DM” is transformed to “diabetes mellitus”. We then used Global Vectors for Word Representation (GloVe)51 method to
represent each text column with their real-valued vectors. In this work, we used the GloVe model developed to answer the shortcoming of the earlier models. GloVe captures the benefits of count data while simultaneously capturing the meaningful linear substructures prevalent in recent log-bilinear prediction-based methods like word2vec. We used the GloVe pre-trained vectors on 6 billion token corpus of 2014 Wikipedia and constructed a 50 dimensional vector for every word in the text that appeared in the pre-trained model, and a normalized vector for words without representation in the pre trained vector model. We then averaged all the vectors for the words in the sentence to calculate the final representation of each sentence. For each patient encounter, there exists a chief complaint that is a free text. We ran the word2vec algorithm on each encounter complaint. Each encounter was converted to a row with 50 columns representing the 50 dimensional vector that is derived from the complaint. Figure 2.3 shows analysis engines used for redesigning appointment scheduling templates.
22
Clustering: The data was then fed into an Agglomerative Clustering algorithm. Agglomerative clustering is a bottom-up hierarchical clustering approach by merging pair of clusters, while the clusters generated in earlier step might be nested within the ones generated later. This approach does not necessarily neglect the small clusters; hence, it is useful for the discovery of the smaller groups. It also allows for utilizing the different distance matrices based on the nature of the given problem52. We used
“AgglomerativeClustering” from “sklearn” library in Python to develop our clustering algorithm. To find the optimal number of clusters, we started with 2 clusters and stepwise increased the number of clusters to 20. In each run, we compared the results of clustering by analyzing the profile each cluster. Attributes such as age, gender, and provider specialty were used to objectively validate appropriate number of clusters. We also subjectively evaluated the clusters by reading 100 notes per cluster on average to see whether clustered notes are aligned with human judgment. We found optimal number of clusters is between 10 to 12. We chose 10 as our final number clusters for this study.
Appointment type and duration redesign: In this step, we assigned new appointment durations to the new appointment types, i.e. the 10 clusters. we assumed that the clinic capacity and demand do not change to investigate how standalone simplification of appointment types and durations could potentially impact access measures, such as number of patients seen per year and patient satisfaction defined as patient time spent in-clinic. Patient time spent in clinic is the difference between patient arrival and departure times and includes sum of waiting time to see the provider, time with the provider, and time spent for check out and payments. Proposed appointment durations were calculated based on the capacity that clinic must accommodate patients on a daily basis. The sum of provider hours
23
allocated to see patients per day was defined as daily clinic capacity. For example, if the clinic had two providers on a given day, who each allocates 4 hours to see patients, the total capacity of the clinic on that day is 8 hours (i.e. 480 minutes), that is 240 minutes per provider. We used the distribution of current appointment durations per cluster to determine the most effective appointment durations for each cluster. For each cluster, we assigned the percentiles of current appointment durations (from minimum to maximum by 1 percentile) to proposed durations. We then used the capacity and demand of clinic to calculate performance measures, such as number of patients seen per year, provider time with patient, and predicted patient time spent in clinic. We fit the current daily demand to the current daily capacity using the proposed types and durations. We found the most effective duration for each cluster by maximizing number of patients per year and provider time with patient while minimizing overall patient time spent in-clinic.
Access measure in the proposed appointment system: The difference between current durations and proposed durations was calculated as time available to see more patients. We then calculated number of additional patients can be seen in the proposed system by dividing the time available to see more patients by new appointment durations per cluster. To normalize this measure, we calculated the number of additional patients that the clinic can see in the proposed scheduling system by year.
Time spent in clinic: The time patients spent in clinic, that includes in-clinic waiting time plus time spent seeing the provider, was calculated as the difference between arrive time and departure time recorded in the EHR data. We used current appointment durations, arrival time (AM vs PM), gender, provider specialty, number of provider available in the day of appointment, day of week, and patient age as independent variables and in-clinic
24
time as dependent variable to develop multivariate linear regression model. We used the prediction model to predict time spent in clinic using the proposed appointment durations. Paired wise t-test calculated significance level of difference between current and proposed systems.
2.4.2 Results
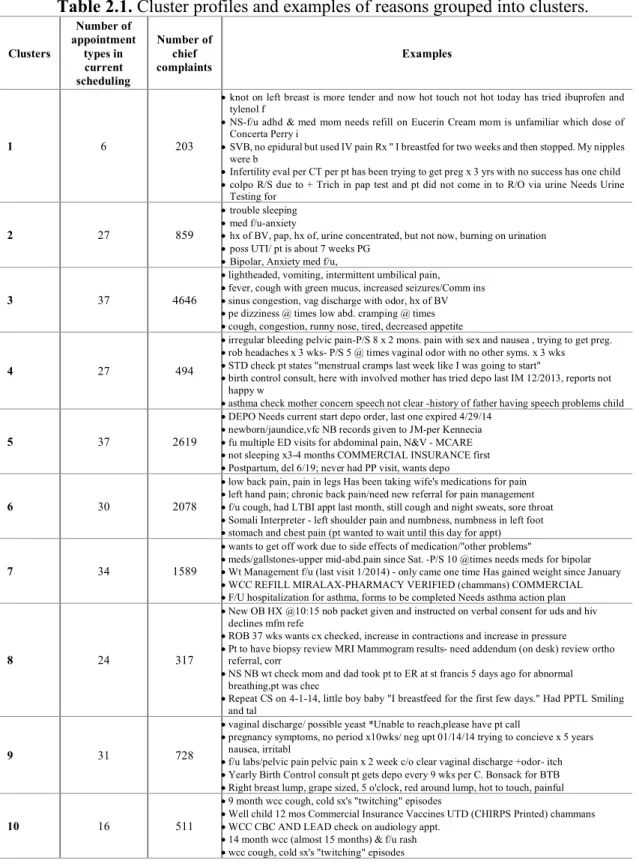
Clustering: We collected 17,722 encounters of an urban community health clinic in 2014. The dataset included deidentified patient ID, day and time of encounter, patients’ arrival and departure times, age, gender, provider ID and specialty, appointment type (102 types recoded in the EHR), and chief complaint (or schedulers’ notes). The dataset included complaints from 7,061 patients in 2014. Following data processing, NLP implementation, and clustering, appointment types were grouped into 10 clusters using patients’ complaints in the current scheduling systems (shown in table 2.1).
Tables 2.1, 2.3, and 2.4 were used to determine the most accurate number of clusters. Our proposed scheduling system has 10 types of appointments (noted as clusters). Table 2.1 shows examples of free texts that were aggregated into one concept. Cluster 1 seems to be appointments that are assigned to patients with complex issues. Cluster 2 represents acute women problems or patients with behavioral health complaints. Cluster 3, that is the largest in terms of number of complaints, is for acute care encounters that need to be scheduled as soon as possible. Clusters 6 and 7 are assigned to patient with chronic pain problems and other chronic problems. Clusters 8 and 9 are dominantly for pregnant and other woman problems. Cluster 10 are for well and other child care patients.
25
Table 2.1. Cluster profiles and examples of reasons grouped into clusters.
Clusters Number of appointment types in current scheduling Number of chief complaints Examples 1 6 203
•knot on left breast is more tender and now hot touch not hot today has tried ibuprofen and tylenol f
•NS-f/u adhd & med mom needs refill on Eucerin Cream mom is unfamiliar which dose of Concerta Perry i
•SVB, no epidural but used IV pain Rx " I breastfed for two weeks and then stopped. My nipples were b
•Infertility eval per CT per pt has been trying to get preg x 3 yrs with no success has one child •colpo R/S due to + Trich in pap test and pt did not come in to R/O via urine Needs Urine
Testing for
2 27 859
•trouble sleeping •med f/u-anxiety
•hx of BV, pap, hx of, urine concentrated, but not now, burning on urination •poss UTI/ pt is about 7 weeks PG
•Bipolar, Anxiety med f/u,
3 37 4646
•lightheaded, vomiting, intermittent umbilical pain, •fever, cough with green mucus, increased seizures/Comm ins •sinus congestion, vag discharge with odor, hx of BV •pe dizziness @ times low abd. cramping @ times •cough, congestion, runny nose, tired, decreased appetite
4 27 494
•irregular bleeding pelvic pain-P/S 8 x 2 mons. pain with sex and nausea , trying to get preg. •rob headaches x 3 wks- P/S 5 @ times vaginal odor with no other syms. x 3 wks •STD check pt states "menstrual cramps last week like I was going to start"
•birth control consult, here with involved mother has tried depo last IM 12/2013, reports not happy w
•asthma check mother concern speech not clear -history of father having speech problems child
5 37 2619
•DEPO Needs current start depo order, last one expired 4/29/14 •newborn/jaundice,vfc NB records given to JM-per Kennecia •fu multiple ED visits for abdominal pain, N&V - MCARE •not sleeping x3-4 months COMMERCIAL INSURANCE first •Postpartum, del 6/19; never had PP visit, wants depo
6 30 2078
•low back pain, pain in legs Has been taking wife's medications for pain •left hand pain; chronic back pain/need new referral for pain management •f/u cough, had LTBI appt last month, still cough and night sweats, sore throat •Somali Interpreter - left shoulder pain and numbness, numbness in left foot •stomach and chest pain (pt wanted to wait until this day for appt)
7 34 1589
•wants to get off work due to side effects of medication/"other problems"
•meds/gallstones-upper mid-abd.pain since Sat. -P/S 10 @times needs meds for bipolar •Wt Management f/u (last visit 1/2014) - only came one time Has gained weight since January •WCC REFILL MIRALAX-PHARMACY VERIFIED (chammans) COMMERCIAL •F/U hospitalization for asthma, forms to be completed Needs asthma action plan
8 24 317
•New OB HX @10:15 nob packet given and instructed on verbal consent for uds and hiv declines mfm refe
•ROB 37 wks wants cx checked, increase in contractions and increase in pressure •Pt to have biopsy review MRI Mammogram results- need addendum (on desk) review ortho
referral, corr
•NS NB wt check mom and dad took pt to ER at st francis 5 days ago for abnormal breathing,pt was chec
•Repeat CS on 4-1-14, little boy baby "I breastfeed for the first few days." Had PPTL Smiling and tal
9 31 728
•vaginal discharge/ possible yeast *Unable to reach,please have pt call
•pregnancy symptoms, no period x10wks/ neg upt 01/14/14 trying to concieve x 5 years nausea, irritabl
•f/u labs/pelvic pain pelvic pain x 2 week c/o clear vaginal discharge +odor- itch •Yearly Birth Control consult pt gets depo every 9 wks per C. Bonsack for BTB •Right breast lump, grape sized, 5 o'clock, red around lump, hot to touch, painful
10 16 511
•9 month wcc cough, cold sx's "twitching" episodes
•Well child 12 mos Commercial Insurance Vaccines UTD (CHIRPS Printed) chammans •WCC CBC AND LEAD check on audiology appt.
•14 month wcc (almost 15 months) & f/u rash •wcc cough, cold sx's "twitching" episodes
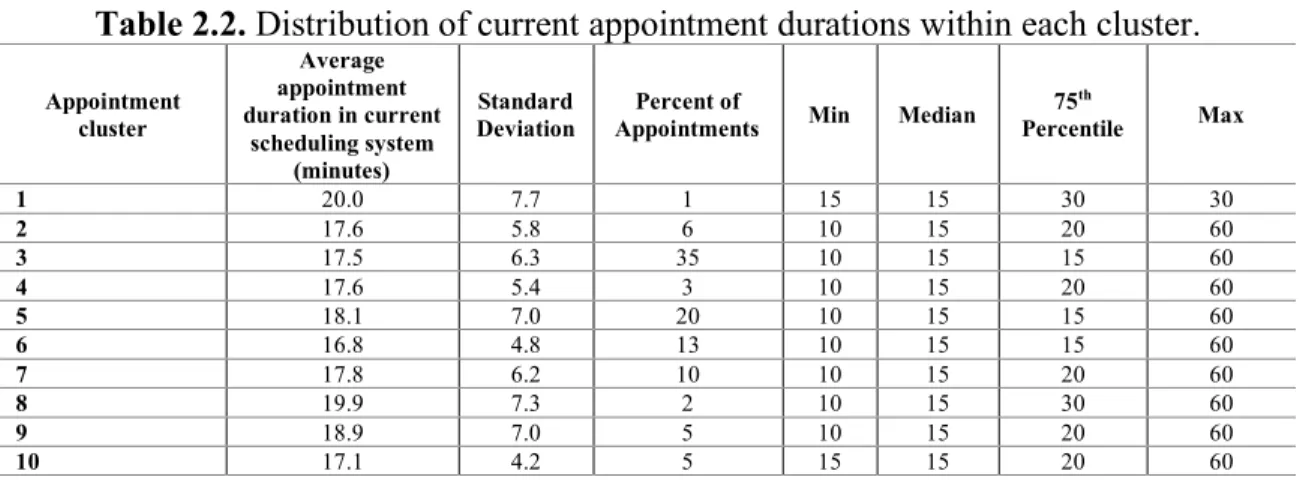
Table 2.2 illustrates the distribution of current appointment durations per each cluster. Appointment durations typically ranges between 10 to 60 minutes. Cluster 1 has
26
the highest durations, and this is aligned with the visit reasons shown in table 2.1, because it is given to complex patients. Cluster 10 has the lowest durations as it is given to well child care.
Table 2.2. Distribution of current appointment durations within each cluster.
Appointment cluster Average appointment duration in current scheduling system (minutes) Standard Deviation Percent of
Appointments Min Median
75th Percentile Max 1 20.0 7.7 1 15 15 30 30 2 17.6 5.8 6 10 15 20 60 3 17.5 6.3 35 10 15 15 60 4 17.6 5.4 3 10 15 20 60 5 18.1 7.0 20 10 15 15 60 6 16.8 4.8 13 10 15 15 60 7 17.8 6.2 10 10 15 20 60 8 19.9 7.3 2 10 15 30 60 9 18.9 7.0 5 10 15 20 60 10 17.1 4.2 5 15 15 20 60
The clinic overall patient gender distribution was 63 to 37 for female to male. Table 2.3 breaks down age and gender profiles of each cluster. Clusters 1 represents young patients from both genders. Cluster 10 shows 95% of patients are younger than 13 years old, and it represent children population. Cluster 8 and 9 are dominantly female patients. Cluster 3, that was concluded to be acute care base on table 2.1, represents all ages and genders. The gender and age profile of each cluster seems to be reasonable based on review of examples of reasons for visits.
Table 2.3. Distributions of patient age and gender within each cluster.
Appointment cluster
Age Gender
Mean SD Min 5th percentile Median 95th percentile Max Female Male
1 17 11 2 2 18 33 33 66.67 33.33 2 27 19 0 1 26 61 89 75.1 24.9 3 24 21 0 0 18 64 89 65.71 34.29 4 22 18 0 0 21 59 96 76.36 23.64 5 21 19 0 0 19 59 96 70.77 29.23 6 22 20 0 0 16 62 88 66.16 33.84 7 22 19 0 0 17 62 90 65.11 34.89 8 28 16 0 0 25 61 90 83.81 16.19 9 29 19 0 0 27 65 86 80.89 19.11 10 3 7 0 0 1 13 76 49.86 50.14
27
Table 2.4 shows percentages of appointments within a cluster that were scheduled with various provider specialties. Cluster 2 is a mix of behavioral health and all other specialties. Cluster 3 (acute care) patients were scheduled with all types of specialties. Cluster 10 patient are dominantly scheduled with pediatricians.
Table 2.4. Percentages of appointments scheduled with each specialty within cluster.
Appointment
cluster Behavioral Health Practice Family Medicine Internal Practitioner Nurse Woman Pediatrics
1 0 0 17 0 67 17 2 10 29 15 9 23 14 3 3 22 25 11 10 29 4 0 17 12 12 36 24 5 2 18 18 11 26 26 6 0 26 25 16 6 27 7 2 20 20 11 18 30 8 0 15 9 14 52 10 9 1 20 26 10 28 15 10 0 5 26 8 0 61
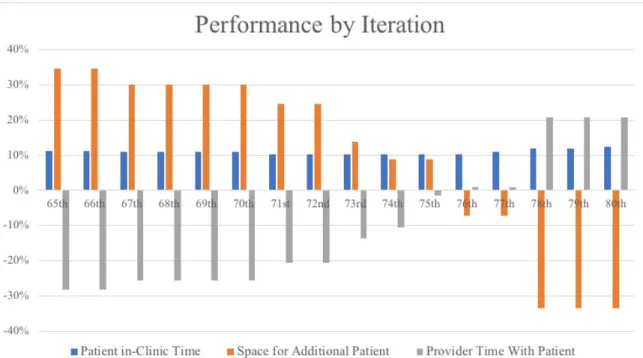
Duration redesign: Figure 2.4 shows scheduling performance measures per several potential durations for new appointment types. Performance measures are percentage of reduction in average patient in-clinic time, ratio of patients seen in new practice compared to current practice, and ratio of provider time spent with patient compared to their capacity. For example, if we consider the value of 65th percentile of all durations within a cluster to
the new appointment duration for that cluster, we would see 11% decrease in patient time in the clinic, 35% increase in number of patients accommodated, and 30% decrease in provider time with patients. The results in figure 2.4 include iterations from 65th to 80th
percentiles. We did not see changes outside this range, so they are not included in the figure. We chose 75th percentile duration of each cluster as the new proposed appointment
durations, because it can reduce average patient in-clinic time by 10%, increase overall number of patients to see by 9%, insignificantly change provider time spent with patient.
28
Figure 2.4. Performance measures by iterations. Nth iteration means assigning the Nth
percentile of appointment durations within a cluster to the cluster.
Table 2.5 shows comparisons of the current scheduling system and the proposed scheduling system. Average appointment duration in current scheduling system is the average of current durations by cluster. They are higher for clusters 1, 2, 4, 7, 8, 9, and 10, and lower for clusters 3, 5, and 6 compared to the average of current durations (p-value<0.0001).
Table 2.5. Comparison of current versus proposed appointment scheduling templates.
Appointment
cluster Average appointment duration in current scheduling system (minutes) Average appointment duration in proposed scheduling system (minutes) Average time spent in clinic in current scheduling system (minutes) Average predicted time spent in clinic in proposed
scheduling system (minutes)
Number of additional/less patients clinic can see in the proposed
scheduling system (patient/year) 1 20.0 30 50.8 67.1 -4 2 17.6 20 63.0 61.5 -21 3 17.5 15 66.0 57.7 649 4 17.6 20 64.3 61.0 -58 5 18.1 15 68.0 57.4 368 6 16.8 15 64.7 57.6 115 7 17.8 20 66.9 60.9 -87 8 19.9 30 70.3 68.3 -61 9 18.9 20 67.5 61.7 -138 10 17.1 20 65.4 58.4 -47 Total 716 (10%)
29
The time patients spent in clinic per visits is calculated based on the EHR patient’s arrival and departure times. Predicted time spent in clinic was calculated using a linear regression model trained using the current scheduling. Table 2.5 shows the proposed scheduling system could open space to see overall 716 additional patients per year, which is about 10 percent more patients. Figure 2.5 shows distributions of patient time spent in clinic per visit. Our results suggest that the new scheduling systems and appointment duration could decrease patient in-clinic time by 3.7 minutes on average (p-value<0.0001).
Figure 2.5. Comparison of distributions of patient time spent in clinic between the current and proposed appointment types and durations.
2.4.3 Discussion
We studied possibility of using patients’ reasons for seeking health along with patient, visit, and provider characteristics to design new appointment types and durations for community health centers. Our study has three major findings. First, word embedding, that is an NLP approach, can be used to extract information from schedulers notes for
30
improving scheduling systems. Second, unsupervised machine learning approach can be applied to simplify appointment scheduling in community health centers. Third, patient centered appointment scheduling can be achieved by simplifying and redesigning appointment types and durations that could improve access measures, such as increasing availability of time and patient satisfaction.
In this work, we expanded utilization of word embedding trained models by applying it on scheduler notes in primary care settings. We found word embedding trained on EHR scheduler notes, MedTagger, and GloVe can capture semantics of medical terms, and the results are aligned with human judgment (shown in table 2.1).
The Institute of Medicine defines health care quality as "the degree to which health care services for individuals and populations increase the likelihood of desired health outcomes and are consistent with current professional knowledge53." One of the domains
of health care quality is efficiency. Our study found simplification of scheduling based on patient, provider, and clinic characteristics could improve efficiency. In this work, we designed a methodology to simplify appointment types and times because complex schedule templates could lead to mismatching patient problem to incorrect answer54.
Simplifying appointment types and times is one of the requirements of transitioning from traditional access models to advance access models54. The approaches in this study could
simplify appointment scheduling to match daily supply and demand. We found simplifying scheduling templates could improve overall clinic performance, such as improving provider productivity, decreasing patient in-clinic waiting time, and improving clinic accommodations. Our methodology is significant because improved overall performance could be achieved without additional supply, more resources, or extended hours.
31
Patient centeredness is another domain of health care quality that is achieved by meeting patient needs and preferences. In this study, we designed an infrastructure for patient specific resource allocation. Patients with different reasons for seeking health, age, and gender have different resource requirement55. Our proposed appointment scheduling
template clusters patients into classes based on reasons for seeking health.
Timeliness and patient satisfaction are other aspects of a good health care delivery system56. Our study found that simplified scheduling can reduce in-clinic time that could
consequently lead to improved timeliness and satisfaction.
Our study had some limitations. First, our patient encounter data lacked clinical information such as diagnoses, procedures, lab results, and clinicians’ notes. In any future work these features can also be used to design stronger patient specific resource distribution. Another limitation of this study was that our dataset did not include information about in-clinic patient journey, such as step by step activities and timestamps from the moment that patient checks in to departure of patients, and information about daily number of staffs, medical assistants, and nurses. Those factors could be predictors of in-clinic waiting time.
Future work in this area might focus on three objectives. First, refinements of expansion of abbreviations by utilizing more comprehensive dictionaries that would be able to deal with less commonly used abbreviations. Second, other unsupervised clustering methods such as deep learning or reinforcement learning might be able to extract more relations between notes; that would lead to more precise clusters. Third, researchers might use the findings of this study to either implement the algorithms in current EHR interface
32
or design a new interface for a decision support system. Future research in this area could be evaluating the effectiveness of the proposed algorithms in a real world clinical practice.
2.5 Potential Medical Applications
In this chapter, we found that health care needs of patients vary by factors such as age, ethnicity, gender, and marital status in underserved populations. Clinics might use the findings of this study to prioritize the most feasible and impactful patient-centered approaches to reduce barriers of accommodation. One of the steps of moving from traditional appointment scheduling to optimized open access scheduling is to simplify appointment types and times. CHCs or other primary care settings can leverage methodologies and findings of this chapter to achieve optimized open access scheduling. Previous studies did not discuss the most appropriate ways to simplify appointment types. They offered appointment types such as new, established, acute, and postoperative as decreased number of appointments34. A key advantage of methodology presented in this
chapter is that the simplification of appointment template is not only helping clinics achieve advanced open access scheduling system, but they are also patient centered and patient specific. Proposed appointment scheduling templates is designed based on reasons patients seeking health.
Another potential medical application of this study is to utilize the unsupervised machine learning approach presented in this chapter to design automated appointment scheduling tools for healthcare settings. These tools can be in form of online appointment scheduling or automated phone call scheduling. These potential tools ask patients why they need appointment and the system find the most appropriate appointment type and time for the patient. Methodologies presented in this chapter can be applied on both scheduler and
33
clinician notes to find care needs and gaps for patients, and design interventions to close the gaps.
2.6 Conclusion
A key to a more efficient scheduling systems is to ensure appointments are designed to meet patient’s needs, and to design and simplify appointment scheduling less prone to error. In this chapter, we presented approaches for redesigning appointment scheduling based on patient characteristics, complaints, and diagnoses in underserved populations. We used EHR data to investigate the relationship between diagnoses, patient characteristics, and reasons for visit to help providers redesign healthcare systems that can meet the needs of underserved patients. We found care needs in underserved population by applying consensus clustering on patient records to reveal the common diagnoses or disease trend in the target population. We found the socio-economic status of patients is associated with diagnoses in underserved populations. We applied word embedding and unsupervised machine learning methods to design most effective appointments in community health centers. We found simplifying appointment types and times can help healthcare systems achieve improved access and patient satisfaction without adding additional resources.
34
CHAPTER THREE: APPOINTMENT NO-SHOW MODELING
In this chapter, using predictive modeling techniques, we developed and compared appointment no-show prediction models to better understand appointment adherence in underserved populations. We collected Electronic Health Records (EHR) data and appointment data including patient, provider, and clinical visit characteristics over a three-year period. All patient data came from an urban system of community health centers (CHCs) with 10 facilities. We sought to identify critical variables through Logistic Regression, Artificial Neural Network, and Naïve Bayes Classifier models to predict missed appointments. We used 10-fold cross-validation to assess the models’ ability to identify patients missing their appointments. Following data preprocessing and cleaning, the final dataset included 73,811 unique appointments with 12,392 missed appointments. Predictors of missed appointments versus attended appointments included lead-time (time between scheduling and the appointment), patient prior missed appointments, cell phone ownership, tobacco use, and the number of days since last appointment. Models had a relatively high area under the curve for all three models (e.g., 0.86 for Naïve Bayes Classifier). Patient appointment adherence varies across clinics within a healthcare system. Data analytics results demonstrate the value of existing clinical and operational data to address important operational and management issues. EHR data including patient and scheduling information predicted the missed appointments of underserved populations in urban CHCs. Our application of predictive modeling techniques helped prioritize the design and implementation of interventions that may improve efficiency in community health centers for more timely access to care. CHCs would benefit from investing in the
35
technical resources needed to make these data readily available as a means to inform important operational and policy questions.
3.1 No-show Phenomenon
Given financial challenges of delivering quality health care in the United States, finding ways to improve performance is critical in the plight to provide greater access to care. Optimizing scheduling systems has been identified as one system level approach to address access needs. For example, reducing the number of missed appointments is crucial as when appointment slots go unused, and it effectively reduces access to others in need of an appointment57. In addition to underutilizing providers' time, missed appointments
impact waits and delays for others, increase health care costs, and increase possibility for adverse health outcomes58,59. Research has shown that lowering missed appointment rates
can improve clinical efficiency and utilization, reduce waste, improve provider satisfaction, and lead to better health outcomes for patients60,61. Missed appointment rates range from
10% to 50% across healthcare settings in the world with an average rate of 27% in North America59. Patients with higher missed appointment rates are significantly more likely to
have incomplete preventive cancer screening, worse chronic disease control and increased rates of acute care utilization62. In previous studies, missed appointments have been due to
logistical issues, lack of understanding of the scheduling system, patients not feeling respected by healthcare providers or the health system, affordability, timeliness, patients forgetting appointment, and patient severity of illness59,63.
Researchers studied impact of no-show on health outcomes. They found patients with higher non-adherence were significantly more likely to have incomplete preventive cancer screening, worse chronic disease control, and increased rates of acute care
36
utilization62. In another study, missed cl