Journal of Chemical and Pharmaceutical Research, 2014, 6(5):1937-1941
Research Article
CODEN(USA) : JCPRC5
ISSN : 0975-7384
Quantitative study and analysis for English integrated teaching
based on Matlab
Li Liu
Department of Foreign Language, Qiqihar Medical University, Qiqihar, Heilongjiang, China
_____________________________________________________________________________________________
ABSTRACT
Descriptive analysis, correlation analysis and regression analysis for randomly selected items are carried out by means of Matlab software. In order to get further analysis of quantitative data of integrated course teaching in English, in terms of it, English teaching process is cognized and improved. Finally, for the main result in this paper, the constructive suggestions for teaching are put forwards. The integrated teaching is closely associated with the implementation of the new curriculum goal of "knowledge and skill, process and method, emotion attitude and values", what’s more, students are taught in terms of arousing students' autonomous learning enthusiasm, and students' learning process perspective, and they are guided to rethink, evaluate the feedback learning process timely. The integrated teaching breaks the traditional model, establishes multi-directional communication mode, forms a three-dimensional network of information exchange, reflects the thought of students being the principal part of learning, and highlights the students' self-learning which promotes students’ learning first, and then learning well to help them know how to learn and how to explore. For this, teacher-centered idea is transformed into student-centered one. In the process of teaching students’ thinking process is fully demonstrated, which can mobilize completely students’ the enthusiasm and initiative for the course so as to create the conditions for students to learn, improve the quality of learning and student disciplinary literacy. Thus, either their personality or their all-round quality can gain development, so that students learn easily, teachers teach well, both of whom can benefit from teaching. Integration teaching reduces the implicit waste teaching class, greatly improving the teaching efficiency and class realization rate.
Key words: Matlab simulation, multiple linear regressions, correlation analysis, English teaching
_____________________________________________________________________________________________
INTRODUCTION
Traditional English teaching model emphasizes teaching rather than practice. Teaching should keep up with the times. With the increasing pace of economic globalization, growing needs and requirements for foreign language, English teaching is required to pay more attention to training practical ability, however, some teachers lack practical abilities such as these of not creating the scene close to student life, not good at accurately expressing themselves in English or organizing class teaching, not good at writing on the blackboard, or not proficient in using modern teaching means and so on [1-5]. This leads students to feel no interest in learning and get nothing. Furthermore, it seriously deviates from the final goal of university education, and it is difficult for the students to meet the requirements of society and the times [6-9]. Therefore, theory should be combined with practice [10-12]. However, the integrated curriculum system focus on linking theory with practice, on improving the relationship between students and teachers, on promoting the students’ Comprehensive Capabilities, and improving the employment rate.
STUDYING METHODS
Career English” and "Advanced English."
Use Matlab mathematical software 7.0 to analyze data, study the collected materials from the Institute, and use quantitative research methods. Quantitative research methods are generally carried out to acquire the overall statistical results for the specific study object, which mainly includes statistical analysis, its description and analysis and forecasting for built econometric model.
DATA ANALYSIS
Matlab mathematical software is software for standard data analysis and graphing recognized by the international scientific publishing industry, which has powerful function and can be easily operated from a Lab company for Matlab mathematical software in the U.S. Its advantages are recognized as easily learning, powerful function and flexible operation. Its two main functions for the software are analysis and drawing.
Firstly, in Table 1 the data’s are typed into the software Matlab mathematical software, and then analyze and process the results. The analytical methods are used in this paper including:
Descriptive Analysis: The collected data’s are organized, summarized and described, and commonly used means include amount and range.
[image:2.595.72.541.329.518.2]Correlation analysis: analysis for distinction degree, degree reliability of test questions. Regression Analysis: multiple linear regression analysis mainly is applied.
Table 1: grades from 30 students
Student ID
College English
Comprehensive English
Practical Career English
Advanced English
Student ID
College English
Comprehensive English
Practical Career English
Advanced English
1 69 83 69 71 16 71 75 62 90
2 66 84 61 82 17 63 87 77 88
3 76 85 70 81 18 70 80 72 85
4 72 90 80 90 19 60 79 77 77
5 73 84 74 68 20 69 82 66 85
6 79 85 68 65 21 72 87 84 87
7 65 93 81 88 22 76 86 77 76
8 74 84 77 85 23 75 78 69 87
9 74 85 70 81 24 71 87 73 70
10 70 84 70 75 25 68 78 72 90
11 75 80 75 88 26 75 87 70 83
12 68 88 67 76 27 60 89 76 88
13 71 89 77 92 28 69 82 71 76
14 68 85 80 77 29 77 80 71 81
15 61 74 85 89 30 64 90 52 71
RESULTS
descriptive analyses
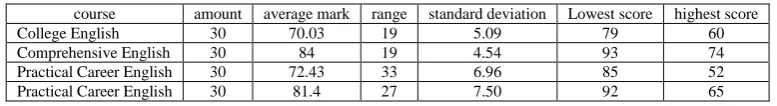
First, work out the amount, average mark, range, standard deviation of the four courses, and then input the scores of the four courses into Matlab mathematical software to gain statistics for columns, which are shown in Table 2.
Table 2: descriptive data analysis
course amount average mark range standard deviation Lowest score highest score College English 30 70.03 19 5.09 79 60 Comprehensive English 30 84 19 4.54 93 74 Practical Career English 30 72.43 33 6.96 85 52 Practical Career English 30 81.4 27 7.50 92 65
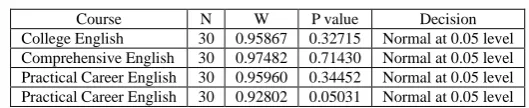
[image:2.595.112.501.594.647.2]Table3: normal distribution anlysis
Course N W P value Decision College English 30 0.95867 0.32715 Normal at 0.05 level Comprehensive English 30 0.97482 0.71430 Normal at 0.05 level Practical Career English 30 0.95960 0.34452 Normal at 0.05 level Practical Career English 30 0.92802 0.05031 Normal at 0.05 level
From Table 3, the grads for these four courses are close to normal distribution.
Correlation analysis
Statistical correlation analysis is to study correlation among random variables, mainly to determine correlative
relations by the correlation coefficient. If the two variables x and y has its respective sample values xi and yi, the correlation coefficient between them is:
] 1 , 1 [ ) ( ) ( ) )( ( 1 2 1 2
1
n i i n i i n i i i xy y y x x y y x x r
n i i n i i y n y x n x 1 1 1 , 1Absolute value of rxy is close to 1, which indicates the close relationship of the two variables; however, their relationship is not close when the value is close to 0.
There are two main analysis steps mentioned in the paper, which are analysis on distinction degree and reliability degree of test questions.
First, Analysis on distinction degree of test questions
Distinction degree is one of the key indexes to measure the quality of test questions, mainly for the discernment of the questions. When distinction degree is higher, the different levels of the participants can be distinguished, thus, the value of used test questions is greater. But that does not mean the higher distinction degree is, the greater difficulty is. If the item difficulty is too high or too low, different levels of individuals will be not well distinguish. So when the problems are at medium difficulty, the distinction degree is highest.
Commonly used computation methods for distinction degree are shown in the two following ways:
) (H L N XL XH D PL PH D
For the same method, the distinction degree of a certain test question in “Advanced English” is anal sized. The detailed analysis is shown in Table 4.
[image:3.595.172.437.86.140.2]
Table 4: the distinction degree of a certain test question
Students ID Total score The score of the question Students ID Total score The score of the question
1 71 18 16 90 11
2 82 14 17 88 15
3 81 15 18 85 16
4 90 16 19 77 12
5 68 13 20 85 13
6 65 14 21 87 16
7 88 14 22 76 14
8 85 13 23 87 13
9 81 16 24 70 16
10 75 14 25 90 17
11 88 14 26 83 14
12 76 15 27 88 17
13 92 14 28 76 16
14 77 13 29 81 14
15 89 17 30 71 15
Secondly, reliability degree of test questions.
Usually the reliability of measurement results is called reliability degree, i.e. consistency credibility degree or reliable degree of the measurement results. Therefore, the test questions of high reliability can be used as a measure of standard of student achievement. Reliability mainly includes test-retest reliability, split half reliability, alternate form reliability, Kuder Richardson reliability, clone Bach reliability and inter-scorer reliability. In this paper, the reliability is measured by using Internal Consistency Reliability, namely the split half reliability, its calculation formula is:
2 1 2 1
) 1 (
1 xx
x x xx
r n
r n r
Among it, rx1x2 shows the respective scores and correlative coefficients, n is multiple test questions relative to
the original length change, calculate the reliability when n2 is taken.
The test questions are divided into odd and even problems, then calculate the two part test score, calculate reliability coefficient using the correlation coefficient of two group scores, then the correlative coefficient is the internal consistency coefficient. Take reliability in "College English" for example, it is as shown in Table 5.
Table5: reliability degree analysis in College English
Student ID
College English
Score for odd question
Score for even question
Student ID
College English
Score for odd question
Score for even question
1 69 39 30 16 71 45 26
2 66 36 30 17 63 33 30
3 76 40 36 18 70 40 30
4 72 39 35 19 60 35 25
5 73 37 36 20 69 39 30
6 79 49 30 21 72 40 32
7 65 29 36 22 76 38 38
8 74 40 34 23 75 38 37
9 74 44 30 24 71 42 29
10 70 35 35 25 68 38 30
11 75 35 40 26 75 42 33
12 68 38 30 27 60 36 24
13 71 40 31 28 69 35 34
14 68 28 40 29 77 45 32
15 61 35 36 30 64 29 35
It can be seen that the reliability degree of College English is not high by using Matlab mathematical software, which is just 0.75392. Similarly, the reliability degree of another three courses can be obtained as follows:
Table6:The reliability degree of the three courses
course Comprehensive English Practical Career English Advanced English reliability degree 0.31002 0.47532 0.57013
From Table 6, the reliability degree of College English、Comprehensive English、Practical Career English and Advanced English are not high, among which Comprehensive English is 0.31002 as the lowest one, and that of Advanced English as the highest one is, 0.57013, even so, the result is not satisfying and optimistic.
Regression Analysis
Correlation analysis and regression analysis are closely linked, which not only have the same research object, and often complement each other. Correlation analysis is the basis and premise for regression analysis, while regression analysis make s relevant analysis continue and deepen. In this paper, multiple linear regression analysis is used mainly. The called multiple linear regression analysis refers to the analysis for a linear relation between a dependent variable and multiple independent variables. The general form is:
x x mxm
Y 0 11 2 2
Among it, 0 is intercept, 1,2,,m are regression coefficients, is Residual.
According to sample data, the estimation value of the parameter of the model is obtained, the expression of the relationship between dependent variable variables and independent variables can be also obtained, and that is, the
When the "Advanced English" is considered as the dependent variable, and the "College English", "Comprehensive English" and "practical English" are considered as independent variables, find out the correlation between "Advanced English" and the other three courses. by Using Matlab mathematical software, multiple linear regression
equation can be obtained as follows:Y40.309750.10001x10.379x20.0963x3.
From the multiple linear regression equation, the relationship between "Advanced English" and the other three courses can be also obtained. Therefore, as long as the scores of three courses is known, the score of the fourth course can be estimated and predicted.
CONCLUSION
In this paper, by Matlab math’s software, descriptive analysis, correlation analysis and regression analysis are made from 30 students randomly chosen and their four courses, the following results are obtained: firstly, scores of four courses are close to the normal distribution, what’s more, indexes of the amount and the total distance are in reasonable interval; secondly, the distinction degree of test questions in some courses is too high, take "Advanced English" for example, the distinction degree of some test questions exceeds 0.7;thirdly, the reliability of four courses is not high, among which, the reliability of "Advanced English" is the highest, but only 0.57013; fourthly, the low correlation lies in the courses.
From the study in this paper, several suggestions for father English teaching can be obtained as follows:. The results given in this paper, after a few points in English teaching suggestions: first, for the curriculum setting, the relationship between the high, low grade curriculums should be taken into account. Secondly, control the distinction degree which should be more than 0.3. However, much higher distinction degree does not mean higher degree of difficulty. Thirdly, grasp the reliability of test questions.
REFERENCES
[1] LUO Zhang-tian, GAO Yan. Journal of East China Institute of Technology, 2004, 23(4), 70-74. [2] LUO Ai-feng, YE Zhang-huang. Journal of East China Institute of Technology, 2005, 24(4), 381-384. [3] Lin Bin. CHINA SCIENCE AND TECHNOLOGY INFORMATION, 2010, (9):60-61.
[4] ZHU Yong-he. Journal of Qiqihar University (Philosophy & Social Science Edition), 2003, (3), 118-121. [5] LI Song, LI Yang, QIU Lei. Journal of Northeastern University(Social Science), 2006, 8(5), 380-383. [6] GAO Yan, FENG Zheng-hua. Journal of East China Institute of Technology, 2006, 25(1), 93-96. [7] Lin Bin. CHINA SCIENCE AND TECHNOLOGY INFORMATION, 2010, (9), 60-61.
[8] Zhang B.; Zhang S.; Lu G.. Journal of Chemical and Pharmaceutical Research, 2013, 5(9), 256-262. [9] Zhang B.; International Journal of Applied Mathematics and Statistics, 2013, 44(14), 422-430.