Barriers to the development of smart cities
in Indian context
Rana, NP, Luthra, S, Mangla, SK, Islam, R, Roderick, S and Dwivedi, YK
http://dx.doi.org/10.1007/s1079601898734
Title
Barriers to the development of smart cities in Indian context
Authors
Rana, NP, Luthra, S, Mangla, SK, Islam, R, Roderick, S and Dwivedi, YK
Type
Article
URL
This version is available at: http://usir.salford.ac.uk/id/eprint/48532/
Published Date
2018
USIR is a digital collection of the research output of the University of Salford. Where copyright
permits, full text material held in the repository is made freely available online and can be read,
downloaded and copied for noncommercial private study or research purposes. Please check the
manuscript for any further copyright restrictions.
Barriers to the Development of Smart Cities in Indian Context
Nripendra P. Rana1&Sunil Luthra2&Sachin Kumar Mangla3&Rubina Islam4&Sian Roderick5&Yogesh K. Dwivedi1
#The Author(s) 2018
Abstract
Smart city development is gaining considerable recognition in the systematic literature and international policies throughout the world. The study aims to identify the key barriers of smart cities from a review of existing literature and views of experts in this area. This work further makes an attempt on the prioritisation of barriers to recognise the most important barrier category and ranking of specific barriers within the categories to the development of smart cities in India. Through the existing literature, this work explored 31 barriers of smart cities development and divided them into six categories. This research work employed fuzzy Analytic Hierarchy Process (AHP) technique to prioritise the selected barriers. Findings reveal that‘Governance’is documented as the most significant category of barriers for smart city development followed by‘Economic;‘Technology’;‘Social’; ‘Environmental’and‘Legal and Ethical’. In this work, authors also performed sensitivity analysis to validate the findings of study. This research is useful to the government and policymakers for eradicating the potential interferences in smart city development initiatives in developing countries like India.
Keywords Smart cities . Barriers . Fuzzy AHP . Sensitivity analysis . Prioritisation . India
1 Introduction
Smart city development is gaining considerable recogni-tion in the systematic literature and internarecogni-tional policies in the last two decades (Albino et al. 2015; Koo et al.
2017; Mori and Christodoulou 2012). For this work, a smart city can be defined as a technologically advanced and modernised territory with a certain intellectual ability that deals with various social, technical, economic aspects of growth based on smart computing techniques to de-velop superior infrastructure constituents and services
(Bakıcı et al. 2013; Cruz-Jesus et al. 2017; Washburn et al. 2010; Zygiaris 2013; Chatterjee and Kar 2018b).
As per the United Nations Population Fund, a large propor-tion of the populapropor-tion will shift to city regions by 2050 (UNFPA 2008). In India, urbanisation is growing rapidly and cities are likely to expand to 600 million by 2030. Another study by Mckinsey (2018) reported that in the fol-lowing 15 years, around 200 million people will transition from rural to urban areas in India. The change will be enor-mous, nearly equal to existing populations of France, Germany, and the United Kingdom combined. In this sense,
* Yogesh K. Dwivedi
Nripendra P. Rana [email protected]
Sunil Luthra
Sachin Kumar Mangla [email protected]
Rubina Islam [email protected]
Sian Roderick
1 Emerging Markets Research Centre (EMaRC), School of
Management, Swansea University Bay Campus, Fabian Way, Swansea SA1 8EN, UK
2
Department of Mechanical Engineering, State Institute of Engineering and Technology, Nilokheri, Haryana 132117, India
3
Plymouth Business School, University of Plymouth, Plymouth PL4 8AA, UK
4
Salford Business School, The University of Salford, The Crescent, Salford M5 4WT, UK
5 School of Management, Swansea University Bay Campus,
Swansea SA1 8EN, UK
the Government of India (GoI) is committed to enhance the quality of life for citizens through its urban development agen-da (Bloomberg Philanthropies2017; Nair2017). In light of this, GoI has listed 109 of India’s most popular urban centres where the focus shifts fromBhighways to i-ways^.
The urban population of India is growing at a lesser rate when compared to the global average (31.15% as per the 2011 census of India). The reason for this may be a lack of govern-mental supportive polices or challenges in managing the urban dynamics. On the other hand, countries such Chile, Mexico, Argentina, Brazil and China have responded by launching various timely initiatives to manage urbanization efficiently (Aijaz2016). For example, Santiago de Chile has shown ad-vancements on becoming smarter (Fast Company2013). Similarly, the Chinese city Xinxiang pursued a joint pro-gramme with IBM to improve its transportation network and community safety (China Daily2013). In citizens’quality of life index, countries such as Denmark, Switzerland and Australia are out performing Asian countries including India. For improving the quality of life, policymakers con-ducted an initiative of smart city development in India (OCED2015; The Indian Express2016). However, cities in developing countries like India are extremely different to de-sign and implement.
Cities generate new kinds of physical problems such as scarcity of resources, air pollution, difficulty in waste manage-ment, traffic congestions, and inadequate, deteriorating and aging infrastructures etc. (Chourabi et al.2012). Another set of challenges arise from the massive levels of digitization and generation of data (Chauhan et al.2016). In recent years, a sequence of challenges in the cities’economies and needs has arisen, administering the promotion of the smart city idea. In addition, the literature also lacks a clear understanding of stra-tegic planning for smart city projects (Angelidou2015). There is a clear literature gap pertaining to the smart city agenda, including its theoretical development and evaluation of related challenges that facilitate implementation in a country context (Yigitcanlar2015). Therefore, key barriers to the smart cities’
development need to be identified and evaluated.
To help policymakers, in this work, the key barriers to the smart cities’development are identified from an evaluation of the literature and experts’feedback. Different experts might have diverse opinions regarding the barriers to the smart cit-ies’development in India. Therefore, the experts on smart cities with regard to academia, industry and public-sector or-ganisations were included to provide their views on the vari-ous barriers that may influence the way in which smart cities develop. Specifically, this research sets the following objec-tives: [i] Identification of relevant barriers of smart cities de-velopment in India, [ii] Prioritisation of barriers to recognise the most important barriers of smart cities development in India. The selection of barriers was made through literature and inputs received from experts. Prioritizing the barriers is a
decision problem involving various criteria and sub-criteria. Various difficulties supplement the prioritization of barriers due to human involvement and indistinctness in data (Mangla et al. 2017). To remove the essential imprecision and ambiguity, this work uses the fuzzy set theory (Zadeh
1965). In this work, authors selected the fuzzy AHP (Analytic Hierarchy Approach) due to this technique’s ability to determine the importance of the identified barriers under fuzzy surroundings (Govindan et al.2015). The fuzzy AHP permits mixing fuzzy set theory with the AHP technique to capture the human bias in judgements when developing pair-wise comparisons between barriers.
The remaining sections of the paper are structured as fol-lows: Section2presents the related literature on smart cities and highlights the barriers of smart cities development. Section3discusses the solution methodology along with the research framework. Section4illustrates the data analysis and results. Section5presents the sensitivity analysis to examine the priority rank stability. Section6discusses the results and presents the theoretical contributions and implications for practice. Finally, Section 8 provides conclusions, limitations and directions of future research.
2 Literature Review
This section illustrates the literature linked to smart cities, and identifies the barriers related to smart cities development.
2.1 Smart Cities Development
The concept of smart city was first addressed in 1990s with an aim to centre the implications of information communication technology for superior infrastructures and upgradations in networks. The widespread use of information technologies also enables cities to empower the advancement of indispens-able services for safety, health, governance and delivery (Hernández-Muñoz et al. 2011; Pereira et al. 2017). For assisting policymakers on smart city network design, the California Institute for Smart Communities explored ways of transforming a city into smart city along with the extent of utilisation of information technologies in smart city context (Alawadhi et al.2012; Albino et al.2015). As a highly signif-icant and extremely sensible initiative, the European Commission started plans on smart cities in 2010 that under-pin four dimensions for the cities including construction, heating and cooling systems, power and transportation. The objective related to transportation, for example, is to build an intelligent public conveyance and traffic management system that avoids congestion, helps reduce fuel consumption and supports safety measures (Djahel et al.2013).
systems, play important role in smart cities projects (Lee et al.
2014). Digital services also play a critical role in facilitating information and services access to the residents of smart cities (Chatterjee et al. 2018; Chatterjee and Kar 2018a). The European Commission has also endorsedBthe smart city^ calls to improve energy efficiency and green mobility for the community (Lazaroiu and Roscia2012). Lee et al. (2013) suggested six key dimensions for the concept of smart city, in terms of economy, mobility, environment, people, living and governance. As of 2012, there were approximately 143 smart cities projects, out of which 35 projects in North America and 47 projects in Europe were seeking to adopt smart technologies in managing urban issues. These included –traffic congestions, energy requirements, higher resources etc. (Lee and Lee2014). According to a pan-European re-search project - Intel Cities (2009), effective governance is key to smart city development (Paskaleva2011). A review of diverse definitions and practices of smart cities across the world also indicates that most of these territories include wide-spread use of mobile infrastructure and services (Lee et al.
2014). In respect of an increasing urban population and im-proved service quality in India, researchers and policymakers should acquire a greater/a more informed understanding on smart city development and its relevant barriers.
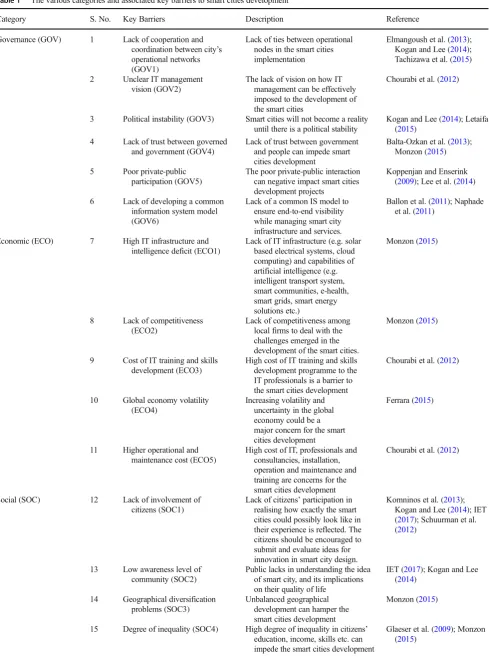
2.2 Barriers of Smart Cities Development
Based on previous studies, this work listed 31 key barriers to smart city development.. Furthermore, in consultation with experts, this work then categorised the barriers into six key categories; details of data collection is provided in Section4. The various categories and associated barriers are presented in Table1.
3 Research Methodology
This work used fuzzy AHP as the research method. This ap-proach allows factors/variables/phenomena to be weighted in terms of importance, in this case smart cities and their related barriers as well as the categories of barriers. First introduced in 1980 by Thomas L Saaty, AHP is a decision-making tool, which assists in developing a hierarchical structure of vari-ables (Saaty1980; Luthra et al.2013; Luthra et al.2016b). AHP/Fuzzy AHP is arguably superior to other decision anal-ysis methods such as fuzzy TOPSIS/TOPSIS, fuzzy ANP/ ANP, and ELECTRE and due to their limited acceptability and complexity (Harputlugil et al. 2011; Mangla et al.
2017). AHP is accessible to use and produces robust results for managers. AHP highlights the alternative, which best ac-cords to achieve the defined goal and understanding of the problem. A human presence can lead to subjectivity in the analysis, however, the application of AHP limits such biases
(Mangla et al.2015). AHP provides the numerical priorities for each variable to attain the goal (Ordoobadi 2010). However, AHP has its own limitations, described as (Ishizaka and Labib2009; Mangla et al.2016):
i. Problem of rank reversal or changes in priority due to any changes in factors or alternatives
ii. The hypothesis of factors independence
iii. Human bias and subjectivity in their judgments in forming pair-wise comparisons
iv. Consensus measure, if context is same and a group of experts has divergent priorities
To deal with above problems, AHP techniques can be ex-tended to modified AHP– Bayesian approach, Fuzzy AHP, and Grey AHP (Govindan et al.2017; Kar2015; Sahoo et al.
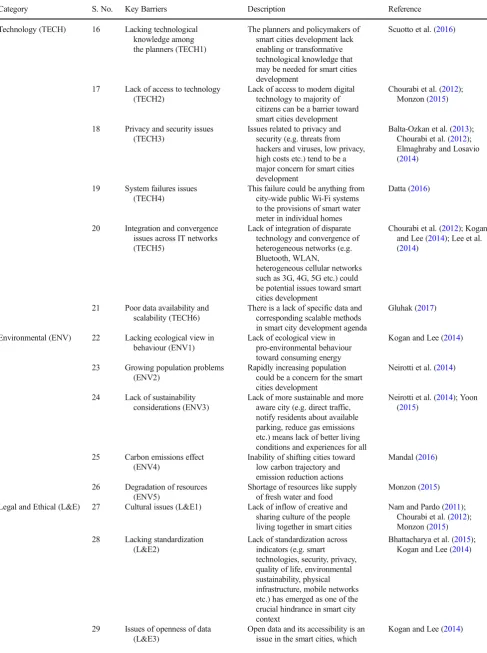
2016). Amonst these, fuzzy AHP is preferential, due to its simplicity and higher consistency (Junior et al. 2014; Prakash and Barua 2015). The Fuzzy AHP technique also allows (i) analysing the behaviour of complex system in decision-making; (ii) evaluating the human judgment by de-termining the relative importance of system variables. Therefore, this research proposes to use a fuzzy based AHP approach for prioritizing the barriers in smart city develop-ment in India. The flow map for the fuzzy based AHP tech-nique is shown in Fig.1, and the steps involved are explained as follows:
The fuzzy AHP involved several steps (Chan et al.,2008) as follows:Step 1:Formulating and defining the aim of re-search work: The aim of work to prioritize the barriers in smart cities development is defined. Step 2:Applying the fuzzy concepts: In a decision-making problem generally involves human assessments consist of qualitative judgments. Thereby, the fuzzy concepts are preferred (Dubois and Prade
1979; Zadeh 1965). The triangular fuzzy number (TFN) is used in this work.Step 3:Constructing a hierarchical struc-ture: In respect to the aim of this work, a hierarchical structural keeping the experts’view into account is formed. Step 4: Developing a fuzzy pair wise assessment matrix: The pair wise assessment matrix for the barriers are formed. Prior to this, a nine-point scale of relative importance based on TFNs is designed (Table2). Experts generally provide their feedback in terms of linguistic statements thus fuzzy scores were used to transform their linguistic inputs into numbers.
In order to develop a positive fuzzy comparison matrix (M), the average of the pair wise comparisons from expert panel is computed, which is given as M = [muv]n × m.
Where, mxyshows the fuzzy entries in the developed fuzzy positive matrix, i.e., (iuv, juv, kuv). Further, positive fuzzy num-bers should also satisfy the properties, given as below:
iuv ¼i1uv;juv¼i1uv; kuv ¼
1
iuv, wh er e , u an d v = 1 , 2
Table 1 The various categories and associated key barriers to smart cities development
Category S. No. Key Barriers Description Reference
Governance (GOV) 1 Lack of cooperation and
coordination between city’s operational networks (GOV1)
Lack of ties between operational nodes in the smart cities implementation
Elmangoush et al. (2013); Kogan and Lee (2014); Tachizawa et al. (2015)
2 Unclear IT management
vision (GOV2)
The lack of vision on how IT management can be effectively imposed to the development of the smart cities
Chourabi et al. (2012)
3 Political instability (GOV3) Smart cities will not become a reality until there is a political stability
Kogan and Lee (2014); Letaifa (2015)
4 Lack of trust between governed
and government (GOV4)
Lack of trust between government and people can impede smart cities development
Balta-Ozkan et al. (2013); Monzon (2015)
5 Poor private-public
participation (GOV5)
The poor private-public interaction can negative impact smart cities development projects
Koppenjan and Enserink (2009); Lee et al. (2014)
6 Lack of developing a common
information system model (GOV6)
Lack of a common IS model to ensure end-to-end visibility while managing smart city infrastructure and services.
Ballon et al. (2011); Naphade et al. (2011)
Economic (ECO) 7 High IT infrastructure and
intelligence deficit (ECO1)
Lack of IT infrastructure (e.g. solar based electrical systems, cloud computing) and capabilities of artificial intelligence (e.g. intelligent transport system, smart communities, e-health, smart grids, smart energy solutions etc.)
Monzon (2015)
8 Lack of competitiveness
(ECO2)
Lack of competitiveness among local firms to deal with the challenges emerged in the development of the smart cities.
Monzon (2015)
9 Cost of IT training and skills development (ECO3)
High cost of IT training and skills development programme to the IT professionals is a barrier to the smart cities development
Chourabi et al. (2012)
10 Global economy volatility
(ECO4)
Increasing volatility and uncertainty in the global economy could be a major concern for the smart cities development
Ferrara (2015)
11 Higher operational and
maintenance cost (ECO5)
High cost of IT, professionals and consultancies, installation, operation and maintenance and training are concerns for the smart cities development
Chourabi et al. (2012)
Social (SOC) 12 Lack of involvement of
citizens (SOC1)
Lack of citizens’participation in realising how exactly the smart cities could possibly look like in their experience is reflected. The citizens should be encouraged to submit and evaluate ideas for innovation in smart city design.
Komninos et al. (2013); Kogan and Lee (2014); IET (2017); Schuurman et al. (2012)
13 Low awareness level of
community (SOC2)
Public lacks in understanding the idea of smart city, and its implications on their quality of life
IET (2017); Kogan and Lee (2014)
14 Geographical diversification problems (SOC3)
Unbalanced geographical development can hamper the smart cities development
Monzon (2015)
15 Degree of inequality (SOC4) High degree of inequality in citizens’ education, income, skills etc. can impede the smart cities development
Table 1 (continued)
Category S. No. Key Barriers Description Reference
Technology (TECH) 16 Lacking technological
knowledge among the planners (TECH1)
The planners and policymakers of smart cities development lack enabling or transformative technological knowledge that may be needed for smart cities development
Scuotto et al. (2016)
17 Lack of access to technology
(TECH2)
Lack of access to modern digital technology to majority of citizens can be a barrier toward smart cities development
Chourabi et al. (2012); Monzon (2015)
18 Privacy and security issues (TECH3)
Issues related to privacy and security (e.g. threats from hackers and viruses, low privacy, high costs etc.) tend to be a major concern for smart cities development
Balta-Ozkan et al. (2013); Chourabi et al. (2012); Elmaghraby and Losavio (2014)
19 System failures issues
(TECH4)
This failure could be anything from city-wide public Wi-Fi systems to the provisions of smart water meter in individual homes
Datta (2016)
20 Integration and convergence
issues across IT networks (TECH5)
Lack of integration of disparate technology and convergence of heterogeneous networks (e.g. Bluetooth, WLAN,
heterogeneous cellular networks such as 3G, 4G, 5G etc.) could be potential issues toward smart cities development
Chourabi et al. (2012); Kogan and Lee (2014); Lee et al. (2014)
21 Poor data availability and scalability (TECH6)
There is a lack of specific data and corresponding scalable methods in smart city development agenda
Gluhak (2017)
Environmental (ENV) 22 Lacking ecological view in
behaviour (ENV1)
Lack of ecological view in pro-environmental behaviour toward consuming energy
Kogan and Lee (2014)
23 Growing population problems
(ENV2)
Rapidly increasing population could be a concern for the smart cities development
Neirotti et al. (2014)
24 Lack of sustainability considerations (ENV3)
Lack of more sustainable and more aware city (e.g. direct traffic, notify residents about available parking, reduce gas emissions etc.) means lack of better living conditions and experiences for all
Neirotti et al. (2014); Yoon (2015)
25 Carbon emissions effect
(ENV4)
Inability of shifting cities toward low carbon trajectory and emission reduction actions
Mandal (2016)
26 Degradation of resources
(ENV5)
Shortage of resources like supply of fresh water and food
Monzon (2015)
Legal and Ethical (L&E) 27 Cultural issues (L&E1) Lack of inflow of creative and sharing culture of the people living together in smart cities
Nam and Pardo (2011); Chourabi et al. (2012); Monzon (2015)
28 Lacking standardization
(L&E2)
Lack of standardization across indicators (e.g. smart technologies, security, privacy, quality of life, environmental sustainability, physical infrastructure, mobile networks etc.) has emerged as one of the crucial hindrance in smart city context
Bhattacharya et al. (2015); Kogan and Lee (2014)
29 Issues of openness of data (L&E3)
Open data and its accessibility is an issue in the smart cities, which
Step 5:Devising barriers significance weights: The fuzzy assessment matrix is further evaluated using Chang’s Extent Analysis method (Chang1996; Luthra et al.2015; Mangla et al.2017). This helps in determining the significance weights of barriers. The detail for Chang’s Extent Analysis method is given in Appendix1.
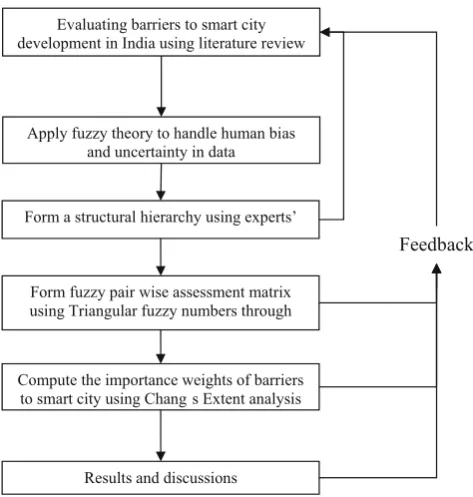
A conceptual framework for analysing the identified inhib-itors relevant to smart city development is proposed (see Fig.2). The framework is developed by following the guide-lines of Platts and Gregory (1990) and given as below: i. Involved processes are strictly relevant to existing
frame-work. Analysis of the literature, selection of barriers and research methodology applicability all are associated with the research aim.
ii. Involved processes of the framework are well supported by literature and thereafter verified through experts’ feed-back. The conceptual research framework consists of two phases. In Phase 1, this work seeks to select the most suitable barriers to smart city development in Indian con-text. The selection of the most suitable barriers is ground-ed on literature survey and feground-edback receivground-ed from the experts’. In Phase 2, we seek to explore the relative impor-tance of the listed most suitable barriers and the categories of barriers. To achieve this, fuzzy based AHP approach is used (see Section5.3). However, the suggested framework is not tested empirically at this stage of this work.
The conceptual framework depicts a real-life illustration of the issues of smart city development in India perspective as presented in Section4. However, questionnaire and data col-lection is demonstrated in the next sub-section.
3.1 Questionnaire Development and Data Collection
[image:7.595.54.542.69.240.2]A total of 31 barriers attributed to six categories to smart cities development were identified from the extensive literature re-view. This work has been conducted in an Indian case context (single case study type). The case study approach is significant to the theoretical development of the domain (smart city Table 1 (continued)
Category S. No. Key Barriers Description Reference
can impede the way the smart city services can be delivered to cities’residents and businesses 30 Lack of transparency and liability
(L&E4)
Inhibited transparency and unclear lines of political accountability in delivering most services could be a concern for smart cities development. The lack of transparency risks isolating the very people smart cities technology is supposed to serve
Nam and Pardo (2011)
31 Lack of regulatory norms,
policies and directions (L&E5)
Lack of appropriate laws, regulations or directives for the smart cities development
Chourabi et al. (2012)
Evaluating barriers to smart city development in India using literature review
Apply fuzzy theory to handle human bias and uncertainty in data
Form a structural hierarchy using experts’
Form fuzzy pair wise assessment matrix using Triangular fuzzy numbers through
Compute the importance weights of barriers to smart city using Chang s Extent analysis
Results and discussions
Feedback
[image:7.595.51.288.454.703.2]Fig. 1 Fuzzy AHP flow diagram for this work
Table 2 Fuzzy linguistic scale (Source: Mangla et al.2015)
Uncertain judgment Fuzzy score
Almost equivalent 1/2,1,2
Almost x times more important x-1, x, x + 1
Almost x times less important 1/x + 1, 1/x, 1/x-1
Between y and z times more important y, (y + z)/2, z
Between y and z times less important 1/z, 2/(y + z), 1/y
[image:7.595.307.545.600.691.2]agenda). The case study research can also reveal the cognitive behaviour of a system, and thus underpins the empirical re-search in the domain (Voss et al.2002). Due to the insufficien-cy in theory and expertise on smart city, this work prefers to discourse smart city development using expert’s opinions (Mangla et al.2015). Initially, twenty experts linked to smart cities project were contacted by phone, emails and direct visits to explain the purpose of the research. The selection of experts was dependent on the basis of researchers’convenience, car-dinal consensus and personal contacts. Eight out of twenty experts felt they were able to participate in this research. This is considered as a satisfactory size for the present case based research (Lin2013; Luthra et al.2016a) provided that experts selected represent an intensive understanding of smart city development projects in Indian context. To examine the barriers to smart cities development in Indian context, we conducted a one-day workshop onBSmart City Design^ on March 7, 2017 in New Delhi, India. The experts were highly
skilled professionals from finance and operations, project management skills, ministry level professionals, environment management, and decision analysts.
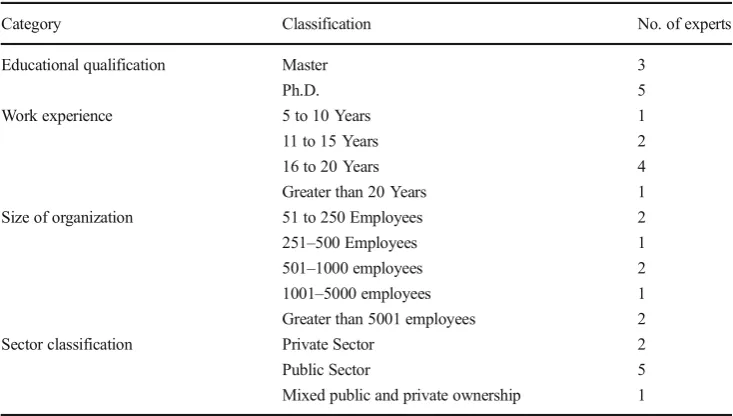
Overall, this work can be applied to a limited context con-ducted with a comparable sample size (8 experts) but confirms a basis for further research that could be generalised to larger populations. For further clarity on the expert’s background, the demographic summary of experts with various criteria is provided in the Table3.
4 Data Analysis and Results
[image:8.595.232.546.50.212.2]Fuzzy AHP is utilized to find the dominant barriers to smart city development in Indian context. Data analysis and related results have been provided. The proposed framework is applied to the research problem under study with other details as below:
Table 3 Experts’demographic
information Category Classification No. of experts
Educational qualification Master 3
Ph.D. 5
Work experience 5 to 10 Years 1
11 to 15 Years 2
16 to 20 Years 4
Greater than 20 Years 1
Size of organization 51 to 250 Employees 2
251–500 Employees 1
501–1000 employees 2
1001–5000 employees 1
Greater than 5001 employees 2
Sector classification Private Sector 2
Public Sector 5
Mixed public and private ownership 1
Selection of the most suitable barriers to smart city development in Indian context (Phase -1)
Exploring relative importance of the listed barriers and the categories of barriers using fuzzy
AHP through expert panel inputs (Phase -2)
Detailed discussions and implications of the research
Using experts’
inputs Feedback for
improvement Using literature
and experts’ inputs
[image:8.595.178.545.504.712.2]4.1 Phase 1: Most Suitable Barriers Relevant to Smart
City Development
The author explored the literature using specific keywords including ‘barriers’and ‘smart cities development’; ‘chal-lenges and smart cities development’;‘problems/issues and smart cities development’ in their various forms using the Scopus database and Google Scholar. Authors also searched specific grey literature, web content, government consultation documents, policy papers, to search for the barriers of smart cities development. A comprehensive review of keywords across various literature surveys fetched us 31 key barriers to smart cities development.
To validate these literature based barriers, a Delphi group session/consultation was conducted with the consent of ex-perts. The experts were asked to rate the listed barriers in smart city adoption on 5-point Likert scale (1 = not at all and 5 =
very significant) through a questionnaire shown in Appendix-A. The mean scores of barriers and their standard deviations to smart cities development in the Indian context are also identi-fied as given in Table4.
The barriers with rating of 2 or mean value less than 2 were decided to be deleted. From Table4, no barrier has obtained mean value less than 2, so as no barrier was deleted from the list. The experts were also asked to make any modification in the list of barriers; however, all the experts were agreed on the 31 literature-based barriers. In this way, all the identified 31 barriers were validated.
[image:9.595.180.542.292.713.2]In this phase, the previously identified thirty-one barriers were presented to experts for developing appropriate catego-ries of barriers. The experts suggested evaluating 31 barriers to smart city development in the context of a developing econ-omy like India through PESTEL analysis. However, the gov-ernment has a vital role in initiating and executing smart city
Table 4 Mean score of barriers to
smart city development SL Barriers to smart cities development Mean SD
1 Lack of cooperation and coordination between city’s operational networks (GOV1) 3.25 0.71
2 Unclear IT management vision (GOV2) 3.88 0.83
3 Political instability (GOV3) 3.38 1.06
4 Lack of trust between governed and government (GOV4) 3.50 1.20
5 Poor private-public participation (GOV5) 3.75 1.39
6 Lack of developing a common information system model (GOV6) 3.13 1.13
7 High IT infrastructure and intelligence deficit (ECO1) 3.38 1.30
8 Lack of competitiveness (ECO2) 2.25 1.28
9 Cost of IT training and skills development (ECO3) 2.63 1.06
10 Global economy volatility (ECO4) 2.25 1.28
11 Higher operational and maintenance cost (ECO5) 3.50 1.69
12 Lack of involvement of citizens (SOC1) 3.50 1.20
13 Low awareness level of community (SOC2) 3.88 1.36
14 Geographical diversification problems (SOC3) 2.88 1.13
15 Degree of inequality (SOC4) 3.38 0.92
16 Lacking technological knowledge among the planners (TECH1) 3.75 0.71
17 Lack of access to technology (TECH2) 3.25 1.04
18 Privacy and security issues (TECH3) 3.25 1.04
19 System failures issues (TECH4) 3.50 0.76
20 Integration and convergence issues across IT networks (TECH5) 3.63 0.92
21 Poor data availability and scalability (TECH6) 3.50 1.20
22 Lacking ecological view in behaviour (ENV1) 2.63 0.92
23 Growing population problems (ENV2) 3.00 1.07
24 Lack of sustainability considerations (ENV3) 2.88 0.64
25 Carbon emissions effect (ENV4) 2.63 0.92
26 Degradation of resources (ENV5) 2.75 1.49
27 Cultural issues (L&E1) 2.63 1.19
28 Lacking standardization (L&E2) 3.13 0.99
29 Issues of openness of data (L&E3) 3.00 0.93
30 Lack of transparency and liability (L&E4) 3.50 1.07
projects in India. One of the experts suggested the inclusion of ethics along with legal aspects for PESTEL analysis. For this reason, the additional categories of governance and ethics were added to PESTEL analysis. In this sense, 31 most rele-vant barriers housed within 6 categories underwent PESTEL analysis in order to know the priorities when using the expert panel inputs.
4.2 Phase 2: Prioritizing the Smart City Development
Barriers by Means of Fuzzy AHP
In this stage, the finalized smart city development barriers and their categories were evaluated to know their significance. Due to human involvement, this process of prioritizing the barriers might be biased, and thus, fuzzy AHP technique is used.
4.2.1 Hierarchical Structure
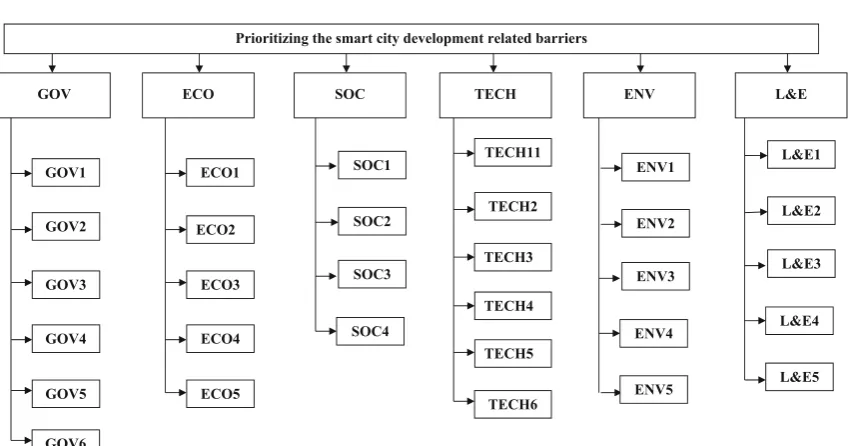
A hierarchical structure for this research is developed using expert inputs. The developed decision hierarchy contains of three distinct levels, given as, prioritizing the barriers to smart city development (at Level-1), six categories of barriers (at Level-2) and thirty-one smart city redevelopment related bar-riers (at Level-3) (see Fig.3).
4.2.2 Formation of the Fuzzy Pair Wise Assessment Matrix
Pair wise assessments are formed for barriers by using ex-perts’inputs by means of a scale (see Table2). The profes-sional in expert panel evaluated the pair wise rating by using linguistic statements and expressions. Expert opinion
(majority of expert’s opinion) (Mangla et al.2015) helped to finalize the pairwise comparison matrix of barriers. We also conducted a group session to locate any major deviation in the pairwise comparisons and develop agreement among expert’s opinions. This iterative process helped to build the rigor in the selection process framework. In addition, use of fuzzy set theory and TFNs helps in managing the consistency for ma-trices (pairwise comparisons). Fuzzy set theory allows experts to provide their inputs using an interval as being illustrated in Table4above. In this sense, pairwise comparison of attributes is shown in Table5. In this way, fuzzy pair wise assessment matrix for categories of barriers is finalized (see Table5). 4.2.3 Barrier Preference Weights and their Relative Importance
The preference weights were devised in correspondance to each category and their specific barriers using Chang’s Extent Analysis method as mentioned in appendix A. The associated Sivalues can be computed, as follows
S1 ¼ð8:58;11:69;14:83Þ
1
68:6482; 1 50:0740;
1 35:7970
¼ð0:1250;0:2335;0:4143Þ
S2 ¼ð7:580;10:2333;13:00Þ
1
68:6482; 1 50:0740;
1 35:7970
¼ð0:1104;0:2044;0:3632Þ
Prioritizing the smart city development related barriers
GOV ECO SOC TECH ENV L&E
GOV1
GOV2
GOV3
GOV4
GOV5
GOV6
ECO1
ECO2
ECO3
ECO4
SOC1
SOC2
SOC3
SOC4
ECO5
TECH11
TECH2
TECH3
TECH4
TECH5
TECH6
ENV1
ENV2
ENV3
ENV4
ENV5
L&E1
L&E2
L&E3
L&E4
L&E5
[image:10.595.86.512.473.696.2]S3¼ð6:0236;7:9483;11:00Þ
1
68:6482; 1 50:0740;
1 35:7970
¼ð0:0877;0:1587;0:3073Þ
S4¼ð5:25;7:7857;11:3939Þ
1
68:6482; 1 50:0740;
1 35:7970
¼ð0:0765;0:1555;0:3183Þ
S5¼ð5:08;7:3333;10:5606Þ
1
68:6482; 1 50:0740;
1 35:7970
¼ð0:0740;0:1464 0:2950Þ
S6¼ð3:2833;4:0833;6:8636Þ
1
68:6482; 1 50:0740;
1 35:7970
¼ð0:0478;0:0815;0:1917Þ
The degree of possibility for two fuzzy numbers is giv-en as,
V S1ð ≥S2Þ ¼ ð0:1104−0:4143Þ
0:2335−0:4143
ð Þ−ð0:2044−0:1104Þ
¼1:0000
V S1ð ≥S3Þ ¼1
V S1ð ≥S4Þ ¼1
V S1ð ≥S5Þ ¼1
V Sð 1≥S6Þ ¼1
Next, the minimum weight vectors for each fuzzy number are calculated:
z0ð Þ ¼C1 min V S1≥S2;S3;;S4;S5;S6
¼min 1ð ;1;1;1;1Þ
¼1
z0ð Þ ¼C2 0:8890 z0ð Þ ¼C3 0:7310
z0ð Þ ¼C4 0:7410
z0ð Þ ¼C5 0:6920 z0ð Þ ¼C6 0:3040
Next, the normalized values and their corresponding sig-nificance weights are computed. Thus, the weight vec-tors for the categories of barriers have been established and hence their relative importance are established (see Table 6).
‘Governance (0.2295)’ is recognised as the most im-portant category of barriers for smart city development f ol l o w e d b y ‘Economic (0.2040)’; ‘Te c h no l o g y (0.1701)’; ‘Social (0.1678)’; ‘Environmental (0.1588)’ and ‘Legal and Ethical (0.0698)’ are shown in Table
5. In the next level, relative and global preference weights of specific barriers are determined (see Table 7). Based on this, the final ranks of barriers for smart city development have been made. Global ranking of barriers is summarized in Table 7.
Since the group of experts comes from divergent background, and the objective is to understand their prioritization of drivers of a larger context, the consen-sus was not computed in the prioritization since that would reduce the difference of priorities among the barriers.
Table 5 Pair-wise judgment matrix for categories of barriers to smart city development
Categories of barriers GOV ECO SOC TECH ENV L&E
GOV 1.00 1.00 1.00 2.00 3.00 4.00 0.25 0.29 0.33 0.33 0.40 0.50 2.00 3.00 4.00 3.00 4.00 5.00
ECO 0.25 0.33 0.50 1.00 1.00 1.00 1.00 2.00 3.00 3.00 3.50 4.00 0.33 0.40 0.50 2.00 3.00 4.00
SOC 3.03 3.45 4.00 0.33 0.50 1.00 1.00 1.00 1.00 0.33 0.50 1.00 0.33 0.50 1.00 1.00 2.00 3.00
TECH 2.00 2.50 3.03 0.25 0.29 0.33 1.00 2.00 3.03 1.00 1.00 1.00 0.50 1.00 2.00 0.50 1.00 2.00
ENV 0.25 0.33 0.50 2.00 2.50 3.03 1.00 2.00 3.03 0.50 1.00 2.00 1.00 1.00 1.00 0.33 0.50 1.00
[image:11.595.306.544.608.712.2]L&E 0.20 0.25 0.33 0.25 0.33 0.50 0.33 0.50 1.00 0.50 1.00 2.00 1.00 2.00 3.03 1.00 1.00 1.00
Table 6 Rank of categories of barriers to smart city development
Categories of barriers Preference weights Ranking
GOV 0.2295 1
ECO 0.2040 2
SOC 0.1678 4
TECH 0.1701 3
ENV 0.1588 5
5 Sensitivity Analysis
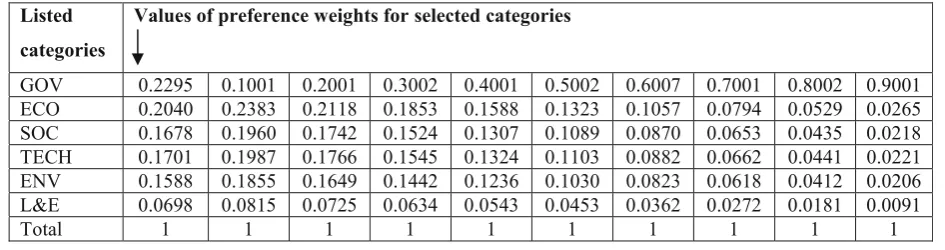
Generally, there is an immense imprecision and vague-ness present in the data collection process. Sensitivity analysis monitors the priority ranking of the recognized barriers to smart cities development. Further, it has a tendency that can determine the smallest change in the ranking with the changes in relative weights of the bar-rier. In this sense, it is sensible to verify the priority ranks by altering the weights of all the categories of barriers (Mangla et al. 2015).
In this research,‘Governance (GOV)’category is the top-most ranked among all (see Table6). This category would affect the other categories of barriers for smart city develop-ment. For that reason, we varied the‘Governance’category relative weights from values 0.1 to 0.9 and changes in the
weights of other categories were noted correspondingly (see Table8).
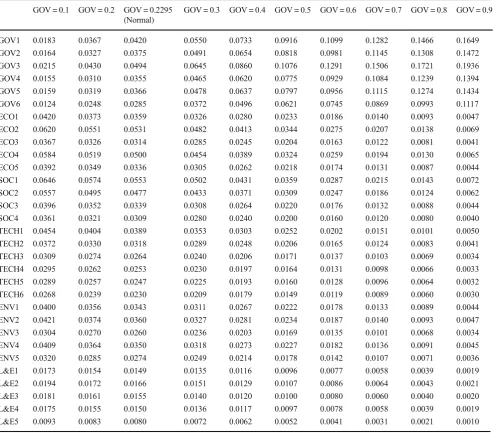
At 0.1 value of‘Governance’category, barrier SOC1 ob-tains the highest rank and barrier L&E5 obob-tains the lowest rank. Barrier SOC1 retains the highest rank and barrier L&E5 the lowest rank value until the normal value (0.2295) for Governance category is reached. From varying the Governance category weights value (from 0.3 to 0.9), barrier GOV3 holds highest rank, and the ranking of other barriers also vary accordingly. The changes in the weights of specific barriers when Governance category weights change from 0.1 to 0.9 have been presented in Table9.
Global preference weight of the smart city development barriers based on sensitivity analysis is shown in Fig.4.
[image:12.595.176.546.58.492.2]From Fig. 4, insignificant changes can be noticed in the global weights of barriers, and thus, the proposed framework
Table 7 Final rank of specific
barriers to smart city development Category of barriers
Specific barriers
Relative preference weights
Relative ranking
Global preference weights
Global ranking
GOV GOV1 0.1832 2 0.0420 6
GOV2 0.1635 3 0.0375 8
GOV3 0.2151 1 0.0494 4
GOV4 0.1549 5 0.0355 12
GOV5 0.1593 4 0.0366 9
GOV6 0.1241 6 0.0285 20
ECO ECO1 0.1762 3 0.0359 11
ECO2 0.2602 1 0.0531 2
ECO3 0.1540 5 0.0314 18
ECO4 0.2449 2 0.0500 3
ECO5 0.1647 4 0.0336 16
SOC SOC1 0.3297 1 0.0553 1
SOC2 0.2842 2 0.0477 5
SOC3 0.2021 3 0.0339 15
SOC4 0.1840 4 0.0309 19
TECH TECH1 0.2286 1 0.0389 7
TECH2 0.1870 2 0.0318 17
TECH3 0.1554 3 0.0264 22
TECH4 0.1486 4 0.0253 24
TECH5 0.1454 5 0.0247 25
TECH6 0.1351 6 0.0230 26
ENV ENV1 0.2157 3 0.0343 14
ENV2 0.2270 1 0.0360 10
ENV3 0.1639 5 0.0260 23
ENV4 0.2207 2 0.0350 13
ENV5 0.1728 4 0.0274 21
L&E L&E1 0.2128 4 0.0149 30
L&E2 0.2374 1 0.0166 27
L&E3 0.2215 2 0.0155 28
L&E4 0.2144 3 0.0150 29
is robust enough to deal with human subjectivity and uncer-tainty in data under fuzzy conditions.
6 Discussion
According to Table6, the categories of barriers follow the order in priority as - Governance (GOV) - Economic (ECO) - Technology (TECH) - Social (SOC) - Environmental (ENV) - Legal and Ethical (L&E). Governance (GOV) categories of barriers obtain the first rank. The implementation of smart city is highly context dependent (nations, government etc.) (Weisi and Ping2014). Governance is one of key concerns in devel-oping an efficient smart cities network. Thus, there is a higher need of better governance to manage several cities initiatives effectively (Chourabi et al. 2012). Within this category, ‘Political instability (GOV3)’obtains the highest priority. Letaifa (2015) suggested that a smart city vision obstructed by political instability. Thus, leaders and practitioners should have a clear vision of the future; and make long-term plans, which could be only possible by political leadership and sta-bility.‘Lack of cooperation and coordination between city’s operational networks (GOV1)’is ranked after GOV3. There is a high need to promote cooperation and coordination between local authorities i.e. city’s operational networks.‘Unclear IT management vision (GOV2)’comes next in the priority list. Chourabi et al. (2012) suggested that the integration of IT with development projects is crucial in smart city context. Next is ‘Poor private-public participation (GOV5)’in this category. It means that policymakers should make efforts to promote private-public participations and investments for better gover-nance in developing a smart city (Lee et al.2014).‘Lack of trust between governed and government (GOV4)’comes after GOV5 according to their priority. Various researchers sug-gested that privacy and security issues are major concerns to develop trust between governed and government in the smart cities context. Khan et al. (2017) suggested in their research that user participation is crucial in managing smart cities data privacy and security related concerns to improve trust between governed and government. Finally, the‘Lack of developing a
common information system model (GOV6)’stands last in the list. It means that common information system is modelled to collect city data to make meaningful decisions or actions in smart cities context.
Economic (ECO) category acquires second place among other barrier categories. Smart cities will require huge infra-structure, modern technologies, based on massive intercon-nected networks of sensors, screens, cameras, smart devices, smart grid etc. to analyse data and or information. Guy et al. (2011) concluded that infrastructure’s development depends
on government regulations and financial resources availabili-ty. This particular category has five specific barriers -‘Lack of competitiveness (ECO2)’obtains the utmost importance. This implies that urban areas need to be managed in such a way that leads to higher economic competitiveness, enhanced social security and ecological sustainability (Monzon 2015). However, the government fails to do that. Following this, the next is‘Global economy volatility (ECO4)’barrier in the list. Global economy volatility can influence the subsidies provided, and results in higher/lower greenhouse gas emis-sions. Subsequently,‘High IT infrastructure and intelligence deficit (ECO1)’shows that huge infrastructure and intelligent/ smart systems are required to develop smart cities. Nevertheless, it requires a lot of funds. The‘Higher operation-al and maintenance cost (ECO5)’barrier is next in terms of priority. Thus, technologists and practitioners must focus im-proving efficiency of the system for refining its sustainability (Mohanty et al.2016). Finally,‘Cost of IT training and skills development (ECO3)’ barrier is the last in the priority se-quence i.e. smart city development requires higher IT training and skills, which is usually very costly.
Technology (TECH) acquired the third importance level among all the categories. Smart cities development needs higher research and technological innovations. There are dif-ferent technological developments related to the IoT and Cloud computing in smart cities (Li et al.2015; Petrolo et al.
[image:13.595.62.535.69.194.2]2017; Whitmore et al.2015). Li et al. (2015) and Whitmore et al. (2015) quoted in their research that IoT technologies will play key role in making cities more efficient and improving the lives of citizens. In this particular category, ‘Lacking
Table 8 Values of category of barriers when increasing Governance category of barriers
Listed
categories
Values of preference weights for selected categories
GOV 0.2295 0.1001 0.2001 0.3002 0.4001 0.5002 0.6007 0.7001 0.8002 0.9001 ECO 0.2040 0.2383 0.2118 0.1853 0.1588 0.1323 0.1057 0.0794 0.0529 0.0265 SOC 0.1678 0.1960 0.1742 0.1524 0.1307 0.1089 0.0870 0.0653 0.0435 0.0218 TECH 0.1701 0.1987 0.1766 0.1545 0.1324 0.1103 0.0882 0.0662 0.0441 0.0221 ENV 0.1588 0.1855 0.1649 0.1442 0.1236 0.1030 0.0823 0.0618 0.0412 0.0206 L&E 0.0698 0.0815 0.0725 0.0634 0.0543 0.0453 0.0362 0.0272 0.0181 0.0091
technological knowledge among the planners (TECH1)’ bar-rier holds the highest priority. In respect to developing a smart
city, it requires technological knowledge among the planners (Letaifa2015), as ‘Lack of access to technology (TECH2)’
[image:14.595.53.547.70.503.2]Fig. 4 Sensitivity analysis of barriers to smart city development
Table 9 Relative weights of barriers by sensitivity analysis when‘Governance’category weights change from 0.1 to 0.9
GOV = 0.1 GOV = 0.2 GOV = 0.2295
(Normal)
GOV = 0.3 GOV = 0.4 GOV = 0.5 GOV = 0.6 GOV = 0.7 GOV = 0.8 GOV = 0.9
GOV1 0.0183 0.0367 0.0420 0.0550 0.0733 0.0916 0.1099 0.1282 0.1466 0.1649
GOV2 0.0164 0.0327 0.0375 0.0491 0.0654 0.0818 0.0981 0.1145 0.1308 0.1472
GOV3 0.0215 0.0430 0.0494 0.0645 0.0860 0.1076 0.1291 0.1506 0.1721 0.1936
GOV4 0.0155 0.0310 0.0355 0.0465 0.0620 0.0775 0.0929 0.1084 0.1239 0.1394
GOV5 0.0159 0.0319 0.0366 0.0478 0.0637 0.0797 0.0956 0.1115 0.1274 0.1434
GOV6 0.0124 0.0248 0.0285 0.0372 0.0496 0.0621 0.0745 0.0869 0.0993 0.1117
ECO1 0.0420 0.0373 0.0359 0.0326 0.0280 0.0233 0.0186 0.0140 0.0093 0.0047
ECO2 0.0620 0.0551 0.0531 0.0482 0.0413 0.0344 0.0275 0.0207 0.0138 0.0069
ECO3 0.0367 0.0326 0.0314 0.0285 0.0245 0.0204 0.0163 0.0122 0.0081 0.0041
ECO4 0.0584 0.0519 0.0500 0.0454 0.0389 0.0324 0.0259 0.0194 0.0130 0.0065
ECO5 0.0392 0.0349 0.0336 0.0305 0.0262 0.0218 0.0174 0.0131 0.0087 0.0044
SOC1 0.0646 0.0574 0.0553 0.0502 0.0431 0.0359 0.0287 0.0215 0.0143 0.0072
SOC2 0.0557 0.0495 0.0477 0.0433 0.0371 0.0309 0.0247 0.0186 0.0124 0.0062
SOC3 0.0396 0.0352 0.0339 0.0308 0.0264 0.0220 0.0176 0.0132 0.0088 0.0044
SOC4 0.0361 0.0321 0.0309 0.0280 0.0240 0.0200 0.0160 0.0120 0.0080 0.0040
TECH1 0.0454 0.0404 0.0389 0.0353 0.0303 0.0252 0.0202 0.0151 0.0101 0.0050
TECH2 0.0372 0.0330 0.0318 0.0289 0.0248 0.0206 0.0165 0.0124 0.0083 0.0041
TECH3 0.0309 0.0274 0.0264 0.0240 0.0206 0.0171 0.0137 0.0103 0.0069 0.0034
TECH4 0.0295 0.0262 0.0253 0.0230 0.0197 0.0164 0.0131 0.0098 0.0066 0.0033
TECH5 0.0289 0.0257 0.0247 0.0225 0.0193 0.0160 0.0128 0.0096 0.0064 0.0032
TECH6 0.0268 0.0239 0.0230 0.0209 0.0179 0.0149 0.0119 0.0089 0.0060 0.0030
ENV1 0.0400 0.0356 0.0343 0.0311 0.0267 0.0222 0.0178 0.0133 0.0089 0.0044
ENV2 0.0421 0.0374 0.0360 0.0327 0.0281 0.0234 0.0187 0.0140 0.0093 0.0047
ENV3 0.0304 0.0270 0.0260 0.0236 0.0203 0.0169 0.0135 0.0101 0.0068 0.0034
ENV4 0.0409 0.0364 0.0350 0.0318 0.0273 0.0227 0.0182 0.0136 0.0091 0.0045
ENV5 0.0320 0.0285 0.0274 0.0249 0.0214 0.0178 0.0142 0.0107 0.0071 0.0036
L&E1 0.0173 0.0154 0.0149 0.0135 0.0116 0.0096 0.0077 0.0058 0.0039 0.0019
L&E2 0.0194 0.0172 0.0166 0.0151 0.0129 0.0107 0.0086 0.0064 0.0043 0.0021
L&E3 0.0181 0.0161 0.0155 0.0140 0.0120 0.0100 0.0080 0.0060 0.0040 0.0020
L&E4 0.0175 0.0155 0.0150 0.0136 0.0117 0.0097 0.0078 0.0058 0.0039 0.0019
[image:14.595.231.547.569.710.2]barrier comes next to TECH1. Monzon (2015) suggested that a majority of the population living in these cities lack the access to technology. Hence, policymakers should make avail-able the necessary technology and arrange training programs to educate the citizens for its accurate usage. Next,‘Privacy and security issues (TECH3)’comes in this category of bar-riers to smart city development. Many researchers highlighted the privacy and security issues in smart cities context (Elmaghraby and Losavio 2014; Belanche-Gracia et al.
2015; van Zoonen2016; Zhang et al.2017).‘System failures issues (TECH4)’ barrier comes next. Colding and Barthel (2017) suggested smart city network is highly vulnerable so as provide ample room for cyber-attacks of different kinds and other forms of incidents such as industrial espionage, terror-ists, equipment failures, worm infestations and natural disas-ters. Next to this is‘Integration and convergence issues across IT networks (TECH5)’ barrier to smart city development. Smart cities require various heterogeneous components to communicate, but in designing, a flexible interface to integrate these heterogeneous components is challenging. Cyber phys-ical networks need to be integrated and supported for an ef-fective data exchange and analysis in smart cities environ-ment. Finally, ‘Poor data availability and scalability (TECH6)’is last in the list. Santana et al. (2017) suggested that policy planners should address the issues related to data quality and its scalability in smart city context. Janssen et al. (2017) and Pereira et al. (2017) revealed in their research that big open data initiatives can help in providing real-time weath-er forecast, pollution and traffic management, creating trans-parency, better decision and policy-making and crisis manage-ment etc., and contribute to enhance the delivery of public value in smart city contexts.
Social (SOC) category of barriers occupies next place in the main priority list. There are several social concerns in developing of smart cities, such as public health and safety, education, and hospital facilities (Solanas et al. 2014). Policymakers need to deal with the social challenges in smart cities development. Colding and Barthel (2017) stipluated that there are multiple socio-economic challenges with massive demographic transition; detrimental environmental impacts may also follow unless adequate measures are taken. This category has four specific barriers to smart city development. ‘Lack of involvement of citizens (SOC1)’is the top ranked barrier in this category. This could be validated from the re-search of Yang and Callahan (2007) that citizens are often criticized due to their low interest and participation. In this sense, policymakers should encourage citizens to contribute in decision-making processes for a sustainable city. Afterwards,‘Low awareness level of community (SOC2)’ barrier comes in this category. It means that community en-gagement is very important for planning and implementing smart cities initiatives. Next to this is‘Geographical diversifi-cation problems (SOC3)’barrier to smart cities development.
In India, with a high geographical diversity, needs large amount of data to analyse urban issues and other geographical processes (Batty2012; Liu et al.2016). Finally,‘Degree of inequality (SOC4)’is last in the hierarchy list of barriers to smart cities development. Therefore, inequalities among the citizens must be reduced to plan smart cities initiatives.
Environmental (ENV) category of barriers occupies fifth place in the priority list. Thus, practitioners, policymakers and citizens must focus to observe various ecological param-eters like air pollution, temperature, vibrations, and noise and make humans consume less energy and water, and even re-duce greenhouse gas emissions etc. (Colding and Barthel
2017). This category has five specific barriers.‘Growing pop-ulation problems (ENV2)’is at the top ranking. In India, the urbanisation is growing rapidly, and cities are likely to expand to 600 million by 2030. Higher population needs more re-sources to fulfil their requirements (Albino et al. 2015). Subsequently,‘Carbon emissions effect (ENV4)’is the next to come in this category. Sadorsky (2014) pointed out that growing urbanization leads to higher carbon emissions and results in lower sustainability. ‘Lacking ecological view in behaviour (ENV1)’comes next. It means that a holistic ap-proach should be adapted to promote ecological view in be-haviour in citizens. Next to this is‘Degradation of resources (ENV5)’to smart cities development. Finally,‘Lack of sus-tainability considerations (ENV3)’is at the end in the list. Policy planners are suggested to include sustainability aspects while designing smart city networks for higher ecological benefits (Luthra et al.2015).
Legal and Ethical (L&E) category of barriers holds the last place in priority list. Kitchin (2015) affirmed that there are several social, ethical and legal issues linked to a smart city initiative. Within this particular category,‘Lacking standardi-zation (L&E2)’barrier is ranked first. Clearly, there is a lack of standards and policy directions on efficient applicability and managing of IoT based networks (Weber2013; Perera et al.
2014; Zanella et al.2014; Weber and Studer2016).‘Issues of openness of data (L&E3)’comes next to the list. Rathore et al. (2016) identified the issues of openness of data are crucial in the smart city agenda. Enabling openness of real time data will help the government authorities as well as citizens. The next barrier i.e.‘Lack of transparency and liability (L&E4)’ indi-cates that higher public involvement and superior transparen-cy in governance is critical in smart cities development (Kandpal et al. 2017). Next barrier in this list is ‘Cultural issues (L&E1)’to smart cities development. Last in the prior-ity list is‘Lack of regulatory norms, policies and directions (L&E5)’. Well-defined regulating norms, polices and direc-tions are needed that help in keeping the user-friendliness to the data users and monitoring all the stakeholders and parties being a part of the system.
barriers,‘Lack of involvement of citizens (SOC1)’;‘Lack of competitiveness (ECO2)’; ‘Global economy volatility (ECO4)’;‘Political instability (GOV3)’and‘Low awareness level of community (SOC2)’have been recognized as top five barriers to smart cities development in Indian context.
6.1 Theoretical Contributions
The present work has several unique contributions, given as follow:
& This study reveals 31 key barriers within 6 categories to smart city development in developing economies, espe-cially in India. The recognized barriers would facilitate policy makers in development of efficient smart city net-work in India. However, in the context of contributing to the theory, the explicit process of fuzzy AHP technique is provided to prioritise the barriers. The proposed research framework is logically sound in analysing the smart city development barriers.
& This study seeks to know the relative importance of bar-riers in smart city development. This research work offers an in-depth understanding of barriers, with a focus on smart city development, for devising both the plan of ac-tion and the suggestive measures in dealing smart city barriers effectively.
6.2 Implications to Practice and Policy
This research is useful to the policymakers who are engaged with smart cities development initiatives in developing coun-tries as India as this help government to understand the prob-able hindrances in successful adoption of smart city in prac-tice. This work offers following important implications for the government and policymakers.
6.2.1 Role of Better Governance and Effective Decision-Making
The role of governance is prominent in developing smart cities within a country. Better governance will help to better co-ordination between central, state governments and parties in-volved in smart cities development to increasing the effective-ness of smart cities related policy decisions and involvement of the public. Government policymakers and practitioners may promote e-governance services to bring about ac-countability and transparency in decision-making pro-cess, which will help smart governance in developing smart cities.
6.2.2 Provision of Higher Resources and Infrastructure
This is important for the management of resources, such as equipment and humans required for performing the intended functions in developing smart cities. Funding and developing infrastructure for smart cities projects remains a challenge, therefore governments must focus on creative solutions and participation by both the public and private sectors. Consequently, having adequate funds and resources allocated are crucial in smart cities initiatives. This research may help removing resources and infrastructure related challenges.
6.2.3 Technological Advancements
In a truly smart city of the future, hyper connection and auto-mation will be paramount. This capability will be dependent on integrating advanced information technologies such as IoT. IoT will help to i) manage infrastructure decisions; ii) improve service level of the end users; iii) enhance levels of cross-sector collaboration and iv) map government policies to deal with climate change related problems.
6.2.4 Awareness among Community
In developing smart cities, smart community development is necessary. Currently, the involvement of community is less integral in smart cities development, particularly in India. It is important to develop an efficient IT infrastructure by aligning the skills and expertise of people involved in the system. Therefore, practitioners and policymakers must focus on smart community planning to act as a catalyst in solving key issues such as environment, transport and security.
6.2.5 Higher Ecological Performance and Sustainable Development
Smart city development puts greater pressure on resource con-sumption, infrastructure, and development practices, which may have a negative impact on the environment. Threfore, it is crucial to measure and assess/evaluate? policies, infrastruc-ture, socio-economic factors, resource use, emissions and any other processes that contribute to quality of life. Hence, logical planning is needed to address social and ecological sustain-ability challenges in smart city development.
7 Conclusion
context. In this work, we used fuzzy AHP to demonstrate the importance of the potential barriers under fuzzy surroundings. A comprehensive review of keywords across various literature surveys disclosed 31 key barriers to smart cities development. These barriers were also confirmed further through a panel of experts. We categorised these barriers into six key categories
with experts’ consultation. The findings revealed
‘Governance’is documented as the most significant category of barriers for smart city development followed by barriers r e l a t e d t o ‘E c o n o m i c ; ‘Te c h n o l o g y’; ‘S o c i a l’; ‘Environmental’and‘Legal and Ethical’categories. The rel-ative and global preference weights of specific barriers are also determined. The sensitivity analysis is performed to ver-ify the stability of the findings obtained in this study. This research is useful to the government and policymakers for eradicating the potential interferences in smart city develop-ment initiatives in developing countries like India.
7.1 Limitations and Future Scope
This work has its own limitations. Firstly, the findings of this study are highly influenced by experts’opinions. The devel-oped solution model may be adopted in other developing countries with minor modifications. Secondly, this research is limited to identifing and prioritising the barriers of smart cities development under six broader categories. The recognised barriers may be evaluated further to know their causal relations in smart city development initiatives through DEMATEL/Fuzzy DEMATEL/Grey DEMATEL techniques. There is also a further scope to develop research based on drivers of smart cities development. Therefore, the future re-search could explore the prioritisation of the drivers. This could provide a useful prescription for policymakers to imple-ment in addition to consideration of this research. Moreover, the researchers could also consider implementing ISM meth-odology (Al-Muftah et al.2018; Dwivedi et al.2017a; Hughes et al.2016; Janssen et al.2018) to understand the driving and dependent barriers. The citizens are one of the most important stakeholders of such developments. Hence, in order to avoid resistance from stakeholders and failure of such initiatives (Dwivedi et al.2015; Hughes et al.2016,2017), the percep-tions of citizens and government employees towards various aspects of smart cities should also be explored by utilising established theories and models (see for example, AlAlwan et al.2017; Dwivedi et al.2011a,2011b,2013,2016,2017b,
2017c; Hossain and Dwivedi 2014; Kapoor et al. 2014a,
2014b,2015; Rana and Dwivedi2015; Rana et al. 2015a,
2015b,2016,2017; Shareef et al.2011,2016a,2016b,2017; Sinha et al.2017; Slade et al.2015; Veeramootoo et al.2018; Weerakkody et al.2013,2017) from information systems and electronic government domains.
Appendix
The calculation procedure of extent analysis method as de-scribed by Luthra et al. (2015) and Mangla et al. (2015) is described as below:
The extent analysis values for the ithobject is represented by O1g
i;O
2 gi;O
3
gi;……::O
p
gi, Consequently, the fuzzy synthetic
extent values are represented as given in below expression.
Si¼∑oj¼1O j gi ∑
n i¼1∑
o j¼1O
j gi
h i
For taking the minimum and maximum values for fuzzy number, the degree of possibility is determined as given in below expression:
V Oð 1≥O2Þ ¼sup min μO1ð Þx μO2ð Þy
;x;y∈R;and x≥y
If;x≥y and fO1ð Þ ¼x fO2ð Þ ¼y 1;then VðO1≥O2Þ ¼1:
Notably, O1and O2are two convex fuzzy numbers, and they must satisfy the following conditions:
V Oð 1≥O2Þ ¼1 if o1≥o2;
V Oð 1≥O2Þ ¼hgt Oð 1∩O2Þ ¼ fo1ð Þm
Next,‘m’denotes the ordinate of the highest intersection point M between the membership functions of two fuzzy num-bers. Hence, M is given as:
V Oð 1≥O2Þ ¼hgt Oð 1∩O2Þ ¼ða−rÞ=ðq−rÞ−ðb−aÞ
While the degree of possibility for‘k’convex fuzzy numbers Oi(i = 1, 2……. . k) can be determined form the following expression:
V Oð ≥O1 ;O2;……::OkÞ
¼V O½ð ≥O1 Þand Oð ≥O2 Þand………and Oð ≥Ok Þ
¼minV Oð ≥Oi Þ;i¼1;2;3;………::;k:
Next, we assume z’(Ci) = min V(Si≥Sk), for k = 1, 2,……, n; k≠i; the weight vector in that case is given as:
W’= (z’(C1), (C1), (C1)…………(C1)) T
; Where Ci (i= 1, 2…... n) are the elements.
For normalization, the below highlighted expression is used. While,‘W’is a non-fuzzy number.
W¼ z’ð ÞC1 ;ð ÞC1 ;ð ÞC1 …………ð ÞC1
T
Survey Questionnaire
selecting the most suitable barriers and exploring their signif-icance to smart cities development. Section C assists in exam-ining the priority of concern of the selected barriers.
Section [A]: General Information
Please highlight only one choice in each question as follows:
1. What is your professional qualification?
(a) Graduate (b) Post Graduate (c) Doctorate
(d) If any other, please specify_____________
2. What is your work experience?
(a) Less than 5 Years (b) 5 to 10 Years (c) 11 to 15 Years (d) 16 to 20 Years (e) Greater than 20 Years
3. What is the size of your organization?
(a) Less than 50 Employees (b) 51 to 250 Employees (c) 251–500 Employees (d) 501–1000 employees (e) 1001–5000 employees (f) Greater than 5001 employees
4. How will you classify work profile?
(a) Private Sector (b) Public Sector
(c) Multinational Corporation (d) Regulatory Bodies
(e) Mixed public and private ownership
(f) If any other, please specify_________________
Section [B]: The Most Relevant Barriers in Smart Cities Development in India
Please rate the following barriers on 5-point Likert scale (‘1’ -Not significant, ‘2’-Somewhat significant,‘3’-Significant, ‘4’-Very significant, and‘5’-Extremely significant). Further, you are also free to add any specific barrier within any main category, which you think, should be included into the list.
S. No. Barriers to Smart Cities Response [In 5-Point Likert Scale]
Governance (GOV)
1 Lack of cooperation and coordination between city’s operational networks (GOV1)
2 Unclear IT management vision (GOV2)
3 Political instability (GOV3)
4 Lack of trust between governed and government (GOV4)
5 Poor private-public participation (GOV5)
6 Lack of developing a common information system model (GOV6)
Please add any other barrier (in your opinion)
Economic (ECO)
7 High IT infrastructure and intelligence deficit (ECO1)
8 Lack of competitiveness (ECO2)
9 Cost of IT training and skills development (ECO3)
10 Global economy volatility (ECO4)
11 Higher operational and maintenance cost (ECO5)
Please add any other barrier (in your opinion)
Social (SOC)
12 Lack of involvement of citizens (SOC1)
13 Low awareness level of community (SOC2)
14 Geographical diversification problems (SOC3)
15 Degree of inequality (SOC4)
Please add any other barrier (in your opinion)
Barriers to smart cities development in India as reported in the literature
Section C: Analysing Identified Barriers to Determine Their Priority for Concern
After finalizing the key barriers to develop smart cities, author would analyse them to priority for concern (their relative im-portance). For determining their priority, it needs to construct the pair wise evaluation matrix for the identified main barriers and for the specific barriers as well. In view of that, please put your response in the pairwise evaluation matrices both for the key categories of barriers and specific barriers. Please use the given fuzzy linguistic scale for entering your responses.
Fuzzy linguistic scale for forming pairwise evaluation matrix.
Pairwise evaluation matrix for main barriers.
Pairwise evaluation matrix for specific barriers.
Uncertain judgment Fuzzy score
Almost equivalent 1/2,1,2
Almost x times more important x-1, x, x + 1
Almost x times less important 1/x + 1, 1/x, 1/x-1
Between y and z times more important y, (y + z)/2, z
Between y and z times less important 1/z, 2/(y + z), 1/y
Note: The value of x ranges from 2, 3...9; whereas the values of y and z can be 1, 2...9, with y < z
16 Lacking technological knowledge among the planners (TECH1)
17 Lack of access to technology (TECH2)
18 Privacy and security issues (TECH3)
19 System failures issues (TECH4)
20 Integration and convergence issues across IT networks (TECH5)
21 Poor data availability and scalability (TECH6)
Please add any other barrier (in your opinion)
Environmental (ENV)
22 Lacking ecological view in behaviour (ENV1)
23 Growing population problems (ENV2)
24 Lack of sustainability considerations (ENV3)
25 Carbon emissions effect (ENV4)
26 Degradation of resources (ENV5)
Please add any other barrier (in your opinion)
Legal and Ethical (L&E)
27 Cultural issues (L&E1)
28 Lacking standardization (L&E2)
29 Issues of openness of data (L&E3)
30 Lack of transparency and liability (L&E4)
31 Lack of regulatory norms, policies and directions (L&E5)
Please add any other barrier (in your opinion)
GOV ECO SOC TECH ENV L&E
GOV (1,1,1)
ECO (1,1,1)
SOC (1,1,1)
TECH (1,1,1)
ENV (1,1,1)
L&E (1,1,1)
GOV1 GOV2 GOV3 GOV4 GOV5 GOV6 Additional
Barrier
GOV1 (1,1,1)
GOV2 (1,1,1)
GOV3 (1,1,1)
GOV4 (1,1,1)
GOV5 (1,1,1)
GOV6 (1,1,1)
Pairwise evaluation matrix for specific barriers.
Pairwise evaluation matrix for specific barriers.
Pairwise evaluation matrix for specific barriers.
Pairwise evaluation matrix for specific barriers.
Pairwise evaluation matrix for specific barriers.
Open Access This article is distributed under the terms of the Creative C o m m o n s A t t r i b u t i o n 4 . 0 I n t e r n a t i o n a l L i c e n s e ( h t t p : / / creativecommons.org/licenses/by/4.0/), which permits unrestricted use, distribution, and reproduction in any medium, provided you give appro-priate credit to the original author(s) and the source, provide a link to the Creative Commons license, and indicate if changes were made.
References
Aijaz, R. (2016). Challenge of making smart cities in India. IFRI Center of Asian Studies. Asie Visions. 1–34. Available at:https://www.ifri. org/sites/default/files/atoms/files/av87_smart_cities_india_aijaz_0. pdf(Last accessed: January 24, 2018).
AlAlwan, A., Dwivedi, Y. K., & Rana, N. P. (2017). Factors influencing adoption of mobile banking by Jordanian Bank customers:
Extending UTAUT2 with trust. International Journal of
Information Management, 37(3), 99–110.
Alawadhi, S., Aldama-Nalda, A., Chourabi, H., Gil-García, J., Leung, S., Mellouli, S., Nam, T., Pardo, T. A., Scholl, H. J. and Walker, S. (2012). Building understanding of smart city initiatives.Electronic Government, 40–53.
Albino, V., Berardi, U., & Dangelico, R. M. (2015). Smart cities: Definitions, dimensions, performance, and initiatives.Journal of Urban Technology, 22(1), 3–21.
Al-Muftah, H., Weerakkody, V., Rana, N.P., Sivarajah, U., and Irani, Z. (2018). E-diplomacy Implementation: Exploring Causal Relationships Using Interpretive Structural Modelling.
Government Information Quarterly,https://doi.org/10.1016/j.giq. 2018.03.002.
Angelidou, M. (2015). Smart cities: A conjuncture of four forces.Cities, 47, 95–106.
Bakıcı, T., Almirall, E., & Wareham, J. (2013). A smart city initiative: The case of Barcelona.Journal of the Knowledge Economy, 4(2), 135–
148.
Ballon, P., Glidden, J., Kranas, P., Menychtas, A., Ruston, S. and Van Der Graaf, S. (2011). Is there a need for a cloud platform for European smart cities? IneChallenges e-2011 Conference Proceedings on IIMC International Information Management Corporation,1–7. Balta-Ozkan, N., Davidson, R., Bicket, M., & Whitmarsh, L. (2013).
Social barriers to the adoption of smart homes.Energy Policy, 63, 363–374.
Batty, M. (2012). Smart cities, big data. Centre for advanced spatial anal-ysis. Available at:http://www.spatialcomplexity.info/files/2014/03/ BATTY-TECHNION1.pdf(Accessed on: January 19, 2018). ECO1 ECO2 ECO3 ECO4 ECO5 Additional
Barrier
ECO1 (1,1,1)
ECO2 (1,1,1)
ECO3 (1,1,1)
ECO4 (1,1,1)
ECO5 (1,1,1)
Additional Barrier
SOC1 SOC2 SOC3 SOC4 Additional Barrier
SOC1 (1,1,1)
SOC2 (1,1,1)
SOC3 (1,1,1)
SOC4 (1,1,1)
Additional Barrier
TECH1 TECH2 TECH3 TECH4 TECH5 TECH6 Additional Barrier
TECH1 (1,1,1) TECH2 (1,1,1)
TECH3 (1,1,1)
TECH4 (1,1,1)
TECH5 (1,1,1)
TECH6 (1,1,1)
Additional Barrier
ENV1 ENV2 ENV3 ENV4 ENV5 Additional Barrier
ENV1 (1,1,1)
ENV2 (1,1,1)
ENV3 (1,1,1)
ENV4 (1,1,1)
ENV5 (1,1,1)
Additional Barrier
L&E1 L&E2 L&E3 L&E4 L&E5 Additional Barrier
L&E1 (1,1,1)
L&E2 (1,1,1)
L&E3 (1,1,1)
L&E4 (1,1,1)
L&E5 (1,1,1)