International Journal of Emerging Technology and Advanced Engineering
Website: www.ijetae.com (ISSN 2250-2459, ISO 9001:2008 Certified Journal, Volume 5, Issue 5, May 2015)
50
Machining Parameters Selection for Milling Operations Using
Shuffled Frog-Leaping Algorithm
Gomez-Gonzalez, M.
1, Jurado, F.
21
Department of Mechanical Engineering, University of Jaen, EPS Linares, 23700
2Department of Electrical Engineering, University of Jaen, EPS Linares, 23700
Abstract—This paper introduces a Shuffled Frog-Leaping Algorithm based method for the optimization of machining parameters for milling operations. An objective function based on maximum profit in milling operation has been used. The algorithm is compared with others techniques and outperforms the results reached by standard shuffled frog-leaping algorithm, differential evolution, particle swarm optimization and genetic algorithms. Consequently, this algorithm can be used in the selection of optimal machining parameters in milling operations.
Keywords— Milling, machining parameters, shuffled frog-leaping algorithm, differential evolution, genetic algorithms, particle swarm optimization
I. INTRODUCTION
Optimum machining parameters are of great concern in manufacturing environments, where economy of machining operation plays a key role in competitiveness in the market. There is an economic need to operate Numerical Control (NC) machines as efficiently as possible in order to obtain the required pay-back. This is due to the high capital and machining costs of the NC machines in comparison with conventional machines.
Experience and the handbook recommendation are used to select convenient machine parameters in manufacturing industry, but these may not guarantee the optimum performance and minimization of costs [1].
Many efforts have been made to optimize machining parameters. First study that considers the optimal cutting parameters was published by Taylor in 1907 [2]. Subsequently, some methods has been reported in the literature to solve optimization problems for machining parameters, such as nomograms [3], graphical techniques [1,4,5], linear programming [6], geometric programming [7], dynamic programming [8-10] and artificial intelligence.
Some improvements on optimization of machining parameters in milling operations have been made. In recent years, there has been increasing interest on the approaches to optimize the machining parameters and machining economic problems, because of the complexity of machine parameters, objective functions and constraints.
Artificial Intelligence based methods, as genetic algorithms (GAs), differential evolution (DE) and particle swarm optimization (PSO), have also been used on optimization of machining parameters for milling operations [11-14]. Despite the fact that evolutionary algorithms do not guarantee the global optimum, their convergence speeds to the optimal results are better than those of the traditional techniques. The results and the convergence of are better when the evolutionary methods are modified or hybridized by using other optimization techniques [15-18]. However, the study of the efficiency, robustness and convergence of the proposed methods are missing in some papers.
This paper presents a new model to select the optimal machining parameters in milling operations applying a stochastic search algorithm, the Shuffled Frog Leaping Algorithm, (SFLA) [19]. In addition, this algorithm is modified and improved. The technique is compared with other evolutionary algorithms, DE, GAs and PSO. The results of the proposed approach for the case study show that the proposed approach is more effective to optimize the cutting parameters for milling operations than DE, GAs, PSO, standard SFLA, the feasible direction method [1] and handbook recommendation [20].
II. PROBLEM DESCRIPTION:OBJECTIVE FUNCTION AND
CONSTRAINTS
Depth of cut, feed rate and cutting speed produce a greatest effect on the success of machining operation. Depth of cut is usually predetermined by the workpiece geometry and operation sequence. It is recommended to machine the features with the required depth in one pass to keep machining time and cost low, when possible. Therefore, the problem of determining machining parameters is reduced to determining the proper cutting speed and feed rate combination [1]. The optimization model used in [1] is considered in this paper.
The total profit rate is used in this work as objective function, it is defined as follow:
p u r
u
S C
P T
International Journal of Emerging Technology and Advanced Engineering
Website: www.ijetae.com (ISSN 2250-2459, ISO 9001:2008 Certified Journal, Volume 5, Issue 5, May 2015)
51
Where the unit cost come given by:
1 1
0 0 1
1
(1/ ) 1 [( )/ ] 1
3 0
1 1
( ) ( )
( )
m
u mat l s l i i i
i
m m
n w g n
ti i i i l
i i
C c c c t c c K V f
c K V f c c
(2)And the unit time to produce a part in the case of multi-tool milling can be represented by:
1 1
1
1 1
m m
u s i i i tci
i i
T t K V f t
(3)The constraints are considered in this paper are the three following:
- Maximum machine power.
- Surface finish requirement.
- Maximum cutting force permitted by the rigidity of the tool.
The required machining power should not exceed available motor power. Therefore the power constraint can be written as:
0.8
5i i i 1
C V f (4)
Where 0.8 , 5 0.78 60
p i rad i i i i i
i m
K W z a a V f
C
d eff P
(5)
The required surface finish must not exceed maximum attainable surface finish under the conditions. Therefore the surface finish constraint for end milling becomes:
6i i 1
C f (6)
Where
1
6
( )
318 [tan( i) cot( i)]
i a at la ca C R (7)
And for end milling:
2 7i i 1
C f (8)
Where
1
7
( ),
318 (4 i)
i
a at i
d C R (9)
The total cutting force FC resulting from the machining
operation must not exceed the permitted cutting force
FC(per) that the tool can withstand. Permitted values of
cutting forces have been introduced by tool manufacturers for different tools. The permitted cutting force for each tool has been considered as its maximum limit for cutting forces. Therefore, considering C8i1/FC per i( ), , the cutting
force constraint becomes
8i Ci 1
C F (10)
III. SHUFFLED FROG-LEAPING ALGORITHM (SFLA)
A. Classical approach
SFLA is originally developed by Eusuff and Lansey [19]. SFLA is a memetic meta-heuristic that is designed to seek a global optimal solution by performing an informed heuristic search using a heuristic function. It is based on evolution of memes carried by interactive individuals and a global exchange of information among the population. SFLA progresses by transforming ‖frogs‖ in a memetic evolution. In this algorithm, frogs are seen as hosts for memes and described as a memetic vector. Each meme consists of a number of memotypes. The memotypes represent an idea in a manner similar to a gene representing a trait in a chromosome in a genetic algorithm. SFLA does not change the physical characteristics of an individual rather it progressively improves the ideas held by each frog in a so-called virtual population. The frogs can communicate with each other, and can improve their memes by infecting (passing information) each other. Improvement of memes results in changing an individual frog’s position by adjusting its leaping step size. Based on this abstract model of virtual frogs, SFLA draws on PSO as a local search tool and the idea of competitiveness and mixing information from parallel local searches to move toward a global solution.
In SFLA, each possible solution [ ,1, ,2,..., , ] V i xi xi xi N
x
where NV is the number of the variables is considered as a
frog. The steps of the algorithm are as follows:
Create an initial population of P frogs generated randomly. The frogs are then sorted in descending order according to their fitness.
Divide the frogs into NM memeplexes each holding NF
frogs such that P = NM×NF. The division is done with the
first frog going to the first memeplex, second one going to the second memeplex, the NM-th frog go to the NM-th
memeplex and the NM+1-th frog back to the first
International Journal of Emerging Technology and Advanced Engineering
Website: www.ijetae.com (ISSN 2250-2459, ISO 9001:2008 Certified Journal, Volume 5, Issue 5, May 2015)
52
For each memeplex, k, the frogs with the best fitness and worst fitness are identified as xbest,k and xworst,k respectively.
Also the frog with the global best fitness xgbest is identified.
Then the position of the worst frog for the memeplex k is adjusted at the time or iteration t as follows:
1
, ,
t t t
worst k worst k k
x x d (11)
1 1
, ,
( )
t t t
k rand best k worst k
d x x (12)
Where [ ,1, ,2,..., , ] V k dk dk dk N
d with Dmindk j, Dmax
(Dmax and Dmin are the maximum and minimum allowed
change in a frog’s position, respectively); rand is a random number between 0 and 1.
If this process produces a better solution, it replaces the worst frog. Otherwise, the calculations in Eqs. (11) and (12) are repeated but with respect to the global best frog (i.e. xgbest replaces xbest). If no improvement becomes
possible in this case, then a new solution is randomly generated to replace that frog.
Continue the calculation of step 3 for a specific number of iterations.
Reshuffle the frogs and sort them again.
Return back to step 2, if the termination criterion is not met, else stop.
The local search and the shuffling processes continue until defined convergence criteria are satisfied, for example, a specific number of iterations. Accordingly, the main parameters of SFLA are: number of frogs; number of memeplexes; number of generation for each memeplex before shuffling; number of shuffling iterations; and maximum step size.
B. Proposed Shuffled Frog-Leaping Algorithm
In this work, it has been embedded a particle swarm optimization in a shuffled frog-leaping algorithm. The proposed Shuffled Frog-Leaping Algorithm, MSFLA, modifies the step 3 of the classical SFLA. The change vector is updated by applying the following equation:
1 1
1 2 1 , ,
1 1
3 2 ,
t t t t t t
k k best k worst k
t t t
gbest worst k
r r c
r c
d a x x
x x
(13)
Vectors xtworst k1 , , xtpbest k1 , and xtgbest1 , have already been defined; [ ,1, ,2,..., , ]
V
t t t t
k ak ak ak N
a is a vector whose components are generated randomly between a maximum and a minimum, c1 and c2 are positive constant numbers,
normally 2, and r r1t, 2tandr3tare random numbers between 0 and 1.
If this process produces a better solution, it replaces the worst frog. If no improvement becomes possible in this case, then a new solution is randomly generated to replace that frog.
In order to provide exploration at the first iterations and more exploitation at the last iterations, the inertial coefficients r r1t, 2tandr3t are defined in the followings
equations:
,max ,min
1 ,max max
max
( 1) ( )
1, 2,...,
( 1)
t t p p
r p t t
t
(14)
2 1 (1 1)
t t t
p
r r r p (15)
3 2 (1 1)
t t t
g
r r r p (16)
Wherepw,max,pw,min,pp andpgare positive constants which define the ratio between the inertial coefficients. In order to establish their values, it must meet the following:
,min ,max
0pw pw 1;0pp0.5 and pp pg.
1, 2and 3
t t t
r r r evolve at each iteration. 1t
r is calculated by means of a lineally decreasing function. Therefore, the values of r2t and r3t are increased with the iterations.
International Journal of Emerging Technology and Advanced Engineering
Website: www.ijetae.com (ISSN 2250-2459, ISO 9001:2008 Certified Journal, Volume 5, Issue 5, May 2015)
[image:4.612.104.563.89.712.2]53
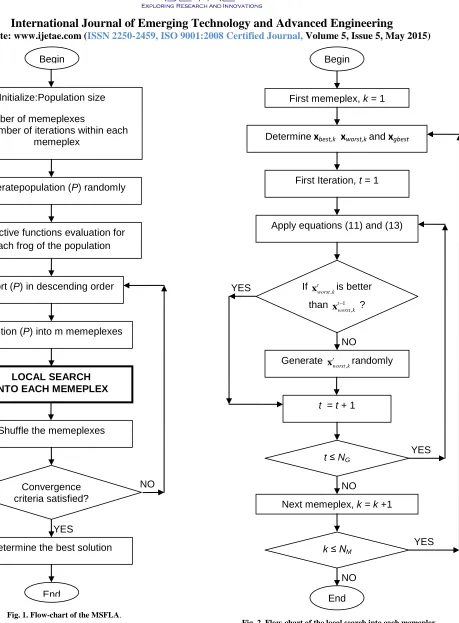
Fig. 1. Flow-chart of the MSFLA.
Fig. 2. Flow-chart of the local search into each memeplex.
Begin
Initialize:Population size
- Number of memeplexes
- Number of iterations within each memeplex
Objective functions evaluation for each frog of the population Generatepopulation (P) randomly
Sort (P) in descending order
Partition (P) into m memeplexes
LOCAL SEARCH INTO EACH MEMEPLEX
Shuffle the memeplexes
Convergence criteria satisfied?
Determine the best solution YES
NO
End
k ≤ NM
First memeplex, k = 1
Apply equations (11) and (13)
Next memeplex, k = k +1 First Iteration, t = 1
Generate t , worst k
x randomly
If , t worst k
x is better than 1
, t worst k
x ?
Determine
xbest,k
xworst,k
andxgbest
Begin
t ≤ NG
End
t = t + 1
YES YES YES
NO
NO
[image:4.612.331.564.128.705.2]International Journal of Emerging Technology and Advanced Engineering
Website: www.ijetae.com (ISSN 2250-2459, ISO 9001:2008 Certified Journal, Volume 5, Issue 5, May 2015)
54
IV. APPLICATION AND RESULTS
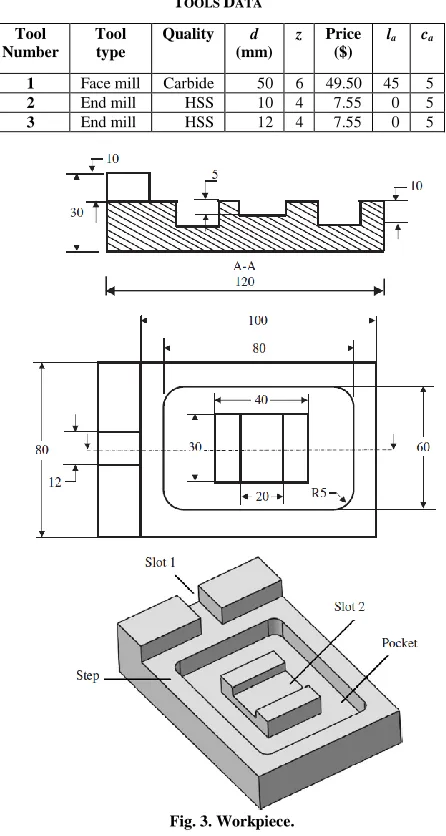
MSFLA is tested for the optimization of machining parameters for milling operations with the workpiece shown in Figure 3 is to be produced using a CNC milling machine. The workpiece includes four machining features: step, pocket and two slots. Different tools have been selected to machine these features. It is desirable to find the optimum machining parameters, which result in the maximum profit rate. Specifications of the machine, material and values for constants are given below. Also, the geometric information on the required machining operations and tools is presented in Tables 1 and 2.
Constants:
Sp=$25 cmat=$0.50 c0=$1.45 per min cl=$0.45 per min
ts=2 min ttc=0.5 min
C=33.98 for HSS tools
Kp=2.24 W=1.1
n=0.15 for HSS tools
n=0.3 for carbide tool
g=0.14
Machine tool data:
Type: Vertical CNC milling machine
Pm=8.5 kW eff=95% Material data:
Quality 10L50 leaded steel Hardness=225 BHN
TABLE I
REQUIRED MACHINING OPERATIONS.
Operation Number
Operation type
Tool Number
a
(mm)
K
(mm)
Ra
(μm)
FC (per)
1 Face
milling
1 10 450 2 156449.40
2 Corner milling
2 5 90 6 17117.74
3 Pocket milling
2 10 450 5 17117.74
4 Slot
milling 1
3 10 32 - 14264.78
5 Slot
milling 2
3 5 84 1 14264.78
TABLE II TOOLS DATA
Tool Number
Tool type
Quality d
(mm)
z Price ($)
la ca
1 Face mill Carbide 50 6 49.50 45 5
2 End mill HSS 10 4 7.55 0 5
[image:5.612.335.558.148.566.2]3 End mill HSS 12 4 7.55 0 5
Fig. 3. Workpiece.
[image:5.612.309.572.621.699.2]The speed and feed rate limits considered for the milling operations are shown in Table 3:
TABLE III SPEED AND FEED RATE LIMITS
Operation Nº
Operation type Speed limits Feed rate limits
1 Face milling 60-120 m/min 0.05-0.4 mm/tooth
2 Corner milling 40-70 m/min 0.05-0.5 mm/tooth
3 Pocket milling 40-70 m/min 0.05-0.5 mm/tooth
4 Slot milling 1 30-50 m/min 0.05-0.5 mm/tooth
International Journal of Emerging Technology and Advanced Engineering
Website: www.ijetae.com (ISSN 2250-2459, ISO 9001:2008 Certified Journal, Volume 5, Issue 5, May 2015)
55
MSFLA is used to search the optimal machining parameters for the five milling operations described. Each frog x contains ten members: five speeds and five feed rates. The i-th frog is represented as follows:
1, 2, 3, 4, 5, 1, 2, 3, 4, 5,
[ , , , , , , , , , ]
i V Vi iViV iV i f i f i f i f i f i
x . If there are
P number of frogs in a population, then the dimension of a population is 10∙P. The objective function to minimize is Pr
defined in Eq. (1).
A comparative study with DE, GAs PSO and SFLA was done to validate and verify the performance of the proposed algorithm. With the aim to perform a fair comparison between the chosen metaheuristics, the number of evaluations of the objective function and the computation time must be similar in all approaches. The suitable choice of the parameters allows more flexibility to increase the efficiency, capacity and performance of the algorithm used. The proposed work has been implemented in MATLAB (R2014a) (The Mathworks, 2014). Computing environment with Core i5, 2.80 GHz computer with 4.00 GB RAM. Table 4 shows the data used in the simulations.
TABLE IV
DATA USED IN THE SIMULATIONS WITH MSFLA, SFLA, GAS, DE AND PSO
SIMULATIONS DATA – MSFLA and SFLA
P 60
NM 10
NF 6
NG 3
tmax 50
SIMULATIONS DATA – GAs [23]
Population size 40 Max generations 50 Crossover rate 0.8 Mutation rate 0.05
SIMULATIONS DATA – DE [24]
Population size 30 Max generations 50 Combination rate 1
Mutation rate 0.3
SIMULATIONS DATA – PSO [25]
Population size 30 Max generations 50 Acceleration factors 2 Initial inertia weight 0.9
Final inertia weight 0.4
In this work, the optimization problem is solved taking into account two cases:
Considering as constraint the maximum machine power,
Pm=8.5kW:
The maximum machine power is not considered as constraint.
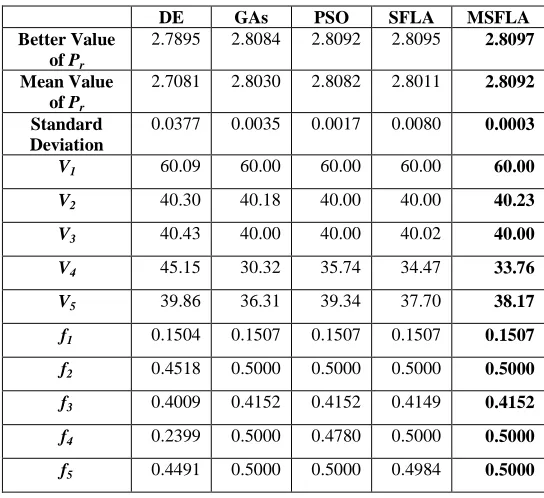
Simulations are carried out for 50 independent runs in order to verify the robustness of the proposed algorithm. The parameters and comparative results among the proposed MSFLA, DE, GAs, PSO and SFLA are presented in Tables 5 and 6. These tables show the standard deviation, mean and maximum values of the objective function. MSFLA has better results than DE, GAs, PSO and SFLA. The value of the objective function is higher with MSFLA. It can be seen that the MSFLA is more robust and efficient than the DE, GAs, PSO and SFLA. The standard deviation of the objective function values for 50 runs is the lowest with the MSFLA method.
TABLE V
RESULTS OF THE ALGORITHMS AFTER 50 RUNS CONSIDERING AS CONSTRAINT THE MAXIMUM MACHINE POWER.
DE GAs PSO SFLA MSFLA
Better Value of Pr
2.7895 2.8084 2.8092 2.8095 2.8097
Mean Value of Pr
2.7081 2.8030 2.8082 2.8011 2.8092
Standard Deviation
0.0377 0.0035 0.0017 0.0080 0.0003
[image:6.612.307.579.379.628.2] [image:6.612.67.269.401.656.2]International Journal of Emerging Technology and Advanced Engineering
Website: www.ijetae.com (ISSN 2250-2459, ISO 9001:2008 Certified Journal, Volume 5, Issue 5, May 2015)
56
TABLE VI
RESULTS OF THE ALGORITHMS AFTER 50 RUNS WHERE THE MAXIMUM MACHINE POWER IS NOT CONSIDERED AS CONSTRAINT
DE GAs PSO SFLA MSFLA
Better Value of Pr
3.8806 3.9235 3.9291 3.9281 3.9294
Mean Value of Pr
3.8008 3.9153 3.9256 3.8990 3.9284
Standard Deviation
0.0478 0.0074 0.0027 0.0235 0.0013
V1 110.32 116.98 120.00 115.54 119.06 V2 45.46 41.40 40.19 40.00 40.20 V3 40.02 40.60 40.00 40.00 40.00 V4 39.38 38.35 35.23 38.59 35.73 V5 38.64 36.84 39.10 40.79 39.63 f1 0.3800 0.4000 0.4000 0.4000 0.4000 f2 0.4131 0.5000 0.5000 0.5000 0.4996 f3 0.4665 0.5000 0.5000 0.4975 0.5000 f4 0.4383 0.5000 0.5000 0.5000 0.5000 f5 0.4077 0.5000 0.4976 0.5000 0.4999
Nevertheless, with the results obtained from MSFLA for the case b), the required machining power at each operation is given in table 7. Operations 2 and 5 do not exceed available motor power of 8.5 kW.
TABLE VII
REQUIRED MACHINING POWER WHERE THE MAXIMUM MACHINE POWER IS NOT CONSIDERED AS CONSTRAINT
Machining power MSFLA
Pm1 36.84
Pm2 4.95
Pm3 9.86
Pm4 8.81
Pm5 4.89
In table 8 the results of the case a) are compared with those resulting from the method of feasible direction [1] and handbook recommendation [20]. It is observed that evolutionary algorithms give better than those from the traditional techniques.
TABLE VIII
COMPARISON WITH TRADITIONAL TECHNIQUES CONSIDERING AS CONSTRAINT THE MAXIMUM MACHINE POWER
Method Pr ($/min)
Handbook [20] 0.71
Method of feasible direction [1] 2.49
DE 2.7895
GAs 2.8084
PSO 2.8092
SFLA 2.8095
MSFLA 2.8097
Finally, figures 4 and 5 compare the mean value for objective function versus computation time when 50 replicate simulation runs are performed.
[image:7.612.35.305.165.424.2]In Figures 4 and 5 is shown that MSFLA converges before and reaches better results than the rest of algorithms. GAs, PSO and SFLA tend to good solutions in a few iterations. But, these are of less quality and the accuracy is lower than that obtained with the proposed MSFLA. More particles and iterations are necessary using DE, GAs, PSO and SFLA to reach similar results than those from MSFLA, therefore the computational cost is higher.
[image:7.612.347.538.167.269.2] [image:7.612.331.545.410.599.2] [image:7.612.102.235.508.588.2]International Journal of Emerging Technology and Advanced Engineering
Website: www.ijetae.com (ISSN 2250-2459, ISO 9001:2008 Certified Journal, Volume 5, Issue 5, May 2015)
[image:8.612.65.271.147.337.2]57
Fig. 5. Convergence curves for DE, GAs, PSO, SFLA and MSFLA in case b)
V. CONCLUSIONS
This paper has proposed a model to select the optimal machining parameters in milling operations applying a stochastic search algorithm, a modified Shuffled Frog Leaping Algorithm, MSFLA. Maximum profit in milling operation has been used as objective function. The results has been tested and compared with those resulting from DE, GAs, PSO, SFLA, the method of feasible direction and handbook recommendation. Computer simulation reduction has demonstrated the good performance of the proposed method, which is more robust, converges before and has produced better results than the other methods. The solutions obtained are of better quality and the errors or deviations have been smaller. From the comparative of results, it can be resolved that MSFLA is reasonable to make optimal systems with multiobjective functions such as parameters for machining operations.
Nomenclature
A Chip cross sectional area (mm2)
a, arad Axial depth of cut, radial depth of cut
(mm)
C Constant in cutting speed equation CNC Computer numerical control
ca Clearance angle of the tool (degrees) Ci (i=1-8) Coefficients carrying constants values. cl and c0 Labor cost, overhead cost ($/min). cm , cmat , ct Axial depth of cut, radial depth of cut
(mm).
Cu Unit cost ($).
c1 and c2 Positive constant numbers.
d Cutter diameter (mm) DE Differential evolution
Dmax Maximum allowed change in a frog’s
position
Dmin Minimum allowed change in a frog’s
position.
t k
d Change vector of the k memeplex in
iteration t
eff Machine tool efficiency factor F Feed rate (mm/min)
f Feed rate (mm/tooth)
FC , FC(per) Cutting force, permitted cutting force
(N).
G, g Slenderness ratio, exponent of
slenderness ratio
NG Number of generations for each
memeplex before shuffling
GAs Genetic algorithms
K Distance to be travelled by tool to
perform the operation (mm)
Ki (i=1-3) Coefficients carrying constant values Kp Power constant depending on the
workpiece material
la Lead (corner) angle of the tool NM Number of memeplexes
MSFLA Modified Shuffled Frog-Leaping
Algorithm
NF Number of frogs in every memeplex NV Number of variables, which is considered
as a frog
International Journal of Emerging Technology and Advanced Engineering
Website: www.ijetae.com (ISSN 2250-2459, ISO 9001:2008 Certified Journal, Volume 5, Issue 5, May 2015)
58
m Number of machining operations
required to produce the product
P Population of frogs
Pm Required power for the operation, motor
power (kW)
Pr Total profit rate ($/min) PSO Particle Swarm Optimisation
Q Contact proportion of cutting edge with
workpiece per revolution
R Sale price of the product excluding
material, sep-up and tool changing costs ($)
Ra , Ra(at) Arithmetic value of surface finish, and
attainable surface finish (μm)
Sp Sale price of the product ($)
rand, rand1 Random number between 0 and 1
1, 2and 3
t t t
r r r Random number between 0 and 1 at the t-th iteration
SFLA Shuffled Frog-Leaping Algorithm
T , Tu Tool life (min), unit time (min)
tm , ts , ttc Machining time, setp-up time, tool
changing time (min)
t Time or iteration
tmax Number of shuffling iterations V Cutting speed (m/min)
w Exponent of chip cross-sectional area W Tool wear factor
xi Position of the particle or frog i
, t best k
x Frog with the best fitness of the memeplex k in iteration t
, t worst k
x Frog with the worst fitness of the memeplex k in iteration t
t gbest
x Frog with the global best fitness in iteration t
z Number of cutting teeth of the tool REFERENCES
[1] Tolouei-Rad M and I.M. Bidhendi. 1997. ―On the optimization of machining parameters for milling operations‖. International Journal of Machine Tools and Manufacture, 37(1), pp. 1–16. DOI: 10.1016/S0890-6955(96)00044-2.
[2] Taylor F.W. 1907. ―On the art of cutting metals‖. Transations of the American Society Mechanical Engineers, 28 (31).
[3] Brewer R.C. and R.A. Reuda. 1963. ―A simplified approach to the optimum selection of machining parameters‖. Engineers’ Digest, 24 (9), pp. 131-151.
[4] Wang J. 1998. ―Computer-aided economic optimization of end-milling operations‖. International Journal of Production Economics, 54(3), pp. 307–320. DOI: 10.1016/S0925-5273(98)00008-5.
[5] Kilic S.E, C. Cogun and D.T. Sen. 1993. ―A computer-aided graphical technique for the optimization of machining conditions‖. Computers & Industrial Engineering, 22(3), pp. 319–326. DOI: 10.1016/0166-3615(93)90099-M.
[6] Ermer D. S., and D. C. Patel. 1974. ―Maximisation of production rate with constraints by linear programming and sensitivity analysis‖. Proceedings Second North American Metalworking Research Conference.
[7] Petropoulos P.G. 1973. Optimal selection of machining rate variable by geometric programming. International Journal of Production Research, 11(4), pp. 305–314. DOI: 10.1080/00207547308929981. [8] Shin Y.C. and Y.S.Joo. 1992. ―Optimizationof machining
conditions with practical constraints‖. International Journal of Production Research, 30(12), pp. 2907–2919. DOI: 10.1080/00207549208948198.
[9] Armarego E.J.A., A.J.R. Smith and J. Wang. 1994. ―Computer-aided constrained optimization analyses and strategies for multipass helical tooth milling operation‖. CIRP Annals – Manufacturing Technology, 43(1), pp. 437–442. DOI: 10.1016/S0007-8506(07)62248-3. [10] Sonmez A.I., A. Baykasoglu, T. Dereli and I.H. Filiz.
1999.―Dynamic optimization of multipass milling operations via genetic programming‖. International Journal of Machine Tools and Manufacture, 39, pp. 297–320. DOI: 10.1016/S0890-6955(98)00027-3.
[11] Shunmugam M.S, S.V.B. Reddy and A.A. Narendran. 2000. ―Selection of optimal conditions in multi-pass face-milling using a genetic algorithm‖. International Journal of Machine Tools and Manufacture, 40(3), pp. 401–414. DOI: 10.1016/S0890-6955(99)00063-2.
[12] Tandon V, H. El-Mounayriand H. Kishawy. 2002.―NC end milling optimization using evolutionary computation‖. International Journal of Machine Tools and Manufacture, 42(5), pp. 595–605. DOI: 10.1016/S0890-6955(01)00151-1.
[13] Baskar N, P. Asokan, R. Saravanan, G. Prabaharan. 2002. ―Selection of Optimal conditions in Multi-Pass Face Milling using Non Conventional Methods‖. Proceedings of the 20th All India Manufacturing Technology, Design and Research Conference. [14] Baskar N, P. Asokan, R. Saravanan, G. Prabaharan. 2005.
―Optimization of machining parameters for Milling operations using non-conventional methods‖. International Journal of Advanced Manufacturing Technology, 25, pp. 1078-1088. DOI: 10.1007/s00170-003-1939-9.
[15] Yen J, J.C.Liao, D. Randolph and B. Lee. 1995. ―A hybrid approach to modelling metabolic systems using genetic algorithm and simplex method‖. Proceedings of the 11th IEEE conference on artificial intelligence for applications, CAIA95, Los Angeles, CA. DOI: 10.1109/CAIA.1995.378811
[16] Liu Y.M. and C.J.Wang. 1999. ―A modified genetic algorithm based optimization of milling parameters‖. International Journal of Advanced Manufacturing Technolog, 15(11), pp. 796–799. DOI: 10.1007/s001700050134.
[17] Wang Z.G., Y.S. Wong and M. Rahman. 2004.―Optimisation of multi-pass milling using genetic algorithm and genetic simulated annealing International Journal of Advanced Manufacturing Technology, 24(9–10), pp. 727–732. DOI: 10.1007/s00170-003-1789-5.
International Journal of Emerging Technology and Advanced Engineering
Website: www.ijetae.com (ISSN 2250-2459, ISO 9001:2008 Certified Journal, Volume 5, Issue 5, May 2015)
59
[19] Eusuff, M. K. Lansey and F. Pasha. 2006. ―Shuffled frog-leaping algorithm: a memetic meta-heuristic for discrete optimization‖. Engineering Optimization, 38(2), pp. 129-154. DOI: 10.1080/03052150500384759.
[20] MDC (Machinability Data Center). 1980. ―Machining data handbook‖. Vol. 1. 3rd ed. Cincinnati: Metcut Research Associates Inc.
[21] Gomez-Gonzalez, M., Ruiz-Rodriguez, F.J., Jurado F. 2014. ―Probabilistic optimal allocation of biomass fueled gas engine in unbalanced radial systems with metaheuristic techniques‖. Electric Power Systems Research, 108, pp. 35-42. DOI:10.1016/j.epsr.2013.10.018
[22] Ruiz-Rodriguez, F.J., Gomez-Gonzalez, M., Jurado F. 2014. ―Reliability optimization of an electric power system by biomass fuelled gas engine‖. International Journal of Electrical Power & Energy Systems, 61, pp. 81-89. DOI:10.1016/j.ijepes.2014.03.019 [23] Holland J. H. 1975. Adaptation in Natural Artificial Systems, An
Introductory Analysis with Application to Biology Control Artificial Intelligence, The University of Michigan Press, Ann Arbor, USA. [24] Storn R., Price K. 1997. Differential evolution – a simple and
efficient heuristic for global optimization over continuous spaces, Journal of Global Optimization, 11 (4), pp. 341–359. DOI: 10.1023/A:1008202821328