ISSN: 1992-8645 www.jatit.org E-ISSN: 1817-3195
276
GROUP DECISION MAKERS-BASED MODEL FOR
EVALUATING THE FEASIBILITY OF INFORMATION AND
COMMUNICATIONS TECHNOLOGY PROJECT
(CASE STUDY : LOCAL GOVERNMENT OF MUSI RAWAS)
1WIJANG WIDHIARSO, 2SRI HARTATI, 3RETANTYO WARDOYO
1
Faculty of Information Technology, Multi Data Palembang Bachelor Program, Palembang, Indonesia 2
Dept. of Computer Science and Electronics, Faculty of Mathematics and Natural Sciences, Universitas Gadjah Mada, Yogyakarta, Indonesia
3
Dept. of Computer Science and Electronics, Faculty of Mathematics and Natural Sciences, Universitas Gadjah Mada, Yogyakarta, Indonesia
E-mail: [email protected], [email protected], [email protected]
ABSTRACT
Feasibility study of information and communications technology (ICT) project becomes more and more important due to the significant growth of ICT project investment as well as its complexity analysis, especially in term of benefit estimation. Recently, Advanced Information Economic (AIE) has been proposed for evaluating the ICT project feasibility, which considers the benefit and cost analysis. In spite of its easiness, AIE remains weakness relating to the subjectivity factor while determine the expected benefit and risk value. This drawback potentially brings the unreasonable result, such as the extremely high value of Return on Investment (ROI). In addition, AIE has not incorporated the group of decision makers, which is practically considered as the main influence factor of project appraisal.
This paper substantially discusses the new variant of information economic that considers the group decision maker for evaluating feasibility of ICT project, namely Group Decision Making Information Economic (GDM IE). This method also includes the benefit and risk template to enhance the applicability of GDM IE, where the benefit and risk related value is derived from the actual and practical references gathered from the several local governments in South of Sumatera. Further more, three kinds of models are involved in GDM IE for evaluating the benefit and risk value. First method (i.e., model A) selects the benefits and risks value based on the existing value of the template. Second method (i.e., model B), compares the selected reference value (template) with the new benefit value, which is entered by the user. The last method (i.e., model C), the user can directly entered the value of benefit and risk to evaluate the feasibility of ICT project. To investigate its applicability, this paper also utilized GDM IE for evaluating the ICT projects in Musi Rawas District.
Keywords: GDM IE, ICT Project, AIE, Benefits, Risks
1. INTRODUCTION
Feasibility study in the ICT project is basically conducted by comparing the benefit gained and the investment required for implementing the project. However, this feasibility study becomes more and more complex due to its wide range applications, which brings difficulties in term of benefit analysis. Currently, the benefit terms have been extensively defined based on the ICT application, for example it is correlated with competitive advantage, increase in brand knowledge, motivation, profit as well as organizational performance(e.g. [2,5,6]).
Several of methods (e.g., balanced score card, real options, economics value added and information economics) have been proposed to evaluate and measure the feasibility of ICT projects [3,4], which is fundamentally developed based on the financial and non-financial approach or its combinations. Furthermore, the evaluation methods evolved from the system level to the system efficiency, and then to the multi-dimensional evaluation, as considered in the information economic and balanced score card methods [7].
ISSN: 1992-8645 www.jatit.org E-ISSN: 1817-3195
277 (AIE) by developing the business value identification method, and its template for classifying and quantifying the business value of information technology. This template presents a generic identification and classification of tangible, quasi and intangible business value. It has also been grouped into thirteen (i.e., 13) categories with a hundred and ninety-five (i.e., 195) benefits, which are derived from the practical ICT investments in Indonesia. However, the application of AIE still remained several drawbacks such as: (a) the value of benefit, which is previously defined, was not available; (b) the subjectivity factors were unavoidable, which potentially brings the unreasonable result, such as extreme value of Return on Investment (ROI).
This paper then discusses a Group Decision Making Economic Information (GDM IE) method, which is put significant extensions of AIE. Since the decision making process of ICT project practically involves the several of stake holders, the GDM IE thus accommodates the group of decision makers, which is not considered in AIE. Moreover, GDM IE provide benefits template along with its percentage value, where each template has been grouped into thirteen (i.e., 13) categories with a hundred and ninety-five (i.e., 195) benefits. In order to cope with the uncertainty, GDM IE also incorporates three (3) risks references and nine (9)
categories of risk value. To measure its applicability, these references and values are derived from and applied in the ICT project evaluation of Musi Rawas District, Musi Banyu Asin District, Pagar Alam City and Sumatera Selatan Province.
Furthermore, GDM IE is also equipped by three methods for evaluating the benefits and risks of ICT project. First method (i.e., model A) selects the benefits and risks value based on the existing value of the template. Second method (i.e., model B), compares the selected reference value (template) with the new benefit value, which is entered by the user. The last method (i.e., model C), the user can directly entered the value of benefit and risk to evaluate the feasibility of ICT project.
2. GROUP DECISION MAKING
INFORMATION ECONOMICS (GDM IE)
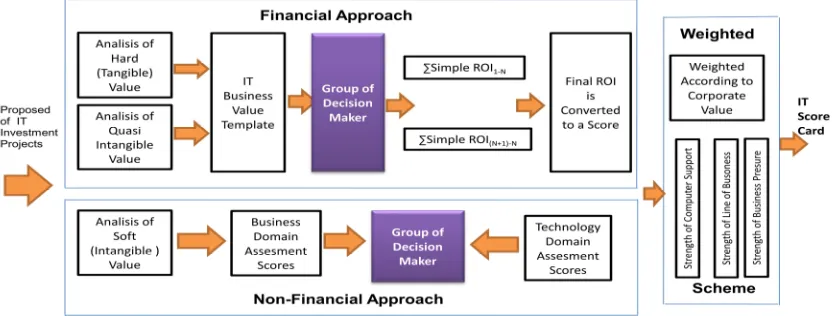
[image:2.612.96.514.448.606.2]In order to evaluate the feasibility of ICT investment, GDM IE considers three basics parameters, namely benefits, risks and costs, which are practically examined by local government in term of ICT investment project. In addition, three steps approach is proposed to figure out those parameters, namely financial approach, non-financial approach and weighted approach, which involves the group of decision makers (see Figure 1)
Figure 1: GDM IE Method A financial step is derived from AIE
method [7] that takes into account the cost-benefit analysis as well as the template of IT business value. By implementing the Value Linking (VL) analysis, the Value Acceleration (VA) analysis, the Value Restructuring (VR) analysis, and the Innovation Valuation (IV) analysis, the ROI value of ICT project can simply be obtained. The further step relates to non-financial approach that
essentially assesses the business domain and technology domain of ICT projects.
ISSN: 1992-8645 www.jatit.org E-ISSN: 1817-3195
278 Uncertainty), TU (Technical Uncertainty) and IR (Information System of Infrastructure Risk). The incorporation of group of decision makers, which practically applied in the evaluation of ICT project, is potentially minimized the subjectivity factor as well as eliminated the evaluation bias [8].
Before implementing the GDM IE, two initial parameters should be handled, which are the benefits reference value in the IT business value templates and the risks reference value on the business and technology assessment domain. The initial benefit value is deducted from the interview survey of stake holders, in which the respondents is selected based on their responsible to the evaluation of budget and work plan. For instance, 30 selected respondents come from the Regional Development Planning Agency that mainly responsible to the project and planning evaluation.
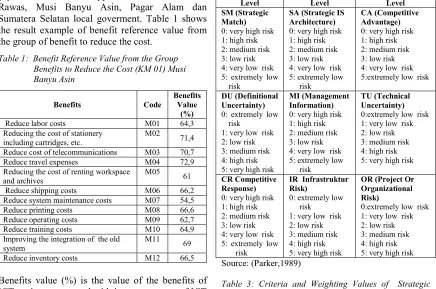
[image:3.612.92.528.369.658.2]Respondents then filled the percentage value of each benefit (i.e., 0% - 100%) to estimate the percentage benefit obtained compared to the investment cost for implementing the ICT project [1]. This estimation is applied to the case of Musi Rawas, Musi Banyu Asin, Pagar Alam dan Sumatera Selatan local goverment. Table 1 shows the result example of benefit reference value from the group of benefit to reduce the cost.
Table 1: Benefit Reference Value from the Group Benefits to Reduce the Cost (KM 01) Musi Banyu Asin
Benefits Code
Benefits Value
(%)
Reduce labor costs M01 64,3
Reducing the cost of stationery including cartridges, etc.
M02
71,4
Reduce cost of telecommunications M03 70,7
Reduce travel expenses M04 72,9
Reducing the cost of renting workspace and archives
M05 61
Reduce shipping costs M06 66,2
Reduce system maintenance costs M07 54,5
Reduce printing costs M08 66,6
Reduce operating costs M09 62,7
Reduce training costs M10 64,9
Improving the integration of the old system
M11 69
Reduce inventory costs M12 66,5
Benefits value (%) is the value of the benefits of ICT projects compared with investment cost of ICT projects . Benefits value (%) obtained from the research that has been done before. Suppose benefits M1 was 64.3 % , and the investment cost of ICT projects Rp.100.000.000 then the value of the benefits of M1 is 64.3 % x Rp.100.000.000 = Rp.64.300.000.
The similar approach is utilised for estimating the risk reference value. The risk value is filled in the range 0 to 5 for nine different risks reference, where the different characteristics of region are carefully taken into account. The interview result is used to estimate the average risk value by dividing the total value of each risk category with the total respondents. The average value ofeach risk is then divided into six different levels, namely, very high risk, high risk, medium risk, low risk, very low risk and extremely low risk. The very high risk level describes the maximum possible risk, which will potentially be experienced if the project is implemented. On contrary, the extremely low risk level shows the lowest risk or the highest success rate in terms of implementation of ICT projects. To determine the highest risk of ICT investment projects, all the results assessment is summing up, including the nine categories of risk. The range and level of risk can be seen in Table 2.
Table 2: The range and Level of Risk
Catagories and Level Catagories and Level Catagories and Level SM (Strategic Match) 0: very high risk 1: high risk 2: medium risk 3: low risk 4: very low risk 5: extremely low
risk
SA (Strategic IS Architecture) 0: very high risk 1: high risk 2: medium risk 3: low risk 4: very low risk 5: extremely low
risk
CA (Competitive Advantage) 0: very high risk 1: high risk 2: medium risk 3: low risk 4: very low risk 5:extremely low risk
DU (Definitional Uncertainty) 0: extremely low
risk
1: very low risk 2: low risk 3: medium risk 4: high risk 5: very high risk
MI (Management Information) 0: very high risk 1: high risk 2: medium risk 3: low risk 4: very low risk 5: extremely low
risk
TU (Technical Uncertainty) 0:extremely low risk 1: very low risk 2: low risk 3: medium risk 4: high risk 5: very high risk
CR Competitive Response) 0: very high risk 1: high risk 2: medium risk 3: low risk 4: very low risk 5: extremely low
risk
IR Infrastruktur Risk)
0: extremely low risk
1: very low risk 2: low risk 3: medium risk 4: high risk 5: very high risk
OR (Project Or Organizational Risk)
0:extremely low risk 1: very low risk 2: low risk 3: medium risk 4: high risk 5: very high risk
Source: (Parker,1989)
Table 3: Criteria and Weighting Values of Strategic Match (SM)
Weight (W)
Criteria (C)
0 The project has NO direct or indirect relationships
to the achievement of stated corporate (or departemental) strategic goals.
1 The project has no direct or indirect relationships to
ISSN: 1992-8645 www.jatit.org E-ISSN: 1817-3195
279
efficiencies.
2 The project has no direct or indirect relationships to
such goals, but the project is prerequisite system (precursor) to another system that achieves a portion of corporate strategic goal.
3 The project has no direct or indirect relationships to
such goals, but the project is prerequisite system (precursor) to another system that achieves of corporate strategic goal.
4 The project has directly achieves a portion of a
stated corporate strategic goal.
5 The project has directly achieves a stated corporate
strategic goal.
Table 4: The Entire Value Recapitulation Musi Rawas Group of Risk
SM CA MI CR OR SA DU TU IR
Business Domain Technology Domain
1,2 0
1,0 0
2,6 0
3,3 0
0,5 0
2,9 0
2,7 0
1,7 3
2,4 0
As it has been mentioned before, GDM IE provides three methods (i.e., model A, B and C) for evaluating the benefit and risk of ICT project, where all kinds of model are implemented in the case of Musi Rawas, Musi Banyu Asin, Pagar Alam and South Sumatra local government. More over, the t-test is invoked to test the value which is entered by user. The Hypothesis is stated that the reference value is better than new value entered by user (i.e., Ho); and on contrary the new value inputted better than the reference value (i.e., Ha). For example, the user selects benefits reference of Musi Rawas local government, and then include four new values (n = 4), namely, M1 = 45; M4 = 50; M5 = 30; M14 = 23. Average value of benefits reference is then estimated as M1 = 50; M4 = 45; M5 = 70; M14 = 40. By considering the correlation value (TK) and the t-test value (T) thatis equal to 0.374, -0.13053301, respectively, it is can be concluded that the hypothesis Ho is fulfilled (i.e., (T) < (TK)). Hence, the value of the reference benefits is used.
3. RESULTS AND DISCUSSIONS
To investigate the applicability of proposed model, the method is applied to the actual work plan and budget system of Musi Rawas local government in 2015/2016 fiscal year. Benefit reference values is gained from the Musi Rawas template, where the model A is used as the evaluation method. Four ICT projects that are used as case study can be summarised as follow:
1. Development of Settlement Information System (Project A)
Handled by the Department of Population and Civil Registration with a budget ceiling Rp.200.000.00 including tax and the operation and maintenance cost for one year of Rp. 20.000.000.
2. Procurement for ICT Equipment (Project B) Handled by Regional Planning Agency with a budget ceiling Rp. 350.000.000 including tax and auction cost, and the operation and maintenance cost for one year of Rp. 35.000.000.
3. Development of Instructor Information Systems (Project C)
Handled by Agri culture and Live stock Agency with a budget ceiling Rp. 45.000.000 including tax and the operation and
maintenance cost for one year of Rp. 4.500.000.
4. Development of Rural Internet (Project D) Handled by Department of Transportation and Information with a budget ceiling Rp. 250.000.000 including tax and the operation and maintenance cost for one year of Rp. 25.000.000.
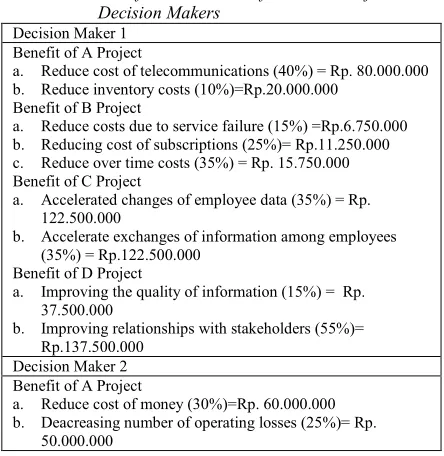
In this case, five decision makers (DM) acts as evaluator of 4 projects above, such as regional secretaries, assistant in charge of the project investment, chair of agency who proposed the project, the Department of Revenue Finance and Asset Management (DPPKAD) and Chair of Musi Rawas District. By utilising Model A and benefit reference of Musi Rawas, the benefit value and its percentage can simply be summarised as follow:
Table 5: Benefits and Value for each Project and Decision Makers
Decision Maker 1 Benefit of A Project
a. Reduce cost of telecommunications (40%) = Rp. 80.000.000
b. Reduce inventory costs (10%)=Rp.20.000.000
Benefit of B Project
a. Reduce costs due to service failure (15%) =Rp.6.750.000
b. Reducing cost of subscriptions (25%)= Rp.11.250.000
c. Reduce over time costs (35%) = Rp. 15.750.000
Benefit of C Project
a. Accelerated changes of employee data (35%) = Rp.
122.500.000
b. Accelerate exchanges of information among employees
(35%) = Rp.122.500.000 Benefit of D Project
a. Improving the quality of information (15%) = Rp.
37.500.000
b. Improving relationships with stakeholders (55%)=
Rp.137.500.000 Decision Maker 2 Benefit of A Project
a. Reduce cost of money (30%)=Rp. 60.000.000
b. Deacreasing number of operating losses (25%)= Rp.
[image:4.612.307.529.506.734.2]ISSN: 1992-8645 www.jatit.org E-ISSN: 1817-3195
280
Benefit of B Project
a. Speeding up the process of consolidation of financial
statements (15%)= Rp. 6.750.000
b. Speed up the transaction process (20%)=Rp. 9.000.000
c. Reducing leakage state budget (15%)= Rp. 6.750.000
Benefit of C Project
a. Reducing leakage state budget (35%)= 122.500.000
Benefit of D Project
a. Saving time (55%) = Rp. 137.500.000
Decision Maker 3 Benefit of A Project
a. Reduce cost of money (10%)=Rp. 20.000.000
b. Increasing productivity of performance (55%)= Rp.
40.000.000
c. Increasing productivity of performance (5%)= Rp.
10.000.000 Benefit of B Project
a. Accelerate the decision-making process (10%)= Rp.
4.500.000
b. Speeding up the process of consolidation of financial
statements (23%)=Rp. 10.350.000 Benefit of C Project
a. Accelerate the decision-making process (40%)= Rp.
140.000.000
b. Improving accuracy of data and information (25%)=Rp.
87.500.000
c. Improving quality of information (20%)= Rp. 70.000.000
Benefit of D Project
a. Improving accuracy of data and information (60%)= Rp.
150.000.000
b. Improving relationships with stake holders (51%)= Rp.
127.500.000 Decision Maker 4 Benefit of A Project
a. Reduce the cost of telecommunications (15%)=Rp.
30.000.000
b. Improving the efficiency of reporting documents (20%)=
Rp. 110.000.000 Benefit of B Project
a. Reducing leakage state budget (40%)= Rp.18.000.000
Benefit of C Project
a. Reducing leakage state budget (3%)=Rp. 10.500.000
b. Improving quality of information (25%)=Rp. 87.500.000
Benefit of D Project
a. Improving quality of information (30%)= Rp. 75.000.000
b. Improving accuracy of data and information (20%)= Rp.
50.000.000 Decision Maker 5 Benefit of A Project
a. Avoiding the risk of loss and delay costs (5%)= Rp.
10.000.000
b. Avoid losses (15%)= Rp. 30.000.000
Benefit of B Project
a. Assist to improve and enhance the work ethic (15%)= Rp.
6.750.000
b. Improving quality of information (45%)=Rp. 20.250.000
Benefit of C Project
a. Reducing leakage state budget (20%)= Rp. 122.500.000
Benefit of A Project
a. Saving Time (35%)=Rp. 87.500.000
b. Improving accuracy of data and information (20%)= Rp.
50.000.000
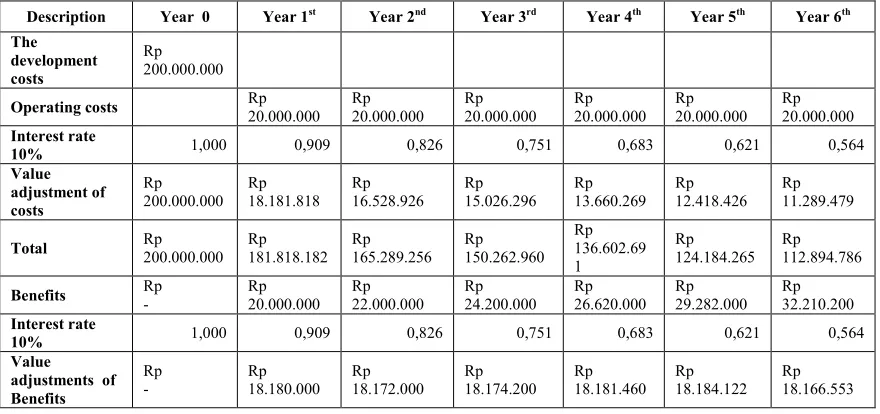
[image:5.612.90.530.522.729.2]Furthermore, 4 steps analysis (i.e., value acceleration, value linking, value restructuring and innovation valuation) is applied for evaluating the project cost and benefit. Value acceleration analysis employs the benefit reference value of Musi Rawas as the basis process to evaluate the project benefits. The evaluation process is carried out by DM for each project (i.e., A, B, C and D). Each DM will assess the entire evaluated project. Table 6 shows the example of project evaluation by assuming 10% interest rate.
Tabel 6: Value Acceleration Evaluation by DM 5 for A Project
Description Year 0 Year 1st Year 2nd Year 3rd Year 4th Year 5th Year 6th
The development costs
Rp
200.000.000
Operating costs Rp
20.000.000
Rp 20.000.000
Rp 20.000.000
Rp 20.000.000
Rp 20.000.000
Rp 20.000.000 Interest rate
10% 1,000 0,909 0,826 0,751 0,683 0,621 0,564
Value adjustment of costs
Rp 200.000.000
Rp 18.181.818
Rp 16.528.926
Rp 15.026.296
Rp 13.660.269
Rp 12.418.426
Rp 11.289.479
Total Rp 200.000.000 Rp 181.818.182 Rp 165.289.256 Rp 150.262.960 Rp 136.602.69 1
Rp 124.184.265
Rp 112.894.786
Benefits Rp -
Rp 20.000.000
Rp 22.000.000
Rp 24.200.000
Rp 26.620.000
Rp 29.282.000
Rp 32.210.200 Interest rate
10% 1,000 0,909 0,826 0,751 0,683 0,621 0,564
Value adjustments of Benefits
Rp -
Rp 18.180.000
Rp 18.172.000
Rp 18.174.200
Rp 18.181.460
Rp 18.184.122
ISSN: 1992-8645 www.jatit.org E-ISSN: 1817-3195
281
Total benefits Rp - Rp 18.180.000 Rp 36.352.000 Rp 54.526.200 Rp 72.707.660 Rp 90.891.782 Rp 109.058.335 Net Present Value Rp 200.000.000 Rp 199.998.182 Rp 201.641.256 Rp 204.789.160 Rp 209.310.35 1 Rp 215.076.047 Rp 221.953.121
As can be inferred from Table 6, in the 2nd year, positive value of benefits has been obtained, since the total benefit value is more than the implementation costs. The amount of benefit is estimated equal to Rp. 1.641.256, which is difference between the development costs and benefit value (see detail estimation below). The
summary of evaluation result conducts by all DM for project A can be seen in Table 7.
= Development cost – Total benefit
= Rp. 200.000.000 – Rp. 201.641.256
[image:6.612.89.532.71.141.2]= Rp. 1.641.256
Table 7: Summary of Benefits Value Acceleration For The Entire Decision Maker For A Project
Decision
Maker Year 0 Year 1
st Year 2nd Year 3rd Year 4th Year 5th Year 6th
DM 1 Rp 200.000.000 Rp 227.268.182 Rp 256.169.256 Rp 286.578.460 Rp 318.371.841 Rp 351.413.720 Rp 385.540.623 DM 2 Rp 200.000.000 Rp 231.813.182 Rp 265.257.256 Rp 300.210.010 Rp 336.548.756 Rp 374.136.665 Rp 412.805.207 DM 3 Rp 200.000.000 Rp 213.633.182 Rp 228.905.256 Rp 245.683.810 Rp 263.841.096 Rp 283.244.883 Rp 303.746.872 DM 4 Rp 200.000.000 Rp 245.448.182 Rp 292.521.256 Rp 341.104.660 Rp 391.079.501 Rp 442.305.502 Rp 494.598.958 DM 5 Rp 200.000.000 Rp 199.998.182 Rp 201.641.256 Rp 204.789.160 Rp 209.310.351 Rp 215.076.047 Rp 221.953.121
From table above it also implies that DM4 has the highest value for the evaluation of project A with the total benefits value for six year is equal Rp. 2,407,058,059. The similar process conducts for evaluating value acceleration of projects B, C, and D. The results will then be summarized to determine the total value of benefits value acceleration until the 5th year project.
By implementing similar process, the benefit of value linking, value restructuring and innovation valuation can simply be estimated, where the final output value is governed by the ROI value. This value demonstrates the feasibility of investment ICT projects. The higher ROI value means the higher feasibility of ICT project, where the definition of feasibility level in ICT projects illustrated in Table 8.
Table 8: Project Feasibility Level of Project ICT Investment
Impact ROI
Feasibility is extremely low < 0
Feasibility is very Low 1% to 299%
Feasibility is Low 300 to 499%
Feasibility is Medium 500% to 699%
Feasibility is High 700% to 899%
Feasibility is very high >900%
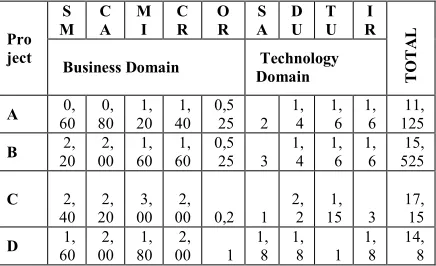
[image:6.612.93.551.254.371.2]Risk evaluation of each project will be conducted by five DMs, where the DM possible to choose the different evaluation method for each project. The result from all DM is then accumulated to evaluate the risk level of each project, in which Project C has the highest risk level than others.
Table 9: Risk Evaluation Results Whole Project By The Entire Decision Maker
Pro ject S M C A M I C R O R S A D U T U I R T O T A L Business Domain Technology Domain
A 0,
60 0, 80 1, 20 1, 40 0,5
25 2
1, 4 1, 6 1, 6 11, 125
B 20 2, 00 2, 60 1, 60 1, 0,525 3 1,4 1,6 1,6 525 15,
C 2,
40 2, 20 3, 00 2,
00 0,2 1
2, 2
1,
15 3
17, 15
D 1,
60 2, 00 1, 80 2,
00 1
1, 8
1,
8 1
1, 8
14, 8
[image:6.612.310.528.520.653.2]ISSN: 1992-8645 www.jatit.org E-ISSN: 1817-3195
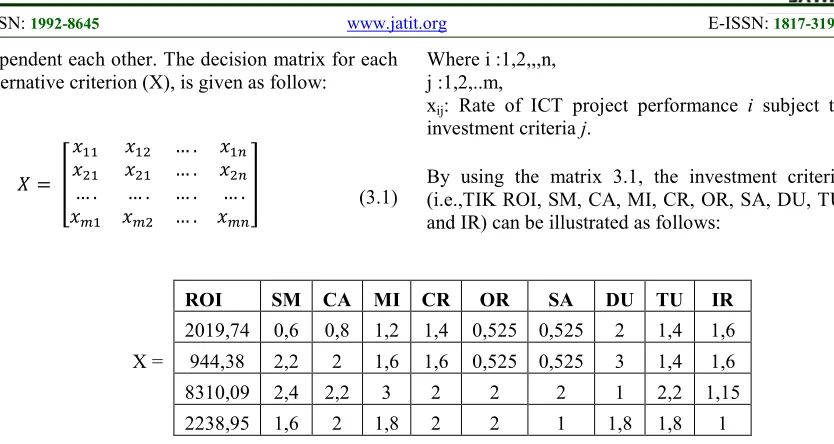
282 dependent each other. The decision matrix for each alternative criterion (X), is given as follow:
… . … .
… . … . … . … .
… . (3.1)
Where i :1,2,,,n, j :1,2,..m,
xij: Rate of ICT project performance i subject to investment criteria j.
By using the matrix 3.1, the investment criteria (i.e.,TIK ROI, SM, CA, MI, CR, OR, SA, DU, TU and IR) can be illustrated as follows:
X =
ROI SM CA MI CR OR SA DU TU IR
2019,74 0,6 0,8 1,2 1,4 0,525 0,525 2 1,4 1,6
944,38 2,2 2 1,6 1,6 0,525 0,525 3 1,4 1,6
8310,09 2,4 2,2 3 2 2 2 1 2,2 1,15
2238,95 1,6 2 1,8 2 2 1 1,8 1,8 1
Normalization step is firstly conducted by determining the highest value of each project on each criterion. Data normalization value of each project (i = 1,2, .., m) to the criterion (j = 1,2, .., n) is given by Equation 3.2.
where:
= investment value of project I subject to investment criteria j that has not been normalized.
= maximum investment value of project i subject to investment criteria j that has not been normalized.
= investment value of project I subject to investment criteria j that has not been normalized
(3.2)
The normalized value is then summed using equation below:
Dj is total value of investment project that has been normalized for each criteria, where the result can be seen as follow:
[image:7.612.100.517.70.292.2](3.3)
Table 10: Results of Data Summation Already Normalized
Project Xmax D
A 2019,7 2030
B 944,38 958,8
C 8310,1 8328
D 2239 2254
Entropy calculation for each criterion of ICT investment projects j is firstly applied j to calculate the value of emax, and K using Equations 3.4 and 3.5.
emax =ln m;
m: total number of ICT projects
(3.4)
1
(3.5)
By implementing above equations,
K value can be estimated as 0,721348.
Equation 3.4 is utilised for estimating the entropy calculation for each criterion of ICT project j
ln
where :
e(dj) = entropy value of criteria j for project i.
investment value of ICT project that has been normalized Dj = total investment value of ICT
project that has been normalized for each investment criteria
(3.6)
ISSN: 1992-8645 www.jatit.org E-ISSN: 1817-3195
283
! " # (3.7)
After the estimation of total entropy, the weight of each criterion is then conducted. By using equations 3.8 and 3.9, it is obtained the results as follows: λ1 = 0.249975; λ2 =0.250619; λ3 = 0.249489; λ4 =0.249917.
λ $
% &'() '* +,
-Where j= 1,2,..n
(3.8)
λ$% &
%
.1 (3.9)
λ
/% λ$,∗ 1,
∑3,45λ$,∗1, (3.10)
Where j= 1,2,..n,
n= total number of projects
λj= final weight value of entropy
w = initial weight value
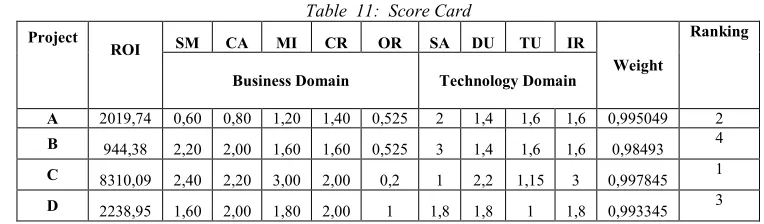
[image:8.612.112.494.400.512.2]The final entropy value is calculated by applying Equation 3.10, and thus the result can be summarised as follow: ProjectA(λ1)= 0.995049; Project B (λ2)= 0.98493; Project C(λ3)= 0.997845and Project D (λ4)= 0.993345. Table 11 show the result that is illustrated using score card, where project C is highly recommended to be implemented based on benefit, and risk analysis. Project C has a feasibility high ROI, risk level of SM is a low risk, CA is a medium risk, MI is a low risk, CR is a medium risk, OR is extremely low risk, SA is a high risk, DU is a low risk, TU is a very low risk and risk level of IR is a medium risk.
Table 11: Score Card
Project
ROI SM CA MI CR OR SA DU TU IR
Weight
Ranking
Business Domain Technology Domain
A 2019,74 0,60 0,80 1,20 1,40 0,525 2 1,4 1,6 1,6 0,995049 2
B 944,38 2,20 2,00 1,60 1,60 0,525 3 1,4 1,6 1,6 0,98493 4
C 8310,09 2,40 2,20 3,00 2,00 0,2 1 2,2 1,15 3 0,997845 1
D 2238,95 1,60 2,00 1,80 2,00 1 1,8 1,8 1 1,8 0,993345 3
4. CONCLUSION:
This paper discussed the method relating to the feasibility study of ICT project, and specifically proposed a new variant of information economic, named as GDM IE. This proposed method includes the group of decision makers, which is practically considered as the main influence factor of project appraisal. As different with previous IE method, GDM IE also incorporates three different method for evaluating the project that combines the experience, method and preference of decision maker. The method is then applied to the actual ICT projects, which can effectively evaluate the feasibility of ICT projects.
REFERENCES:
[1] Asghar, S., Fong, S., & Rukhsana, “A contemplation of group decision support systems’, ICCIT 2009 - 4th International Conference on Computer Sciences and Convergence Information Technology, 2009, pp. 647–652.
[2] Copertari, L, “Selecting projects in a portfolio using risk and ranking”. Journal of Project, Program & Portfolio Management, 2011, pp. 10–28.
[3] Friedman, M., "Essays in Positive Economics", University of Chicago Press, II (1953), 1970, pp. 3–35.
ISSN: 1992-8645 www.jatit.org E-ISSN: 1817-3195
284 investment, in Measuring information technology investment payoff: contemporary approaches", IGI Publishing,1999.
[5] Kohli, S. D. and R., "The IT Payoff – Measuring the Business Value of Information Technology Investments". Prentice hall, 2002.
[6] Mayor, T., “A Buyer’s Guide to IT Value Methodologies.” CIO Magazine. 2002. [7] Moaven, S., Ahmadi, H., Habibi, J., &
Kamandi, A., "A decision support system for software architecture-style selection", Proceedings - 6th ACIS International Conference on Software Engineering Research, Management and Applications, SERA 2008, pp. 213–220.
[8] Murphy, K., & Simon, S.," Using Cost Benefit Analysis for Enterprise Resource Planning Project Evaluation: A Case for Including Intangibles", 34th Annual Hawaii International Conference on System Sciences, 2001, pp. 8018–8029.
[9] Parker, M.,Washington U., & Benson, R. "Information Economics", 1989, pp. 1–15. [10] Ranti, B., “Identification of Information