INFORMATION TECHNOLOGY PRODUCTIVITY
PARADOX: A RESOURCE-BASED VIEW AND
INFORMATION TECHNOLOGY STRATEGIC ALIGNMENT
PERSPECTIVE FOR MEASURING INFORMATION
TECHNOLOGY CONTRIBUTION ON PERFORMANCE
1,2
APOL PRIBADI SUBRIADI, 2DJUMILAH HADIWIDJOJO, 2DJUMAHIR,
2MINTARTI RAHAYU, 3RIYANARTO SARNO
1Department of Information System, Sepuluh Nopember Institute of Technology (ITS), Indonesia 2Department of Management and Business, Brawijaya University (UB), Indonesia 3Department of Informatics, Sepuluh Nopember Institute of Technology (ITS), Indonesia
Corresponding E-mail: [email protected]
ABSTRACT
This paper seek clarity IT Productivity Paradox with measuring real Information Technology (IT) contribution on Performance. Two Measurement concept proposed are Direct and Indirect measurement. Concept of direct measurements was based on principle of Cobb-Douglas Production Function, which Performance was expected linear with IT resources. Indirect measurements concept was based on Resource-based View theory. IT Strategic Alignment rules were adopted in effort to align IT goals with business goals through IT-based Capability and IT Support for Core Competence.
Originality and study findings were (i) to perform a comparison between a direct effect of IT Resources usage on Performance and indirect effect of IT Resources usage on Performance (ii) able to demonstrate the potential benefits loss of IT in company business process steps, (iii) proposed model was able to explain IT contribution that more transparent on Performance achievement, (iv) comparison results of research object showed that direct effect has a higher value than indirect effect.
Keywords: IT Resources, Resource-Based View, IT Strategic Alignment, IT Productivity Paradox,
Performance
1. INTRODUCTION
Advancement of Information Technology (IT) creates competition. Many companies invest heavily in IT field. As an illustration, in 2000, nearly 50% of U.S. business investment was invested in IT (Strassman, 2002; Woodal, 2000). Indonesia's IT expenditure in 2011 according with International Data Corporation (IDC), was U.S. $ 10.9 billion, and then increased to U.S. $ 15 billion in 2012. This was the largest IT expenditure in Southeast Asia. This increase was fantastic, since in 2001 corporate IT expenditure in Indonesia was only U.S. $ 858 million.
Unfortunately, investment growth in IT was not consistent with worker productivity levels. Labor’s productivity in United States that using IT, between 1979 and 1998, declined from an average of 3.4% to 1.2% per year. This raises question: "Have computers helped us make that sort of
productivity improvement?" (Siegel, 1998). In Japan, Harada (2005) closes his research conclusions with uncertainty. Effect of IT investment on Japan economy cannot be identified and proved conclusively. Solow (1987) said "We see the computer age everywhere except in the
productivity statistics", it become start the
emergence of Information Technology Paradox, Brynjolfsson (1988).
(Customer Relationship Management) failed to achieve goal. Meta Group says 55% -75% of CRM projects failed. CRM Forum reported 50% of CRM projects in the U.S., and more than 85% in Europe failed. Indonesian Computer Business Association (ICBA) reported the successful IT projects in Indonesia was much smaller than failed or wasted (idle) project. ICBA estimates only 20% of IT investments achieve target and used optimally.
IT Productivity Paradox Research basically divided into two periods, namely: first period (1980 - 1990) and second period (1990 - present). In first period, most research states there was no relationship between IT investment and Performance. Brynjolfsson (1995) suggest a negative effect of IT investment on company’s Performance. Roach (1987) compares productivity of IT workers and production workers. The results obtained surprisingly, between the 1970s-1980s, production workers productivity increased 16.9%, bigger than IT workers who supported by massive IT investment, their productivity only 6.9%. Roach finds that IT actually has a negative effect on worker productivity. Strassman (1990 and 1997) did not get any evidence relation of IT investments - profitability, or IT - productivity. Very interesting hypothesis was expression of Brynjolfsson (1994) after reviewing relevant literatures. He expressed four circumstances that led to IT productivity paradox situation, namely: (i) mismeasurement of inputs and outputs, (ii) mismanagement of IT, (iii) redistribution of IT benefits, and (iv) lag of learning, adjustment and restructuring.
In second period (1990-present), Brynjolfsson, et al. (1996), Lichtenberg (1995) analyzed a data set of IT expenditure by large companies in America, using Cobb Douglass Production Function. They found contribution of IT capital and IT staff expenditure on company output was not only positive and statistically significant, but it was even greater than the contribution made by non-IT capital and non-IT staff expenditure. Gurbaxani, et al. (1998) uses data from 400 companies from Fortune 1000 between 1987 and 1994, examining investment return of IT equipments and found a positive relation between IT investments and company output.
New IT Productivity Paradox, an updated fact, showed a positive correlation of IT usage on Performance, but Performance improvement resulted was not proportional to percentage increase of IT expenditure. Ho and Mallick (2006) proved in banking industry that full of IT usage and adoption (High IT Intensity Industry). IT had lower rates of
return on U.S. banks. These evidences were facts "the big lie of information age" (Schrage, 1997).
These practical and theoretical gaps caused confusion among IT managers (CIOs) in worldwide about IT actual role on Performance. A black box of IT business value that transforms IT resources becomes Performance. This study aimed to disentangle the black box contents to apply measurement model to explain effect of IT resources directly or indirectly on Performance. Conceptual model was based on Resource-based View theory and Strategic IT Alignment.
2. LITERATURE (THEORITICAL) REVIEW
2.1 Cobb Douglass Production Function
Productivity was a simple concept. Productivity was defined as amount of output from number inputs (Brynjolfsson, 1998). Within certain limits, the more input in business process, the greater output. The difficulty was business process output was not only products (goods or services), but covers entire value received by consumer, such as quality, delivery time, comfort, and intangible values. Cobb Douglas Production Function method introduced by Charles Cobb and Paul Douglas in 1900-1947 to measure the relationship between input and output. In Cobb Douglass production function, productivity or output was defined as basic function of labor and capital.
Cobb-Douglass Production Function Theory attracts many researchers. It was widely used to calculate productivity levels, including in information technology area. Dehning and Richardson (2002) formulates Performance as IT function, Performance = F (IT). IT functions based on: (i) amount of money spent on IT, (ii) IT expenditure type was done, (iii) IT assets management. Performance measurement with (i) approach was known as direct measurement, in accordance with principles of Cobb Douglass production function, namely to calculate effect of total IT expenditure, IT training and IT staff expenditures. In the development, type (ii) and (iii) become indirect measurements by taking into account the effect of IT usage on business processes implemented. Dans (2001) measure return on investment (ROI) for every dollar invested in IT by equation of Q = F (K, L, IT; j). Dans defines productivity or output (Q) with input factors of capital (C), labor (L) and IT in specific industries (j).
2.2 Information Technology Strategic Alignment
Company's success in innovation efforts was depends on successfully alignment between business and IT. An alignment will achieved when IT investment plan combined with target prioritization of strategic planning (Luftman, et al. 2005). Strategic IT Alignment concept was intended to integrate IT into business strategy and business processes. "Aligning IT with business means bridging the gap between what technology promises and what it actually delivers" (Sarno, 2009).
Henderson and Venkantraman (1993) stated that IT Strategic Alignment models include business domain (business strategy and business processes) and technology domain (IT strategy and IT processes) within organization. Luftman and Kempaiah (2007) noted three important things about IT alignment namely (i) how to better align IT to business rather than how business aligned to IT, (ii) Alignment was often seen only as a single issue, such as selection of a suitable technology and not as overall as business activity adaptation, (iii) there was no adequate tools to assist alignment process within organization. Chan, et al. (1997), Melville, et al. (2004) reported IT relationship on Performance may be indirect, but it requires a Strategic IT Alignment as a compromise between business Strategic Orientation and IT Strategic Orientation. Strategic IT Alignment would lead to IT Effectiveness and IT Capabilities. Strategic IT Alignment theory was expected to explain IT productivity paradox.
2.3 Resource-Based View of Information Technology
Resource-Based View (RBV) theory was helpful to understand resource companies (including IT resources) to create a competitive advantage. Sustainable competitive advantage was derived from resources and capabilities that driven by company, valuable, rare, inimitable and non substitutable, Barney (1991).
Brynjolfsson (1998) convey black box in company business processes that playing an important role in transforming IT to increase Performance. Relationship between IT and Performance will get most complete theoretical framework through RBV approach. Resource was a bridge toward competitive advantage (Barney, 1991; Wernerfelt, 1984). Position of competitive advantage was temporary, because rapid changes in competition. Companies should strive to maximize all assets owned to become sustained competitive advantage (Porter, 1990).
RBV concept of Grant (1991) describes transformation of resource usage. Strategies at the end of Grant concept can be translated as company's goals or Performance. Grant describes formulation of corporate strategy theory to achieve the objectives: (i) identify and classify resources owned by company, (ii) identify capabilities to make companies can more effective than competitors, (iii) create competitive advantage position to optimize the expected results.
Companies that become a leader in IT usage have superior Performance (Bharadwaj, 2000). Relationship between IT resources and firm Performance can only be determined when calculating real IT usage in company business processes (Devaraj, et al. 2001). Bharadwaj (2000) saw company as a resource package to investigate company’s resource diversity as competitive advantage source and organizational Performance embryo. Finney et al. (2008) recommends to put core competencies as a basis to create a position of competitive advantage. This was because core competence was a combination of (i) companies resource, and (ii) company ability. The uniqueness of this merger will make competitors difficult to imitate, and as differentiator to win competition.
Rivard, et al. (2005) noted that relationship of IT-business Performance can be viewed from two perspectives: (i) look at strategy as a positioning perspective, where IT was used to change competitiveness in related industries, (ii) look at IT as part of organization's resources. Zhang (2007), and Nakata, et al. (2008) suggested that theories of resource-Based View (RBV) able to explore the pervasive effect of IT into organization and explain how internal factors, such as core competencies, can provide a competitive advantage position to improve Performance.
3. CONCEPTUAL FRAMEWORK AND
RESEARCH HYPOTHESES
Conceptual Framework to build a model that can explain contradiction of IT on Performance adopts models of Ravichandran and Lertwongsatien (2005). Strategic IT Alignment approach describes each stage of adjustment goals into IT business goals (Byrd, et al. 2006; Devaraj and Kohli, 2003; Tallon, 2007). This study conceptual framework was to compare direct and indirect effects of IT resources on Performance to create a model.
based on evolution theory of Barney (1991) about SWOT, Grant (1991) about resources usage and capability to make strategy, Torkelli (2001), Ravichandran and Lertwongsatien (2005) and Arslan and Ozturan (2011), which directing relationship between IT resources, capabilities-based IT, IT Support for Core Competence and Performance. IT strategic alignment approach to aligning IT objectives with business objectives were implemented to prepare and to measure IT-based capabilities aspects, and IT Support for Core Competence. IT strategic alignment to align IT goal toward business goal was implemented to make and to measure aspect of ability-based IT and IT Support for Core Competence
Literature review noted that there were differences in research results about direct relationship of IT investments on Performance. Dans (2001), Kraemer and Dendrick (2001), Hu and Quan (2003) stated IT resources has direct and positive effect on Performance. Strassman (1990, 1997), Brynjolfsson (1993), Dos Santos (1993) reported IT did not affect on Performance. While Ho and Mallick (2006), Anderson et al. (2003), Solow (1987), and Brynjolfsson (1995) states IT resources negatively affect on Performance.
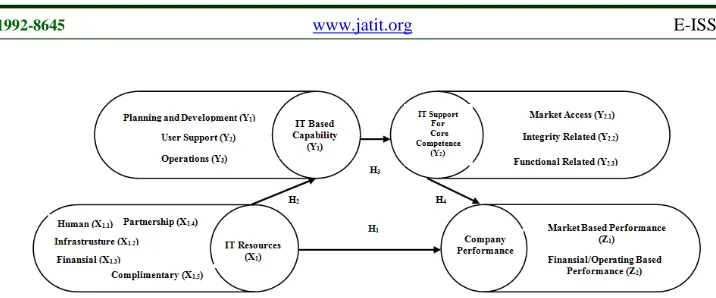
Selection of business resources and IT resources were defined as crucial and unique, because it really depends on its condition and availability in each company. Based on opinion that formulate in resource-based view perspective from Grant (1991), Amit and Schoemaker (1993), Bharadwaj (2000), Ravichandran and Lertwongsatien (2005), Arslan and Ozturan (2011), IT resource defined in this study were : (i) Human Resources (X1.1), (ii) IT Infrastructure resources
(X1.2), (iii) Financial resources (X1,3), (iv) IT
Partnership Quality Resources (X1.4), (v)
Complementary Resources (X1.5).
Performance was a reflection of company's achievements. Performance measurement was an assessment of company success to reach target. Performance in this study was measured by two dimensions: (i) Market based Performance (Z1),
describes company's ability to compete in seizing new markets or maintain market share, (ii) operating Performance (Z2), it was goals fulfillment
which reflects company's economic goal and to describe measurement of profitability, productivity, and company position relative to competitors (Ravichandran and Lertwongsatien, 2000, 2005).
To test direct effect of IT resources on Performance, as well as to confirm the opposite, IT resources do not directly affect on Performance improvement, it proposed hypothesis 1 as follows:
Hypothesis 1: IT Resources directly affect on Performance improvement.
Resources were raw materials to develop company capabilities (Grant, 1991). Resources were converted into final products or company goals through a process or mechanism that involves various other assets within companies such as technology, management or other systems (Amit and Schoemaker, 1993). IT capability was largely determined by company IT resources availability (Bharadwaj, 2000; Ravichandran and Lertwongsatien, 2005). Teece et al. (1997) describe a close relationship among resources and dynamic ability depends on placement and resources usage to develop capabilities. Competence and capability, which together were inherent to create a company competitive advantage position, will be sharpened by position and utilization of resources. Under these conditions, hypothesis 2 was proposed as follows:
Hypothesis 2: IT Resources affect on formation of IT-based capabilities.
Capability was a complex process that efficiently transforms resources into company output (Collish, 1994). IT-based capability was ability to mobilize, translate and combine IT resources with resources and other non-IT firm’s capabilities (Bharadwaj, 2000). IT-based capability was routine job of IT department to give IT services benefit. Capability was more easily observed and taken into account when using a standard that was functionally classifiable in company's activities Grant (1991).
This research leads IT capability based on advice of Feeny and Wilcock (1998), namely aspects of planning and system development (Y1.1),
IT support (Y1.2), and operation of IT (IT
operations – Y1.3). This aspect determination was
based on: (i) functional ability scope should be aligned with company's strategy or objective, and can be identified by functional grouping (Grant, 1991), and (ii) from a strategic perspective, company Performance was more important than IT skills improvement. Indeed, IT upgrades that do not reflect Performance improvement means IT skills functionally do not lead to Performance creation. Therefore, company ability to support core competence capacity with using IT was depend on ability of IT function. Based on description, hypothesis 3 was proposed as follows:
Figure 1 Conceptual Model and Research Hypotheses
Technologies selection that used by companies was a challenging area for management decisions. Difficulties to clarify suitable technology and provide a positive effect on core competencies were comparable with a belief that right technology selection can create a significant competitive advantage position. Prahalad and Hamel (1990) describe competence as a collection of lessons learned to coordinate diverse production capabilities and technologies. Technology selection should provide a support to core competencies. Core competencies identification was crucial to get real support from IT (Torkelli and Tuominem, 2001). Management must be able to identify the true core competencies and develop them.
Company competence was built for a long time and describing position or identity of selected companies based on resources mastery and utilization (Grant, 1991, Barney, 1991). IT integration into core competency creates IT resources that difficult to imitated and creating competitive advantage (Finney, et al. 2008). Although IT resources or IT skills have similarity, a company that directs IT initiatives into core competencies will reap IT assets benefit and greater Performance.
Hamel (1991) categorizes them into three core competencies, namely: market access competencies, integrity-related competencies and functionality related competencies. In order to contribute on Performance, IT must be able to provide capacity of core competencies. This study uses opinion of Ravichandran and Lertwongsatien (2005), and mapping opinion Hamel (1991) to IT support for core competencies, namely: (i) market access (Y2.1), (ii) IT-related integrity (Y2.2), and
(iii) IT related functionality (Y2.3). From the
description, it proposed hypotheses 4 as follows: Hypothesis 4: IT Support for Core Competence
affects on Performance improvement.
Conceptual framework of research model (Figure 1) was proposed by using IT resources, IT-based Capability and IT Support for Core Competence. This theory was developed based on of Resource-based View concept. Furthermore, IT Strategic Alignment concept was adopted in developing measurement indicators as scenarios to measure suitability of IT goals on business goals.
4. RESEARCH METHOD
The main research method was a survey, by taking samples from population and use questionnaires as data collection tool. Likert scale of 1 to 5 was used to measure response of item statement.
4.1 Population and Sample
This study was directed to Small and Medium Enterprise in East Java. Rural Bank (BPR) was chosen as research object. Samples taken from 101 BPR members which was the total number of rural banks headquarters in Gerbangkertasusila region, so the sample was saturated.
4.2 Data Collection and Analysis Techniques
5. ANALYSIS AND RESULT
Linearity relationships assumptions of equation model must fulfilled for GSCA analysis. Testing linearity with Curve Fit method shows all relationships between latent variables have significance below 5% (p <0.05). It concluded relationship between latent variables in structural model was linear.
Performance variable has two reflective indicators namely Market-Based and Operating based. Loading estimate of based Market (Z1) and
Operating based (Z2) respectively were 0.928 and
0.866 (Table 2), significant and valid for CR (critical ratio) > 1.96. Therefore, both have good convergent validity to describe Performance (Z). AVE (average variance extracted) value of Performance variables was 0.805. Therefore Square root of AVE was 0,897 and greater than entire correlation value of Performance variable toward of other latent variables (Table 1). Two indicators of Performance variable was categorized have good discriminant validity (Solimun, 2012)
IT resource variable has a five formative indicators, namely human resources, infrastructure, financial, quality and partnership support. Weight estimate of infrastructure (X1.2) and complimentary
resources (X1.5) respectively were 0.400 and 0.525.
These were valid and significant for CR > 1.96. Three other resources have insignificant critical ratio (Table 2). Complimentary Resources was most appropriate to describe IT Resource because its estimate value greater than IT Infrastructure resources. Supporting Resources believed to be more influential to shape IT resources
There were three formative indicators that make up IT-based capabilities variable, namely: Planning and Development (Y1.1), User Support
(Y1.2), and Operations (Y1.3). Planning and
Development (Y1.1) and Operations (Y1.3) were
significant with CR > 1.96. Indicators of User Support (Y1.2) were insignificant (Table 2).
Planning and Development (Y1.1) has a highest
value weight estimate of 0.764, with mean of 3.66, so Planning and Development was an indicator that can describe IT-based capabilities rightly. Operations have a weight estimate 0.314, and mean of 4.06 to describe variable perceived IT-based capabilities. User Support indicator with weight estimate of 0.202 was insignificant construct create IT-based capabilities.
IT Support variable has three formative indicators, namely Market Access (Y2.1),
Integrity-related (Y2.2), and Functional-related (Y2.3).
Indicators of Market access and Functional-related have CR > 1.96 and significant. Weight estimate values of Market Access and Functional-related respectively 0.594 and 0.519 with a mean of 3.70 and 3.79. Indicators of Market access (Y2.1) were
an indicator that more describe IT Support because it has greater weight estimate. Estimate weight of Integrity-related (Y2.2) was 0.184 with a critical
[image:6.612.108.507.520.577.2]ratio 0.76, insignificant. Perception of Integrity-related measurements indicates that IT has been not integrated rightly to business process. IT has not given flexibility of business processes or working way. IT presence increases complexity and complexity.
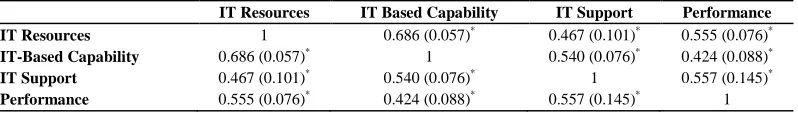
Table 1 Correlation of Latent Variables (SE)
IT Resources IT Based Capability IT Support Performance IT Resources 1 0.686 (0.057)* 0.467 (0.101)* 0.555 (0.076)*
IT-Based Capability 0.686 (0.057)* 1 0.540 (0.076)* 0.424 (0.088)*
IT Support 0.467 (0.101)* 0.540 (0.076)* 1 0.557 (0.145)*
Table 2 Loadings, AVE, and Alpha
Construct/Variable Reflective Indicators Mean Loading AVE Alpha
Est. SE CR
Performance Market Based (Z1) 3.96 0.928 0.029 31.62* 0,805 0.762
Operating/ Financial Based (Z2) 3.85 0.866 0.055 15.85*
Construct/Variabel Formative Indicators Mean Weight AVE Alpha
Est. SE CR
IT Resources (X1) Human Resources (X1.1) 3.96 0.241 0.202 1.2 0 0.596
Infrastructure Resources (X1.2) 3.85 0.400 0.145 2.75*
Financial Resources (X1.3) 3.34 0.184 0.145 1.27
Partnership Resources (X1.4) 3.77 0.097 0.099 0.99
Complimentary Resources (X1.5) 3.98 0.525 0.152 3.45*
IT-Based Capability (Y1) Planning and Development (Y1.1) 3.66 0.764 0.122 6.25* 0 0.589
Users Support (Y1.2) 3.62 0.202 0.145 1.39
Operations (Y1.3) 4.06 0.314 0.137 2.28*
IT Support (Y2) Market Access (Y2.1) 3.70 0.594 0.171 3.48* 0 0.662
Integrated Related (Y2.2) 4.02 0.184 0.240 0.76
[image:7.612.148.470.289.501.2]Functional Related (Y2.3) 3.79 0.519 0.167 3.11*
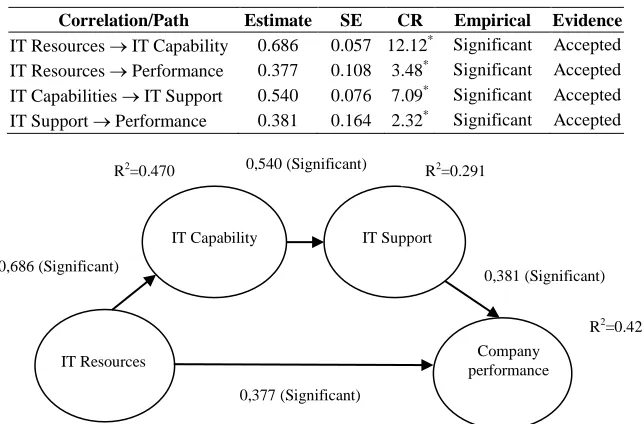
Table 3 Hypothesis Testing Results and Path Coefficients
Correlation/Path Estimate SE CR Empirical Evidence
IT Resources → IT Capability 0.686 0.057 12.12* Significant Accepted IT Resources → Performance 0.377 0.108 3.48* Significant Accepted IT Capabilities → IT Support 0.540 0.076 7.09* Significant Accepted IT Support → Performance 0.381 0.164 2.32* Significant Accepted
Figure 2 Coefficients Path Value of Structural Model
Hypothesis testing was based on path coefficient and critical value (CR), Significant if α = 0.05 level or CR > 1.96. Based on Table 3 and Figure 2, overall correlation was significant. Thus all hypotheses proposed (H1, H2, H3, H4) were
accepted.
6. DISCUSSION
6.1 Effect of IT Resources on IT-Based Capabilities
IT resources have significant effect on IT-based capability (Table 3, Figure 2). These results confirm research result of Grant (1991) that resource was a raw material to develop company ability. Infrastructure resource was most significant to create IT-based capabilities. These data confirm research of Ravichandran and Lertwongsatien
(2005), but inconsistent toward Arslan and Ozturan (2011) findings. Supporting resources also significant so it strengthen Ravichandran and Lertwongsatien (2005), Ravichandran and Rai (2000) and Ross et al. (1996). This result proves result of Teece et al. (1997), or Zhang (2007) that diverse resources available did not automatically create IT-based capabilities can be, but it depends on placement and utilization.
IT-based capability formed will have unique ability that more influenced by Infrastructure and Complementary resources aspects. Complementary resource was a resource that more influential than infrastructure resource. Complementary resource has weight estimate 0,525 with Mean 3.98 were greater than weight estimate and mean of Infrastructure resource. It informs that environment factors which form Complementary
IT Resources
IT Capability IT Support
Company performance 0,377 (Significant)
0,686 (Significant)
0,381 (Significant)
0,540 (Significant) R2=0.291
R2=0.470
resource such as support, commitment and pursuit of company's top management were more dominant. IT-based capability formed will more depend on environment support, especially top management, so it becomes “leaded" than infrastructure aspects such as continuity, smoothness, quantity and quality of infrastructure. Potential IT Productivity Paradox appears if there was mismanagement in placing and developing IT resources that irrelevant. Investment in human, financial and partnership resources can lead to futility, because was not significant.
6.2 Effect of IT-Based Capability on IT Support for Core Competence
IT-based capability significantly affects IT Support for Core Competence (Table 3 and Figure 2). This result proves that IT-based capability was foundation for IT Support to achieve company's core competencies (Grant, 1991; Collish, 1994; Bharadwaj, 2000; Ravichandran and Lertwongsatien, 2005; Arslan and Ozturan, 2011). This result also proves Feeny and Wilcock (1998), company ability to strengthen its core competencies by using IT depends on IT functional ability formed by planning-development systems, IT support, and IT operations.
Planning and development was proved significant to shape IT-based capability toward IT Support. Planning and development was to find out and identify dimensions of synchronization or alignment between priorities of IT business goals and objectives. Perfect planning gives possibility for a harmonious synergy, thereby increasing company's ability to identify business needs and designing strategic solutions and quality that needed to support IT. The better value of planning and development, the better effect of IT-based capability on IT support for corporate competence.
IT Operations was proved significant to establish IT-based capability for IT Support. Indicators describing the state of IT operations continuity of business operations was depend on reliability and efficiency of IT operations. Company depends on smooth operation of IT, where success/failure of IT operational greatly affects the smooth operation of business. The better IT operations IT then the better support provided to achieve corporate competence.
Planning-development has a weight estimate greater than indicator of IT operations. It means that planning and development most influential to establish IT-based capability that was able to provide IT Support for Core Competence.
Planning and development was more crucial to unite IT goals and business objectives.
User Support does not significantly affect IT-based capability on IT Support for core competence. User Support describes company ability to implement IT solutions and ensure the effectiveness of its use based on competencies or business purposes. The better IT skills in timeliness, quality, and cost effective, end user get benefit from IT usage, it will raise IT Support for competence. Insignificance IT Support tells us that research objects perceived IT not useful to user. An indication of IT productivity paradox arises when benefits IT promised have not been used.
6.3 Effect of IT Support for Core Competence on Performance
IT Support for Core Competence has significant effect on Performance (Table 3, Figure 2). Combining IT into core competencies describe IT support toward business processes and it was a IT real contribution on Performance. In turn this process as well as make competitors difficult to imitate precisely because of its distinctiveness because integrating IT capabilities into IT Support for Core Competence was a unique thing (rareness and inimitable).
Market Access proved significant construct to create IT Support for Core Competence. This means that greater flexibility or ease to provide access to markets will maximize Performance achievements. Functional-related was proved significantly creates IT Support for Core Competence. Functional-related can provide convenience, innovation and creativity that flexible and not restricted in delivery, product development and other potential customers. The better the Functional-related support given to IT support for core competency, the more positive effect on Performance. Both weight estimate value for these indicators was almost similar. Both of them have same contribution to achieve Performance.
Improvement on integrity related aspects will improve Performance achievements.
Competitive advantage position actually has been included in all three indicators of IT Support for core competence, namely market access, functional-related and integrity-related. All indicators were supposed to be uniquely implemented in managerial strategy of scarceness where competitors cannot imitate easily. Observations in field indicate that IT was implemented in a way that was almost same for all study objects. Success practice due to IT application support was similar in almost all the research object, through imitation process easiness because IT was not integrated into core competencies. Imitation by itself would eliminate position of sustainable competitive advantage. Success to achieve Performance was obtained to
speeds market entry and ability to provide products or services faster than competitors, could be a temporary, before other companies able to deliver same service or product.
6.4 Effect of Information Technology (IT) Resources on Performance
[image:9.612.87.489.332.401.2]IT resources have significant direct effect on Performance (Table 3, Figure 2). This proving reject dubious research that IT has no effect or even a negative effect on Performance. It explains that every activity to increase IT resources or IT implementation can provide a direct effect on Performance. Every increase in infrastructure and Complementary resources will significantly effect to improve Performance.
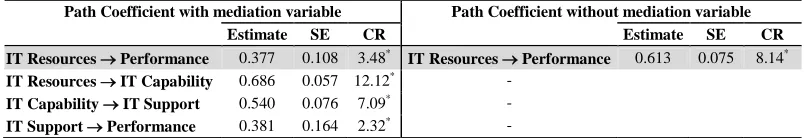
Table 4 Comparison of Path Coefficients
Path Coefficient with mediation variable Path Coefficient without mediation variable
Estimate SE CR Estimate SE CR
IT Resources → Performance 0.377 0.108 3.48*
IT Resources → Performance 0.613 0.075 8.14*
IT Resources → IT Capability 0.686 0.057 12.12* -
IT Capability → IT Support 0.540 0.076 7.09* -
IT Support → Performance 0.381 0.164 2.32* -
IT Business Value, a term to see business value of IT, described by Melville (2004) through resource-based view approach by looking at each stage of IT goals alignment to business goals. This approach was mediation path to examine contribution and transformation of IT benefit value at every fragment of business process. IT-based capability and IT Support for Core Competencies was a black box contents that describing how IT plays an unique role into core competencies. The move was a clear form of IT strategic alignment approach as a IT integration process into business strategies or business processes, (Luftman, et al., 2005, Henderson and Venkantraman, 1993).
According Solimun (2012), analysis to compare direct and indirect effects of IT resources was done by comparing Performance coefficient path between IT resource variables - variables with a Performance involving mediation variables (IT-based capability and IT Support for Core Competence) and without variable mediation. Table 4 shows the path coefficient without mediation variable (0.613), was greater than mediation variable (0.377). Therefore variable IT Capability and IT Support for Core Competence were partial mediation, where the explanation was as follows: a. IT resources directly affect the performance
with path coefficients 0.613. This effect was
stronger if Path Coefficient is close to 1. Thus there was a real potential of 0.397 of IT resources that do not produce Performance. b. IT resources for mediation paths have a path
coefficient of IT resources-Performance (0.377), IT resources - based capability (0.686), IT-based capability - IT Support (0,540) and IT Support - Performance (0.381). Total path coefficient was 0.686 x0.540x0.381 = 0.141. This means IT-based capability and IT Support provide additional reinforcement on Performance achievement of 0.141 and able to explain black box contents of IT Productivity Paradox
Table 4 Potential Value Loss of IT Benefit at Indicators-Variables
Variable Indicator Status
IT Resources Human Insignificant
Financial Insignificant Partnership Insignificant IT-Based Capabilities Users Support Insignificant IT Support for Core
Competence
Integrity Related
Insignificant
7. IMPLICATION AND CONTRIBUTION
Research shows that positive effects of IT resources were directly and indirectly on Performance. Studies have found IT usage did not have negative effect on Performance. IT alignment process through mediation IT-based capability and IT Support for Core Competence has path coefficient smaller than direct effect of IT resources to Performance. Implications for subsequent research was how to improve those insignificant aspects so IT objectives alignment into business objectives make better contribution.
This research makes contribution to enrich RBV theory, especially concept of Barney (1991) and Grant (1991). Research shows IT resources placement and its formulation to right strategy have effect to achieve excellence Performance. Concept of Barney (1991) on aspects of valuable, rareness, inimitable and non-substitutable obtain empirical evidence and this study were sufficient to be able to explain (i) IT paradox occurrence, and (ii) IT actual involvement to achieve Performance . Models were also able to explain Brynjolfsson (1994) allegation on causes of IT paradox, mismeasurement, mismanagement, redistribution of profits, and lags of learning. Explanation at every stage of IT alignment into company business processes able to provide a complete picture to merge IT into business process steps. With this step, failure at a certain stage can be observed and analyzed adequately.
This study provides empirical evidence that IT resources were basis to establish IT-based capabilities. Not all resources owned were significant to shapes IT-based capability desired. It proves Teece et al. (1997) that resource should be placed appropriately in order to develop IT-based capabilities.
Research shows IT-based capability and IT Support for Core Competence was basis of competitive advantage. It was an alignment form of IT goals toward business goals. This research confirm Ravichandran and Lertwongsatien (2005) and Arslan and Ozturan (2011) that IT linkage on
Performance can be explained through based IT capability and IT Support.
This research able answer Grover et al. (1998) which reveals that disagreement causes allegation about research results in IT productivity paradox were incomplete research model that ignores contextual relevant construct. Model incompleteness make contributions of IT (directly or indirectly) on organization were not fully measured.
8. CONCLUSION
IT resources have larger direct effect on Performance than indirect effect. The proposed research model was able to explain content relevance of IT resource on Performance. IT benefit value or IT Business Value that was not visible at direct performance measurement can be explained at each stage of a business process using indirect measurements. IT role can be followed in detail and measured in every stage. The potential contribution of IT irregularities can be seen in more detail. Measurement model development concept which was based on perspective of IT Strategic Alignment and Resource-Based View perspective can provide an adequate explanation about IT Productivity Paradox phenomenon.
9. RESEARCH LIMITATION
Population or sample of this research based on large-area without looking at company size, firm age and intensity level of dependence on IT. These three aspects were based on a literature review that may have contribution to affect IT usage success. Grouping the three aspects of earlier research results will further sharpen research result because respondent perceptions always been closely related to company background represented. The results will more specific when considering all three aspects and it was recommended as future research direction.
REFERENCES
[1] Amit, R., Schoemaker, P.J.H, 1993, Strategic
Assets and Organizational Rent, Strategic
Management Journal (14:1), 1993, pp. 33-46 [2] Anderson, Mark C., Banker, Rajiv D dan
Ravindran Sury, 2003, The New Productivity
Paradox Communication of The ACM),
March 2003/Vol. 46, No. 3
[3] Arslan, Birgul, Ozturan, Meltem, 2011, The Path to Information Technology Business
Value: Case of Turkey, Technology and
[4] Baradwaj, A. S., 2000, A Resource_Based Perspective on Information Technology Capability and Firm Performance: An
Impirical Investigation, MIS Quarterly, 24
(1), 169-196
[5] Barney, J., 1991, Firm Resources and
Sustained Competitive Advantage, Journal of
Management, Vol 17, no. 1
[6] Brynjolfsson, Erick dan Lorin M. Hitt, 1998,
Beyond the Productivity Paradox,
Communication of the ACM (Association for Computing Machinery), August 1998/ Vol 41, no. 8
[7] Brynjolfsson, Erick, 1993, The Productivity Paradox of Information Technology: Review
and Assessment, Communication of ACM,
and Japan Management Research
[8] Brynjolfsson, Erick., Yang, S, 1997, The Intangible Benefits and Cost of Investment:
Evidence from Financial Market, Proceeding
of 18th International Conference on Information System, Atlanta, December 1997 [9] Byrd, T. A., Thrasher, E.H., Lang, T.,
Davidson, N.W., 2006, A Process Oriented Perspective of IS Success: Examining the
Impact of IS on Operational Cost, Omega,
Elsevier, Vol 34, No. 5
[10] Chip.co.id,http://chip.co.id/news/read/2012/0 1/18/1716424/IDC.Prediksi.Cerah.Pertumbuh an.ICT.Indonesia.2012, diakses 1/6/2012 [11] Collish, D. J., 1994, Research Note: How
Valuable Are Organizational Capabilities? , Strategic Management Journal, 15, 8, (1994), 143-152
[12] Dans, Enrique, 2001, IT Investment in Small and Medium Enterprises: Paradoxically
Productive?, Electronic Journal of IS
Evaluation, Vol. 4, n. 1, Mar. 2001
[13] Dehning, Bruce., Vernon J Richardson, 2002,
Return on Investment in Information
Technology: A Research Synthesis, Journal of
Information System, Vol 16, no.1
[14] Devaraj, S., Kohli, R., 2003, Performance Impacts of Information Technology: Is Actual
Usage the Missing Link?, Management
Science © 2003 INFORMS Vol. 49, No. 3, March 2003 pp. 273–289
[15] Dos Santos, Bryan L., Peffer, Ken., Mauer, David C., 1993, The Impact of Information Technology Investment Announcements on the
Market Value of the Firm, Information
Systems Research 4 : 1, |O47-7O47/93/O4OI/0O0l/$O1.25, The Institute of Management Sciences
[16] Feeny, David., Willcocks, Leslie, 1998, Core IS Capabilities for Exploiting Information
Technology, Sloan Management Review, 39.
3 ABI/INFORM Global Page. 9
[17] Finney, R. Zachary., Lueg, Jason E., Campbell, Noel D., 2008, Market pioneers, late movers, and the resource-based view (RBV): A conceptual model, Science Direct,
Journal of Business Research 61 (2008) 925– 932
[18] Grant, Robert. M, 1991, The Resource-Based Theory of Competitive Advantage: Implication for Strategy Formulation,
California Management Review; Spring 1991; 33, 3; ABI/INFORM Global, pg. 114
[19] Grover, V., Teng, J., Segars, Albert H., 1998,
The infuence of information technology diffusion and business process change on perceived productivity: The IS executive's perspective, Information & Management 34 (1998) 141-159
[20] Hajkova, D., Hurnik, J., 2007, Cobb-Douglas Production Function: The Case of a
Converging Economy, Czech Journal of
Economics and Finance, 57, 2007, no. 9-10 [21] Hamel, Gary, 1991, Competition for
Competence and Inter-Partner Learning Within International Strategic Alliances,
Strategic Management Journal; Summer 1991; 12, ABI/INFORM Global, pg. 83 [22] Harada, Tsutomu, 2005, The IT Paradox and
its Economics Impact on Japan, USJP
Occasional Paper 05-04, Program on U.S.-Japan Relations, Harvard University, 61 Kirkland Street, Cambridge, MA 02138-2030 [23] Henderson, John., Venkatraman, N.,1993,
Strategic Alignment Model for Organizational Transformation Via Information Technology, Center for Information System research,
Center for Information Systems Research, Massachusetts Institute of Technology, Sloan School of Management
[24] Hitt, Lorin M; Brynjolfsson, Erick, 1996,
Productivity, Business Profit Ability, and Consumer Surplus: Three Different measures
of Information Technology Value, MIS
Quarterly
[25] Ho, Shirley J., Mallick, Sushanta K., 2006,
The Impact of Information Technology on the Banking Industry: Theory and Empirics,
National Chengchi University, Taiwan [26] Hwang H. & Takane Y. 2004. Generalized
Structured Component Analysis.
[27] Kraemer, Kenneth L., Dedrick, Jason., 2001,
Payoffs From Investment in Information Technology: Lesson From The Asia-Pacific
Region, Center for Research on Information
Technology and Organizations University of California, Irvine
[28] Lichtenberg, Frank R., 1995, The Output Contributions of Computer Equipment and
Personnel: A Firm Level Analysis, Working
Paper No. 4540, National Burau of Economic Research, 1050 Massachusetts Avenue, Cambridge, MA 02138
[29] Loukis, Eurupidis., Sapounas, Ioakim., 2005,
The Impact of Information System Investment and Management on Business Performance in Greece, University of the Aegean, Greece. [30] Luftman, Jerry, 2000, Assessing Business-IT
Alignmnet Maturity, Communication of The
Association for Information System, Volume 4, Article 14, December 2000.
[31] Melville, Nigel., Kraemer, Kenneth L., Gurbaxani, Vijay., 2004, Information Technology and Organizational Performance: An Integrative Model of IT Business Value,
Center for Research on Information Technology and Organizations
[32] Nakata, Cheryl; Zhu, Zhen; Kraimer, Maria L., 2008, The complex contribution of information technology capability to business performance, Journal of Managerial Issues. [33] Powel, Thomas C, Michallef, A. D, 1997,
Information Technology as Competitive Advantage: The Role of Human, Business and
Technology Resources, Strategic Management
Journal, Vol.18, No. 5
[34] Prahalad, C.K, Hamel, Gary, 1990, The Core
Competence of The Corporation, Harvard
Business Review, May-June 1990
[35] Ravichandran, T., Lertwongsatien, 2005,
Effect of Information Systems Resources and Capabilities on Firm Performance: A
Resource-Based Perspective, Journal of
Management Information Systems / Spring
2005, Vol. 21, No. 4, pp. 237-276
[36] Ravichandran, T., Lertwongsatien, C., 2000a,
Strategic Implications of Information Systems, Resources and Capabilities: A
Competence-BasedModel, Association for Information
Systems, AIS Electronic Library (AISeL) [37] Ross, Jeanne. W., Beath, Cynthia M.,
Goodhue, Dale L, 1995, Developing Long Term Competitiveness through Information
Technology Assets, Center for Information
System Research, Sloan School of Management.
[38] Sarno, Riyanarto, 2009, Strategi Sukses Bisnis Dengan Teknologi Informasi, ITS Press, Surabaya
[39] Schrage, M., 1997,. The Relationship Revolution: Understanding the Essence
of the Digital Age. New York: Merrill Lynch
Forum.
[40] Schrage, M., 1997, The Real Problem with
Computers, New York: Merrill Lynch Forum.
[41] Siegel, M., 1998, Do Computers Slow Us
Down? Fortune, March 30 1998,
[42] Sircar, Sumit., Turnbow, Joe L., Bordoloi, Buoy, 2000, A Framework for Assessing the Relationship Between Information Technology Investments and Firm
Performance, Journal of Management
Information Systems, Vol. 16. No. 4, pp. 69-97.
[43] Solimun, 2012, Pemodelan Struktural Generalized Structured Component Analysis
GSCA, Program Studi Statistika, Jurusan
Matematika, FMIPA Universitas Brawijaya. [44] Solow, R, 1987, “We’d better Watch Out”,
New York Times Book Review, July 12, p.36 [45] SWA, Magazine, Potret Kebingungan
Investasi IT, 2003
[46] Strassman, Paul A, 2002, Why ROI ratios are now crucial to IT investment, Strasmann. Inc [47] Tallon, Paul, 2007, Does IT pay to focus? An
analysis of IT business value under single and multi-focused business strategies, Journal of Strategic Information Systems 16 (2007) 278– 300
[48] Teece, D. J., Pisanp, G., Shuen, A., 1997,
Dynamic Capabilities and Strategic
Management, Strategic Management Journal,
18, 7, (1997), 509-533
[49] Weill, P 1992, The relationship between investment in information Technology and Firm Performance: a study of the valve
manufacturing sector, Information Systems
Research, Vol. 3, No. 4, pp. 307-33
[50] Wernerfelt, Birger, 1984, A Resource-based
View of the Firm, Strategic Management
Journal, Vol.5, 171-180 (1984)
[51] Woodal, P, 2000, Solving the paradox: IT is making America’s productivity grow faster at
last, but for how long? The Economist, Vol.
356, no. 8189, pp. S11 S19