Impacts of waveforms on the fluid flow, wall shear stress,
and flow distribution in cerebral aneurysms and the
development of a universal reduced pressure
Noel M. Naughton1, Brian D. Plourde1, John R. Stark1, Simona Hodis2, John P. Abraham1
1
School of Engineering, University of St. Thomas, St. Paul, USA
2
Department of Radiology, Mayo Clinic, Rochester, USA
Ema
Received 6 November 2013; revised 8 December 2013; accepted 25 December 2013
Copyright © 2014 Noel M. Naughton et al. This is an open access article distributed under the Creative Commons Attribution Li-cense, which permits unrestricted use, distribution, and reproduction in any medium, provided the original work is properly cited. In accordance of the Creative Commons Attribution License all Copyrights © 2014 are reserved for SCIRP and the owner of the intel-lectual property Noel M. Naughton et al. All Copyright © 2014 are guarded by law and by SCIRP as a guardian.
ABSTRACT
The hydrodynamics of aneurysm blood flow is thought to be a critical factor in the evolution and potential rupture of blood vessel walls. The ability to predict which aneurysms may grow or rupture has eluded researchers and practicing clinicians. On the other hand, it is expected that local flow patterns, pressures, and wall shear stress play a role in the aneurysm life. In this study, the impact of waveform on these parameters was studied. A baseline wave-form, taken from a patient, was applied to an aneu-rysm geometry. Then the waveform was modified by increasing and decreasing both the flowrates and the cardiac rate. In total, seven cases were investigated. It was found that there were remarkable similarities in the patterns of flow and wall stresses for the cases. These similarities existed throughout the cardiac cycle. It was also found that there was a reduced pressure variable that provides a universal relation-ship that characterizes all of the cases. It was seen that the maximum wall shear occurs at the neck of the aneurysm and scales with the peak systolic veloc-ity. Finally, it is shown that the flow distribution to the multiple outlets does not appreciably depend on the details of the inlet waveform. All cases had a flow distribution that was within 2%.
KEYWORDS
Aneurysm; Hemodynamics; Blood Flow; Computational Fluid Dynamics
1. INTRODUCTION
An aneurysm, which is a weakening in the wall of an
artery that leads to extensive deformation of the flow passage, can be a significant health risk if it ruptures. A major challenge in dealing with aneurysms is that the factors which predict rupture are not well understood. In fact, despite extensive efforts to predict aneurysm rup-ture, there are no accepted techniques that are available to practicing physicians [1]. There are some flow cha-racteristics that have been linked to aneurysms, in partic-ular the local fluid pressure, the wall shear stress, and the oscillatory shear stress, but a comprehensive diagnostic ability remains to be found [2-9].
Past studies of aneurysm blood flow include experi-mental [10] and many numerical studies [11-14] as ex-amples of the wealth of literature. Among the computa-tional studies, some have evaluated very specific com-putational issues such as the treatment of outflow boun-dary conditions [15,16], the treatment of the wall motion [17,18], issues of non-Newtonian blood properties [19- 21] and mesh convergence [22]. The literature listed here is just a small sample of the overwhelming breadth of research performed on blood flows. Over the past few years, the focus has moved toward patient-specific mod-eling with a goal of identifying those features of the flow that are predictive of aneurysm growth and rupture. In addition to the evolution of aneurysms, flow dynamics are important for predicting transport processes which occur within the artery wall [23-27].
has been developed based on an aneurysm geometry that was obtained by medical imaging. The simulation used inputs from seven different waveform types. Descrip-tions of the seven waveforms are listed inTable1. The descriptor “baseline” refers to a 60 Hz waveform ob-tained from medical imaging. The geometry was availa-ble from the Mayo Clinic Aneurysm Database, and de-tailed information from the patient is protected by priva-cy laws. The “fast” and “slow” baseline cases have simi-lar magnitudes of flow compared to the baseline, howev-er, the period is either shortened or lengthened. Finally, the highflow and lowflow cases have flow magnitudes that are 75% or 125% that of the baseline case. Simula-tions were performed and results presented for each of the cases in later portions of this report.
2. MATHEMATICAL AND
GEOMETRIC MODELS
2.1. Boundary Conditions
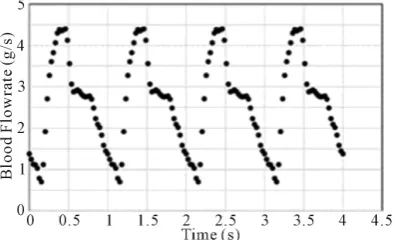
Flow measurements using the methodology of [28] as reported in [29] were used as inlet conditions on the geometry. The inlet flow was actually applied at an up-stream extension of the arterial geometry so that natural flow development could occur at the aneurysm entrance. The baseline waveform is shown for four cycles in Fig-ure1.
Figure 2 has been prepared to show the differences between the seven cases listed in Table1. From the fig-ure, it is seen that the magnitude of the flow and the du-ration of the cycle are varied to represent various cardiac cycles. The durations were increased (decreased) by 25% to create slow (fast) cycles. Similarly, the flowrate throughout the cycle was increased or decreased to create the high and low flows.
At all walls, a no-slip condition was enforced. At the multiple outlets, an area-averaged pressure of 0 was ap-plied and weak conditions were enforced on all trans-ported variables (second derivative = 0).
2.2. Geometry
[image:2.595.326.523.87.207.2]Figure3 shows the geometry of an ophthalmic aneurysm
Table 1.Summary of different waveforms.
Case Flowrate Period (s)
[image:2.595.316.527.94.334.2]1 (Baseline) Baseline 1 2 (Fast Baseline) Baseline 0.75 3 (Fast Lowflow) Low (0.75 × Baseline) 0.75 4 (Highflow) High (1.25 × Baseline) 1 5 (Lowflow) Low (0.75 × Baseline) 1 6 (Slow Baseline) Baseline 1.25 7 (Slow Highflow) High (1.25 × Baseline) 1.25
[image:2.595.310.538.232.389.2]Figure 1.Four cardiac cycles of the baseline wave-form.
Figure 2. Seven waveforms used to simulate various cardiac cycles.
Figure 3. The fluid region in the vicinity of the aneurysm.
[image:2.595.310.539.430.538.2] [image:2.595.56.287.617.737.2]on the upstream geometry, a natural development was determined to be most appropriate. On the other hand, the actual shape of the inlet profile is not likely to signif-icantly impact the flow patterns at the aneurysm because of the tortuous path that the fluid encounters.
As can be seen in Figure 3, there is one inlet plane with a total area of 2.36e-5 m2 and three outlets with areas of 4.84e-6, 6.05e-6, and 3.87e-6 m2, respectively.
2.3. Mathematical Model
The simulations were carried out through the use of commercially available CFD software (CFX 14.0). This software requires the subdivision of the solution domain into a multitude of elements. Equations of conservation of mass and momentum are solved at each computational element. Further details of the geometry and the compu-tational mesh will be provided later in this section.
The simulated flow was laminar because of the very low values of the Reynolds number, even at peak systole (all Reynolds numbers less than 2300). All calculations were unsteady and the simulations spanned four cardiac cycles. From past experience, flow patterns become qua-si-steady by this time [30,31]. The results which are to be presented are taken from the last cardiac cycle. The rele-vant conservation equations are:
0
u v w
x y z
∂ ∂ ∂ + + =
∂ ∂ ∂ (1)
for conservation of mass and
( )
2( )
( )
yx
xx zx
u
u u uw
t x y z
p
x x y z
ρ υ τ τ τ ∂ ∂ ∂ ∂ + + + ∂ ∂ ∂ ∂ ∂ ∂ ∂ ∂ = − + + + ∂ ∂ ∂ ∂ (2)
( )
( )
2( )
xy yy zy
u w
t x y z
p
y x y z
υ
ρ υ υ υ
τ τ τ
∂ + ∂ + ∂ + ∂ ∂ ∂ ∂ ∂ ∂ ∂ ∂ ∂ = − + + + ∂ ∂ ∂ ∂ (3)
( )
( )
( )
2yz
xz zz
w
uw w w
t x z z
p
z x y z
ρ υ τ τ τ ∂ ∂ ∂ ∂ + + + ∂ ∂ ∂ ∂ ∂ ∂ ∂ ∂ = − + + + ∂ ∂ ∂ ∂ (4)
for momentum in the three coordinate directions. In these equations, u, υ, and w are velocities in the x, y, and z directions, respectfully. The symbol τ represents the stress tensor in the fluid. In addition, blood was treated with an Ostwald-de Waele non-Newtonian model as de-scribed in [31]. The constitutive equation for shear stress is:
n K
τ = γ (5)
with K = 0.0147 (kg/m-s1.22), γ is the strain rate, and n = 0.78 [32]. Blood density was set to be 1050 kg/m3.
Insofar as the simulations are unsteady, it is necessary to calculate the results at a series of timesteps. A detailed timestep study was undertaken to ensure that the results are independent of time step. During this timestep study, the cardiac cycle was subdivided into 100, 200, 400, 1000, and 4000 time steps. A comparison of the results showed that 4000 time steps were sufficiently small (cycle-average pressure drop through the geometry dif-fered by ~2%).
Similarly, calculations were performed with element counts of 2.6 million, 4.3 million, 7.8 million, 13 million, and 20 million. It was discovered that a mesh entailing 2.6 million elements provided results (inlet pressure, flow distribution, wall shear) that were indistinguishable from the more refined cases. Consequently, the results which will be displayed were taken from the 2.6 million element case. Figure 4 has been prepared to show the deployment of elements along the flow geometry. It is seen that the elements are refined in areas of particular interest, including the aneurysm neck.
3. RESULTS AND DISCUSSION
There are a number of results that are of particular inter-est. Some of those results are global in nature, such as the inlet pressure and the flow subdivision to each of the three outlets. Comparisons will be made for each of the relevant global quantities and the impact of the wave-form will be highlighted. In addition to global quantities, local flow patterns are of interest. Among the most im-portant local features of the flow are the wall shear stress values in the aneurysm and the velocity patterns.
3.1. Comparison of Wall Shear and Flow Patterns
[image:3.595.76.291.397.634.2]The first comparison to be made is of the flow patterns
within the artery region. To facilitate the discussion, Figure5 was prepared to show a semitransparent view of the artery with an opaque plane. The plane is posi-tioned to provide contour plots of fluid velocities. The location of the plane was selected to capture some of the key flow features within the system.
Next, velocity patterns are shown for a subset of the cases listed in Table 1 (Figure 6). The images are ex-tracted at peak systole. The selected cases were chosen to maximize the differences between the results (slow, low, high, and fast). Despite this attempt, the patterns of flow are remarkably similar to each other. The similarity is in the gross scale as well as in fine detail. In particular, at the exit of the aneurysm, there is a jet of high-speed fluid (red colored) and secondary flows (eddies). These flow structures appear in all four cases. While the results shown in Figure 6 are extracted at peak systole, it was found that similar results would be obtained if flow pat-terns at other times were to be evaluated.
[image:4.595.315.531.76.615.2]In addition to the velocity patterns, values of the wall shear stress are helpful in determining whether an aneu-rysm grows or ruptures. Figure 7 has been created to illuminate the values of the wall shear stress, with a fo-cus on areas of particular interest (the aneurysm neck). It is seen that for all the cases shown in Figure7, the wall stress is very high at the neck compared to elsewhere in the artery. High local shear stress is expected here be- cause of the flow acceleration that occurs at the neck contraction. Also, the higher flowrate cases express higher values of shear stress. In fact, the maximum wall stress values vary nearly linearly with the peak flowrate. There is a local maximum in the wall shear stress which occurs at the location where a jet of high speed fluid ex-its the aneurysm. All results are extracted at peak systole. The similarity in the size and position of the maximum shear stresses is remarkable. If shear stress patterns were
Figure 5. Viewing plane used to extract velocity con-tours.
[image:4.595.72.268.529.710.2]Figure 6. Comparison of flow patterns on the plane of Figure 5 for four different cases.
extracted at other times during the cardiac cycles, the similarities between the cases would persist.
Figure 7.Wall shear stress near the aneurysm neck for low, base, and highflow cases.
Table 2. Maximum wall shear values.
Case Designation Maximum Wall Shear (Pa)
1 (Baseline) 97
2 (Fast Baseline) 141 3 (Fast Lowflow) 99
4 (Highflow) 124
5 (Lowflow) 71
6 (Slow Baseline) 75 7 (Slow Highflow) 95
stresses. Alternatively, slower pulses and lower flows cause lower stresses. While this behavior would have been expected based on basic fluid mechanics, the quan-tification of the results is useful.
3.2. Pressure Drop and Flow Distribution
A quantity of particular interest from both a fluid dy-namic and clinical standpoint is the overall pressure drop through the system. There are two main sources of pres-sure losses which are additive. The first is prespres-sure loss
associated with friction between the fluid and the wall. The common expression for frictional pressure losses in a straight tube is [33]
2 friction
1 2 L
P f V
D ρ
∆ = (6)
The symbols f, L, and D are the friction factor, length, and diameter, respectively.
This expression, which was developed for flows in straight tubes and ducts, cannot be applied directly to the present case because of the changes in cross section that occur in the flow direction. However, it is still illuminat-ing because the friction factor f varies inversely with the cross sectional average velocity for laminar flows. Con-sequently, for laminar flow, the friction pressure loss contribution varies as ~velocity.
The second source of pressure loss is from flow sepa-ration as the fluid passes through obstructions and direc-tion changes in the passageway. The separadirec-tion pressure loss (commonly called minor loss in fluid mechanic texts [31]), is typically calculated by Equation (7), where KLOSS is the loss coefficient.
2 separation LOSS
1 2
P K ρV
∆ = (7)
For flow in pipes and ducts, catalogs of loss coeffi-cients are available in handbooks and fluid textbooks. For more unique shapes, such as those of the aneurysm, the loss terms must be determined on a case-by-case ba-sis. However, regardless of the value of KLOSS, the
rela-tionship between the separation pressure losses and cross sectional average velocity is ~velocity2.
When the two pressure loss components of Equations (6) and (7) are considered together, Equation (8) is ob-tained
2
total separation friction ~ ~ ~
n
P P P V V V
∆ = ∆ + ∆ = + = (8)
where the two terms should give rise to a dependence on velocity that is 1 < n < 2. While the relative strengths of the friction and separation terms are not known a priori, and depend on patient-specific flow and geometry, it is reasonable to attempt to normalize the pressure loss through the system according to Equation (9).
1.5 total
1 ~
2
P ρV
∆ = (9)
So that a reduced pressure term is defined for the sev-en cases of Table 1 that is
friction 1.5
1 2
P P
V
ρ
∆
′ = (10)
[image:5.595.55.288.475.598.2]No attempt is made to annotate the separate lines of Figure8 because of their close proximity to each other, although a color legend associates the curves with a par-ticular flow case.
In order to explore the connection between the pres-sure and the flowrate, Figure9 has been prepared. That figure has two curves, each with its own vertical axis. The velocity, which is taken at the inlet, is linked to the axis on the left. The pressure at the inlet is quantified on the right. The data for Figure 9 is one of the cases in Table1 (Case 5), however, if another case were shown, a similar graph would result. It is seen that the pressure rise occurs prior to the increase in velocity (t T 0.15) where T is the pulsation period. In fact, the increase in inlet pressure causes the acceleration of flow. Similarly, it is seen that the pressure decreases prior to the slow-down of flow (t T 0.5). The lag ehavior displayed in Figure9 is expected from basic fluid mechanics, how-ever, the results of the simulation allow a quantification of the lag, which is approximately 0.1 times the cardiac period.
Another major item of interest is the impact of inlet waveform on flow distribution. To investigate this, the cycle-averaged flow through each outlet was calculated for the seven cases of Table3. All values are rounded to the nearest decimal so that the rounded values may ex-ceed 100%. An overview of the results suggests that the details of the waveform at the inlet have a very minor impact on the downstream distribution of flow through the respective outlets.
4. CONCLUDING REMARKS
A detailed numerical study has been performed on the impact of waveform on the flow patterns, wall shear stress, overall pressure drop through an aneurysm, and flow distribution. Seven waveforms were considered to be
[image:6.595.308.539.263.389.2]t T
Figure 8. Values of reduced pressure, Pʹ, at the neck of
the aneurysm.
t T
Figure 9. Superposition of pressure and average velocity (equivalency of flowrate) at the aneurysm inlet.
Table 3.Summary of flow distribution through outlets.
Case Outlet 1 Outlet 2 Outlet 3
1 20% 60% 20%
2 20% 60% 20%
3 20% 61% 20%
4 20% 60% 20%
5 20% 62% 19%
6 20% 62% 19%
7 20% 61% 20%
varied in duration and flowrate. It was found that despite the significant differences between the inputs, a remark-able agreement was achieved in the results. For instance, it was found that the flow patterns were remarkably sim-ilar, even when small flow features were investigated. It was also found that the patterns of wall shear stress were remarkably consistent from one case to another. It was seen that the magnitude of the maximum shear stress scaled nearly linearly with the peak systolic flowrate. Another major similarity was with regard to the flow distribution to the multiple outlets. Among the seven cases, the flow distributions were similar within two percent.
In addition to the aforementioned, it was found that there is a reduced pressure, scaled by the velocity, that allows the inlet pressures to nearly collapse onto a single curve. To the best knowledge of the authors, this univer-sal curve has not appeared in the literature. It is expected that while the universal curve is patient-specific, it is not dependent on the pulse rate or overall flowrate.
Finally, it was found that the pressure variations at the inlet preceded changes to the velocity by about 10% of the cardiac period.
REFERENCES
[image:6.595.68.277.532.710.2]and arterial wall mechanics. Computer Methods in Ap-plied Mechanics and Engineering, 198, 3514-3523.
[2] Shojima, M., et al. (2004) Magnitude and role of wall shear stress on cerebral aneurysm: Computational fluid dynamic study of 20 middle cerebral aneurysms. Stroke, 35, 2500-2505.
[3] Cebral, J.R., et al. (2005) Characterization of cerebral aneurysms for assessing risk of rupture by using patient- specific computational hemodynamics models. American Journal Neuroradiology, 26, 2550-2559.
[4] Shojima, M., et al. (2005) Role of the bloodstream im-pacting for and the local pressure elevation in the rupture of cerebral aneurysms. Stroke, 36, 1933-1938.
[5] Boussel, L.V., et al. (2008) Aneurysm growth occurs at region of low wall shear stress: Patient specific correla-tion of hemodynamics and growth in a longitudinal study.
Stroke, 39, 2997-3002.
[6] Cebral, J.R., (2009) Hemodynamics in a lethal basilar artery aneurysm just before its rupture. American Journal Neuroradiology, 30, 95-98.
[7] Sforza, D.M., Putman, C.M. and Cebral, J.R. (2009) He-modynamics of cerebral aneurysms. Annual Review of Fluid Mechanics, 41, 91-107.
[8] Jou, L.-D. and Mawad, M.E. (2011) Timing and size of flow impingement in a giant intracranial aneurysm at the internal carotid artery. Medical and Biological Engineer-ing and ComputEngineer-ing, 49, 891-899.
[9] Penn, D.L., Komotoar, R.J. and Connolly, S. (2011) He-modynamic mechanisms underlying cerebral aneurysm pathogenesis. Journal of Clinical Neuroscience, 18, 1435-
1438.
[10] Kerber, C.W., Imbesi, S.G. and Knox, K. (1999) Flow dynamics in a lethal anterior communicating artery aneu-rysm. American Journal Neuroradiology, 20, 2000-2003. [11] Steinman, D.A., et al. (2003) Image-based computational
simulation of flow dynamics in a giant intracranial aneu-rysm. American Journal of Neuroradiology, 24, 559-566. [12] Valencia, A. and Solis, F. (2006) Blood flow dynamics
and arterial wall interaction in a saccular aneurysm model fo the basilar artery. Computers and Structures, 84, 1326-
1337.
[13] Chen A., Sayre, J. and Vinuela, F. (2013) Quantitative comparison of the dynamic flow waveform changes in 12 ruptured and 29 unruptured ICA-ophthalmic artery aneu-rysms. Neuroradiology, 55, 313-320.
[14] Hodis, S., et al. (2013) Computational fluid dynamics simulation of an anterior communicating artery ruptured during angiography. Journal of Neurointerventional Sur-gery.
[15] Grinberg, L. and Karniadakis, G.E. (2008) Outflow boundary conditions for arterial networks with multiple outlets. Annals of Biomedical Engineering, 36, 1496-
[16] Marzo, A., et al. (2010) Computational hemodynamics in cerebral aneurysms: The effects of modeled versus meas-ured boundary conditions. Annals of Biomedical Engi-neering, 39, 884-896.
[17] Hodis, S. and Zamir, M. (2011) Pulse wave velocity as a diagnostic index: The pitfalls of tethering versus stiffen-ing of the arterial wall. Journal of Biomechanics, 44, 1367-1373.
[18] Hodis, S. and Zamir, M. (2011) Mechanical events within the arterial wall under the forces of pulsatile flow: A re-view. Journal of the Mechanical Behavior of Biomedical Materials, 4, 1595-1602.
[19] Cavazzuti, M., Atherton, M.A., Collins, M.W. and Ba-rozzi, G.S. (2010) Non-Newtonian and flow pulsatility effects in simulation models of a stented intracranial aneurysm. Proceedings of the Institution of Mechanical Engineers, Part H, 225, 597-609.
[20] Cavazzuti, M., Atherton, M.A., Collins, M.W. and Ba-rozzi, G.S. (2010) Beyond the virtual intracranial stenting challenge 2007: Non-Newtonian and flow pulsatility ef-fects. Journal of Biomechanics, 43, 2645-2647.
[21] Xiang, J., et al. (2012) Newtonian viscosity model could overestimate wall shear stress in intracranial aneurysm domes and underestimate rupture risk. Journal Neuroin-terventional Surgery, 4, 351-357.
[22] Hodis, S., et al. (2012) Grid convergence errors in hemo- dynamic solution of patient-specific cerebral aneurysms.
Journal of Biomechanics, 45, 2907-2913.
[23] Khakpour, M. and Vafai, K. (2008) A critical assessment of arterial transport models. International Journal of Heat and Mass Transfer, 51, 807-822.
[24] Khaled, A.R.A. and Vafai, K. (2003) The role of porous media in modeling flow and heat transfer in biological tissues. International Journal of Heat and Mass Transfer, 46, 4989-5003.
[25] Khanafer, K. and Vafai, K. (2006) The role of porous media in biomedical engineering as related to magnetic resonance imaging and drug delivery. Heat and Mass Transfer, 42, 939-953.
[26] Schwalbach, D.B., Plourde, B.D., Abraham, J.P. and Kohler, R.E. (2013) Drug dispersion for single- and mul-ti-lumen catheters. Journal of Biomedical Science and Engineering, 6, 1021-1028.
and Kohler, R.E. (2013) Controlling the rate of penetra-tion of a therapeutic drug into the wall of an artery by means of a pressurized balloon. Journal of Biomedical Science and Engineering, 6, 527-532.
[28] Hoi, Y., Wasserman, B.A., Xie, Y.J., Najjar, S.S., Ferruci, L., Lakatta, E. and Steinman, D.A. (2010) Characteriza-tion of volumetric flow rate waveforms at the carotid bi-furcation of older adults. Physiological Measurements, 31,
291-302.
[29] Zamir, M. (2005) The physics of coronary blood flow. Springer, Berlin.
[30] Gebreegziabher, T., Sparrow, E.M., Abraham, J.P., Ayo-rinde, E. and Singh, T. (2011) High-frequency pulsatile
pipe flows encompassing all flow regimes. Numerical Heat Transfer, 60, 811-826.
[31] Abraham, J.P., Sparrow, E.M. and Lovik, R.D. (2008) Three-dimensional fluid mechanical analysis of blood flow in plaque-narrowed and plaque-free arteries. Inter-national Journal of Heat and Mass Transfer, 51, 5633- 5641.
[32] Walburn, F. and Schneck, D. (1976) A constitutive equa-tion for whole human blood. Biorheology, 13, 201-210. [33] Idelchik, I.E. (1986) Handbook of hydraulic resistance.