Munich Personal RePEc Archive
Globalisation and Cointegration among
the States and Convergence across the
Continents: A Panel Data Analysis
De, Utpal Kumar
North Eastern Hill University
30 May 2011
Online at
https://mpra.ub.uni-muenchen.de/6166/
1
Globalisation and Cointegration among the States and
Convergence across the Continents: A Panel Data Analysis
Utpal Kumar De Department of Economics North-Eastern Hill University Shillong, 793022, Meghalaya Ph: +91-3642723182 (O), +91-3642726182 (R), +91-9436102066 (M) Email: [email protected]
Abstract
This paper tried to examine the level of cointegration among various nations across the continents in regard to the globalisation. Also here attempt is made to analyse the nature of inter and intra continental variation in globalisation over time. The proximity and convergence over time in terms of the growth of globalisation is also examined by using a panel data set over a period of 1970 to 2007. The outcome reveals the presence of integration among the selected nations despite the fact that the European nations are more co-integrated than the other continents. It is followed by the countries in Africa and Asia. The proximity matrices of overall globalisation and political globalisation provided some important indications that geographical proximity, economic necessities, cultural and political understanding play crucial role in determining the clusters of countries in terms of globalisation or choice of the countries to open with other nations for trade, cultural exchange etc.
Key words: Globalisation, Proximity, Stationarity, Cointegration, Regional Convergence, Panel Data.
JEL Classification: H77, O57, O40, F43, C82, R1, R11
2
Globalisation and Cointegration among the States and
Convergence across the Continents: A Panel Data Analysis
Introduction:
Globalisation has become a myth and conceived to be the solution to several social and
economic problems across countries (World Bank and IMF, 2007). Nations are supposed to
gain more in terms of faster economic growth, improvement of human development through
globalisation and interactions with other countries than national isolation (Dreher, 2006;
Kulkarni, 2005; Amavilah, 2009a). Amavilah (2009b) have also shown that human
development index depends on conventional factors and forces, national symbols as well as
globalisation. Opening up of free trade not only increases efficiency but also helps in
reducing pollution emission due to greater competitive pressure and greater access to greener
production technologies (Cole, 2004). International capital transactions might also affect
national pollution levels (Antiweiler et al, 2001). However, Heintz (2006) raised doubts about
the role of globalisation in employment challenge and ensuring quality of work life, poverty
reduction as well as gender equity. According to Cherni (2001), “the problem that
globalisation has not been able to dissolve is the pronounced economic and many other unjust
disparities between the developed and developing world. If anything, environmental
problems that have been caused or worsened as a result of globalization in cities of the
developing world can be added to a list of already existing, and perhaps worsening, critical
problems such as poverty and lack of sanitation and running waste and accumulating urban
waste”. Thus, there are contradictory forecasts in regard to the impact of globalisation on the
development as perceived by various researchers. Despite many limitations pointed out by a
large number of studies and cautions against unrestricted globalisation and opening of
countries to the outside world without considering the competing ability of the domestic
sectors, bringing in foreign capital without considering its social, economic, demographic and
environmental consequences; a large number of countries have followed this path blindly
(Beams, 2000; Effland et al, 2006; Heintz, 2006; Tang, 2008; Versi, 2004; Ewege, 2005).
The move for trade relaxation, integration of economies and globalisation came out of
the apprehension that it is very difficult to progress beyond a certain point with their own
3 and thus interdependence and free trade has no other alternative that leads to specialisation,
accelerate trade and mutually benefit the participating countries that leads to the faster growth
of their economies. The bargaining capability, socio-political strength, terms of trade and its
change remain out of consideration among many of the country heads and that ultimately
leads to some undesirable consequences afterwards. Of course, a few countries, who despite
being the signatory of many international treaties, follow the path of globalisation and open
economy with some restrictions to safeguard the interest of various domestic industries, their
employees, markets and also the socio-cultural values.
Moreover, there are differences in timing and phase of implementations of globalisation
measures (tariff reduction and opening of domestic market to international businesses and
entrepreneurs, allowing foreign capital and labour movement etc) by several countries not
only due to the apprehension of facing unequal and stiff competition without having adequate
technological progress, but also due to the fear of adverse impacts on the social and economic
position and hence strong opposition faced from various social and political institutions at
home (Beams, 2000; Effland et al, 2006). Thus, we observe even within the same Asian
region such as China, Malaysia, Singapore, Korea etc started integrating their economies with
the rest of the world much earlier (in 1980s) while India followed the path only in 1990s after
the observation of faster growth of those economies through capital and technological
transfer from the developed countries. Moreover, despite the social and political differences
many of the countries are found open their trade relaxations first with their geographical
neighbours although due to the scarcity of material wealth and technology they are also found
to open trade and socio-political relations with some distant countries but with some time lag.
Therefore, the differences in proximity in terms of globalisation are apparent among the
nations across the continents. It may also be due to the ideological differences, political set up
and the requirement of commodities and technologies. For example, out of the necessity for
petroleum, India had to foster more trade ties with oil and natural gas producing countries
like Syria, Arab, Iran etc even though they are relatively distant nations. Homogeneity of
socio-political, economic and cultural homogeneity may be the important reasons behind the
closeness among the nations across the continents.
The purpose of the present paper is to examine the level of cointegration among various
nations across the continents in regard to the globalisation. Also the proximity and
convergence over time in terms of the growth of globalisation is examined by using a panel
4
Data:
Data on various globalisation indices across the countries for the period 1970 to 2007
have been collected from the KOF index of globalisation Dreher (2006), Dreher et al (2008).
The information on GDP across the countries for the years 1970, 1983, 1992 and 2008 have
been collected from various issues of World Development Reports. Also human development
index figures were collected from various issues of Human Development Report published by
UN. As information on all aspects of globalisation, GDP, Human Development Index is not
available for some countries, which were not considered for the present analysis. We have
considered only 75 countries across the continents for which data on all the relevant variables
are available for the period 1970 to 2007 or 2008.
Methods:
First of all we examined the stationarity of the globalisation index across the countries
by using augmented Dickey-Fuller (ADF) test (Unit Root test, Dickey and Fuller, 1979). The
test is done on the basis of the following regression equation:
Yit = i + i . t + i0 Yi, t-1 + δ, Yi, t-j + it where t = 1, . . ., T ... (1)
Here, Yit is the value of globalisation index of ith country at time t. The inference is based on
the usual -statistic of i0, which has a non-standard distribution. The Akaike information
criterion is used to determine the lag length parameter pi. Equation is estimated in both form,
including and excluding time trend.
Thereafter we tested whether the countries in each continent are co-integrated in terms
of growth of globalisation over time by using augmented Engle-Granger (AEG) test (Engle
and Granger, 1987). Similar regression like that of equation-1 is used for least square errors
obtained from the regression of time series data on globalisation index of a country on those
of other countries in each continent. Also, the coefficient of variation in the level of
globalisation among the countries in each continent and its variation over time is computed.
From the trend of coefficient of variation we can examine the convergence or divergence of
the series of globalisation among the countries across various continents.
A number of methods have been used for the testing of convergence. Inverse relation
between the rate of growth and initial value is used as the condition of convergence by
Baumol (1986), DeLong (1988), Barro (1991), Barro and Sala-i-Martin (1992), and Mankiw
et al. (1992). But the method was criticised by Quah (1993), Bernard and Durlauf (1996), and
5 root and cointegration techniques for examining convergence (Quah, 1992; Bernard and
Durlauf, 1995; Li and Papell, 1999). Also, panel unit root test is suggested by Levin and Lin
(1992, 1993), Quah (1994), Im et al. (1997), Taylor and Sarno (1998), Choi and Ahn (1999).
Im et al. (1997) propose a Lagrange multiplier (LM) statistic to test for the presence of unit
roots in the panel framework. Sala-i-Martin’s (1994, 1995) so-called beta convergence is also
associated with some methodological problems that raises the question of effectiveness of
this method, especially in case of the time series data. Here, for the purpose, testing of
stationarity of coefficient of variation is used. If the coefficient of variation is stationary, it is
an indication of the convergence of the selected countries of a continent in terms of
globalisation. Also Johansen’s method of testing Co-integration is used to test whether any
co-integration exists or not among the continents in terms of temporal variation in coefficient
of variation in globalisation index among the selected countries.
Looking at the similarity and dissimilarity in the move towards globalisation across the
countries one can check the cluster of countries in terms of timing and degree of steps
towards globalisation. The proximity and clusters of the countries across the continents in
terms of cluster of globalisation is examined through the dendogram drawn on the panel data
on globalisation index.
Annual compound rate of growth of various indices for the period 1970 to 2007, 1970
to 1990 (pre-globalisation movement) and 1990 to 2007 (post-globalisation movement) have
also been computed to see the changes before and after the 1990 after which the focus of
globalisation with GATT accord and formation of WTO have taken place. Also structural
transformation has taken place in various countries after 1990, though some countries started
opening up their economies in the 1980s. Annual compound rates of growth of GDP of
various countries from 1970 to 2008, as well as for the sub-periods 1970 to 1992 and 1992 to
2008 have been computed. In the same way, rate of growth of HDI during 1975 to 2005 and
also for 1975 to 1990 and 1990 to 2005 sub-periods has been computed.
Also the correlation between the growth of different components of globalisation
indices and the growth of human development indicators for various sub-periods are
calculated to know if there exists any such relation. It would help us in identifying the role of
globalisation and its components in the growth of human development of various countries.
Also the bi-variate correlation between growth and coefficient of variation in growth between
various globalisation indices and that of GDP and HDI across the continents during the whole
6
Results:
The result of augmented Dickey-Fuller (ADF) test used for trend stationarity of the
degree of overall globalisation across the countries (presented in Appendix-2) shows that the
series follow random walks i.e., integrated of order one for all the selected countries across
the continents despite the fact that there are differences in the value of lag coefficients.
Therefore, theoretically there is the possibility that the countries within a continent will be
cointegrated in terms of growth of overall globalisation over the years. The augmented
Engel-Granger (AEG) tests as well as the Log-likelihood estimated results are presented in Table 1.
Also the trace statistics shows the presence of at least one co-integrating equation, which is
however not presented here.
Table 1: Testing Co-integration of overall Globalisation among the Countries across the Continents in the World
Continent Coefficient T-value* Adj. R2 F-Statistic Log-likelihood AIC Max-lag Remark Asia -0.91461 -5.4754 .44599 29.980 -28.3663 1.641 9 Co-int. At 1% Europe -0.99359 -5.8768 .48229 34.537 -55.4243 3.104 9 Co-int. At 1% Africa -0.95997 -5.1981 .41955 27.021 -65.1864 3.632 9 Co-int. At 1% North America -0.46464 -3.3157 .20493 5.511 -52.7574 3.098 9 Co-int. At 1% South America -0.75352 -4.6866 .36803 21.965 -55.3917 3.102 9 Co-int. At 5% Oceania -0.61742 -3.9338 .28678 15.475 -87.8473 4.857 9 Co-integrated
*Critical value at 1% level = -3.621023, at 5% level = -2.943427, at 10% level = -2.610263
The table shows that the lag coefficients in all cases are significant and all the
continents are co-integrated in terms of globalisation move throughout the period. But there
are differences in the level of integration and European countries are found to be more
co-integrated which may be due to their social, economic, demographic and cultural
homogeneity than that of other continents. It is followed by the countries in Africa and Asia,
which is due to the fact that majority of African countries are still underdeveloped and they
have not progressed much in terms of globalisation and expanding their export markets,
inflow of foreign capital. But some of Asian countries integrated with the world at a very
faster rate (Korea, Indonesia, Singapore, China) and some have started some time later and
with some caution (India, Sri Lanka etc) and some are still lagging behind. But all are
following more or less same economic policies with little variation in degree. Also there is
huge difference in the size of the Asian economies in terms of population, GDP, investment
where three of the four most populous countries in the world belong and all of them followed
the same path despite the varied opposition against the globalisation at domestic level. The
7 coexistence of very large economy like USA, Canada and also the very small economy like
[image:8.595.111.487.117.651.2]Panama, Trinidad & Tobago. Similar is the case of South America and Oceania.
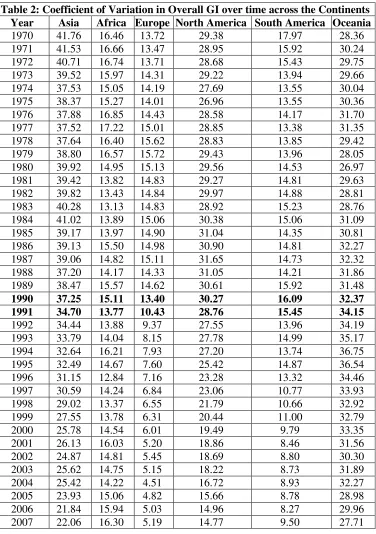
Table 2: Coefficient of Variation in Overall GI over time across the Continents Year Asia Africa Europe North America South America Oceania
1970 41.76 16.46 13.72 29.38 17.97 28.36
1971 41.53 16.66 13.47 28.95 15.92 30.24
1972 40.71 16.74 13.71 28.68 15.43 29.75
1973 39.52 15.97 14.31 29.22 13.94 29.66
1974 37.53 15.05 14.19 27.69 13.55 30.04
1975 38.37 15.27 14.01 26.96 13.55 30.36
1976 37.88 16.85 14.43 28.58 14.17 31.70
1977 37.52 17.22 15.01 28.85 13.38 31.35
1978 37.64 16.40 15.62 28.83 13.85 29.42
1979 38.80 16.57 15.72 29.43 13.96 28.05
1980 39.92 14.95 15.13 29.56 14.53 26.97
1981 39.42 13.82 14.83 29.27 14.81 29.63
1982 39.82 13.43 14.84 29.97 14.88 28.81
1983 40.28 13.13 14.83 28.92 15.23 28.76
1984 41.02 13.89 15.06 30.38 15.06 31.09
1985 39.17 13.97 14.90 31.04 14.35 30.81
1986 39.13 15.50 14.98 30.90 14.81 32.27
1987 39.06 14.82 15.11 31.65 14.73 32.32
1988 37.20 14.17 14.33 31.05 14.21 31.86
1989 38.47 15.57 14.62 30.61 15.92 31.48
1990 37.25 15.11 13.40 30.27 16.09 32.37 1991 34.70 13.77 10.43 28.76 15.45 34.15
1992 34.44 13.88 9.37 27.55 13.96 34.19
1993 33.79 14.04 8.15 27.78 14.99 35.17
1994 32.64 16.21 7.93 27.20 13.74 36.75
1995 32.49 14.67 7.60 25.42 14.87 36.54
1996 31.15 12.84 7.16 23.28 13.32 34.46
1997 30.59 14.24 6.84 23.06 10.77 33.93
1998 29.02 13.37 6.55 21.79 10.66 32.92
1999 27.55 13.78 6.31 20.44 11.00 32.79
2000 25.78 14.54 6.01 19.49 9.79 33.35
2001 26.13 16.03 5.20 18.86 8.46 31.56
2002 24.87 14.81 5.45 18.69 8.80 30.30
2003 25.62 14.75 5.15 18.22 8.73 31.89
2004 25.42 14.22 4.51 16.72 8.93 32.27
2005 23.93 15.06 4.82 15.66 8.78 28.98
2006 21.84 15.94 5.03 14.96 8.27 29.96
2007 22.06 16.30 5.19 14.77 9.50 27.71
8 Table 2 reveals that though initially there was high degree of variation in overall
globalisation across the Asian countries, it declined sharply after the globalisation move in
1991. Almost all the continents recorded decline in inter-country variation in globalisation
index during 1990s except the Africa and Oceania where marginal changes are observed. The
indication is that majority of countries across the globe, except a few in Africa and Oceania
could follow the tempo of globalisation after the GATT accord and formation of WTO to
promote free trade, flow of capital and investment, cultural and knowledge exchange in order
to achieve faster growth, reduce poverty etc. Despite the rapid reduction in inter-country
variation in overall globalisation, Asia is still at the top in terms of variation in globalisation
level across the countries, which may be due to large scale variation in economic,
demographic, socio-political scenario across the countries. On the other hand, Europe
recorded sharp decline in inter-country variation in overall globalisation especially after the
formation on EU and of course the globalisation move across the world. The cultural,
economic, technological, demographic and socio-political homogeneity has prompted these
countries to open themselves among EU as well as other countries in the world. The much
dependence on technological advancement and trade for the progress of these nations are well
known since long time and that got more impetus after the formation EU and WTO.
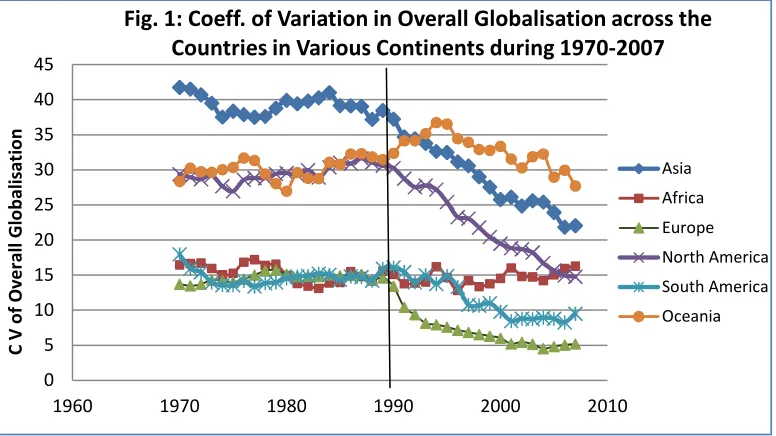
The convergence of the selected countries in terms of overall globalisation is examined
through the trend of coefficient of variation in globalisation index across the countries in all
those continents. First of all, stationarity of the coefficient of variation is checked by using
augmented Dickey-Fuller test with Schwarz Information Criterion. Also the coefficient of
0 5 10 15 20 25 30 35 40 45
1960 1970 1980 1990 2000 2010
[image:9.595.105.493.72.290.2]C V o f O v e ra ll G lo b a li sa ti o n
Fig. 1: Coeff. of Variation in Overall Globalisation across the Countries in Various Continents during 1970-2007
9 trend is estimated and its significance is examined by using least square regression Ln Y it = a
+ b.t + uit ... (2). Yt is the coefficient of variation. The result is presented in Table 3.
Table 3: Test of Trend Stationarity and Trend of Coefficient of Variation in overall Globalisation among the Selected Countries across the Continents
Schward Info Criterion Least square Regression on Time Level Form First Difference Dependent Variable is Ln CV Continent Coeff. Coeff. Coeff. t-statistic R2 Rbar2 F
Asia .0234 .8145 -1.0178 -5.897* -.016 -12.53* .813 .808 156.98* Europe -.0085 -.333 -.550 -3.566** -.036 -11.97* .799 .794 143.29* Africa -.3667 -2.825 -1.0725 -6.262* -.0024 -2.18** .116 .092 4.736* North America .0487 1.721 -.756 -4.541* -.0167 -8.144* .648 .638 66.324* South America -.0859 -1.447 -1.056 -6.301* -.0154 -7.486* .609 .598 56.034* Oceania -.1603 -1.682 -1.0656 -6.155* .0025 2.417** .14 .12 5.843*
Critical Value at 1% = -3.621, 5% = -2.943
1% = -3.627, 5% = -2.946
1% = -.2.457, 5% = -1.697
Note: * indicates that the coefficient is significant at 1% level of significance, while ** indicates that the coefficient is significant at 5% level of significant.
Table 3 reveals that all the series of coefficient of variations are non-stationary (have
unit root) but integrated of order one (as the first difference of all the series are stationary).
The coefficients of the first difference series are negative that indicate all the selected
countries within each continent have been converging over time. In other words, the countries
that were already more globalised, chance of further globalisation declines; while the
countries that were closed to the outside world after they opened and started relaxing barriers
scope of globalisation become faster than those formerly open economies. The differences in
the coefficients are indications of different level of convergence and the continents having
high initial coefficient of variation like Asia recorded faster convergence than the continents
having less initial inter-country variations like that of Europe.
Moreover, testing of co-integration of coefficient of variation in globalisation index
(across the counties) of six continents by using trace statistics, maximum Eigen value as well
as co-integrating coefficient (Johansen Cointegration Test) as presented in Appedix-1
suggests that there exist at least one co-integrating equation. Johensen (1988) test is used for
the advantage of knowing multiple cointegrated equations. It is also a broad indication of
reduction in variability in openness among the nations of various continents.
The dendogram drawn on the panel data on globalisation index shows the cluster of
countries in respect of globalisation within each continent. Figure 2 shows that among the
Asian countries India, Pakistan, Sri Lanka, Bangladesh, Nepal and Syria (mostly south-east
Asian nations) belong to a single cluster. The second broad cluster includes South Korea,
10 in early 1980s and recorded faster growth and preceded the countries in the former cluster.
Most of the countries in the former cluster recorded faster economic growth in later part of
1990s (De and Pal, 2011). The third broad cluster includes Japan, Malayasia, Israel, Turkey
and Oman who were also open much before due to the industrial progress through
technological and human capital transfer and also because of the business of oil by Oman.
Due to its vicinity with Europe Turkey also have historical openness with the neighbouring
countries. Singapore is however is outside these clusters as it has been an open economy with
large industrial and international business centre and one of the best tourist destinations for a
[image:11.595.78.521.300.547.2]long period of time.
Fig. 2a however shows that India, Turkey, Japan, Indonesia and Pakistan form a cluster
in terms of political globalisation, while Israel, Syria, Iran and Sri Lanka form another
cluster. Malaysia, Thailand, Philippines, South Korea, Bangladesh, China and Singapore
belong to a single cluster in terms of political globalisation. Oman is outside any of these
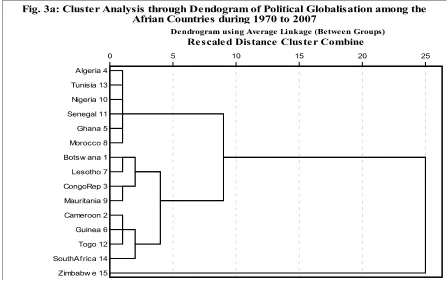
12 Within Africa, Ghana, Senegal, Algeria and Nigeria are in proximity and belong to one
cluster in terms of both overall and political globalisation (Fig. 3 and Fig. 3a). Congo,
Lesotho and Togo are in close proximity in terms of overall globalisation. However,
Cameroon, Mauritania and Zimbabwe are connected with the former two clusters distantly
and are the most backward in terms of various economic development parameters. Morocco,
[image:13.595.74.522.72.356.2]South Africa, Botswana and Tunisia form another cluster in terms of overall globalisation.
Fig. 3a also shows that Botswana, Lesotho, Congo Republic and Mauritania have been close
neighbours in terms of political globalisation and Cameroon, Guinea, Togo and South Africa
form another cluster. Whereas, Zimbabwe has been suffering from high level of political
instability & is out of any cluster in terms of political openness.
In Europe, four broad clusters in terms of overall globalisation and three main clusters
in respect of political globalisation over time are observed (Fig. 4 and Fig. 4a). Ireland,
Norway, Denmark and Austria are in proximity among themselves; while Switzerland,
Sweden, Belgium and Netherlands are in another cluster. France, England and Finland form a
cluster, whereas Hungary, Portugal, Italy, Spain and Greece belong to one cluster in respect
of overall globalisation. Moreover, the first two clusters are closely linked with each other.
Austria, Italy, Belgium, France, Netherlands and the Nordic countries Sweden, Finland,
13 Hungary, Portugal, Greece and Ireland, Spain, Switzerland are two small clusters and they
14 Among the selected North-American countries only USA and Canada belong to one
cluster in terms of overall as well as political globalisation index, who are also the
geographical neighbour (Fig. 5 and 5a). Dominican Republic, Nicaragua, Guatemala and
Honduras are in one cluster and Costa Rica, Jamaica, Trinidad and Tobago form a cluster
with Panama in terms of overall as well as political globalisation indicators. However, except
USA and Canada all other countries follow more or less similar path in respect political
globalisation as is clear from Fig 5a. Geographical proximity here is highly related to the
16 There is minor difference in the clusters of overall and political globalisation in South
America though geographical proximity also plays an important role in the path of
globalisation followed by countries. On the one hand Brazil, Guyana and Venezuela are in
one cluster while Argentina, Uruguay and Chile belong to another cluster in terms of overall
globalisation. Ecuador, Paraguay, Colombia, Peru and Bolivia form a cluster in the sense of
overall globalisation. However, Brazil joins the cluster of Argentina, Uruguay and Chile in
the group of political globalisation and Venezuela joined the group of Bolivia, Paraguay,
Colombia, Ecuador and Peru in political globalisation and that group is remotely connected
with the former group in respect of political globalisation move. On the other hand, Guyana
and Surinam remain jointly isolated in terms of political openness.
Table-3A: Average Compound Rate of Growth of GDP and HDI during the Whole Period
1 2 3 4 5 6 7
Continent GDP 1970-2008
GI 1970-2007
PGI 1970-2007
SGI 1970-2007
EGI 1970-2007
HDI 1975-2005
Asia 0.0850 0.0196 0.0224 0.0228 0.0178 0.0104
Africa 0.0692 0.0131 0.0206 0.0073 0.0132 0.0080
Europe 0.0971 0.0112 0.0053 0.0158 0.0122 0.0035
North America 0.0658 0.0116 0.0110 0.0098 0.0145 0.0052
South America 0.0848 0.0143 0.0128 0.0154 0.0162 0.0056
17
Table-3B: Average Compound Rate of Growth of GDP and HDI during the Previous Period
1 2 3 4 5 6 7
Continent GDP 1970-1992 GI 1970-1990 PGI 1970-1990 SGI 1970-1990 EGI 1970-1990 HDI 1975-1990
Asia 0.1087 0.0149 0.0227 0.0133 0.0100 0.0120
Africa 0.0941 0.0075 0.0196 -0.0029 0.0052 0.0136
Europe 0.1101 0.0107 0.0006 0.0180 0.0131 0.0033
North America 0.0746 0.0063 0.0082 0.0055 0.0072 0.0052
South America 0.0861 0.0085 0.0062 0.0062 0.0135 0.0059
Corr. R23 = .82*, R24 = .17, R25 = .62, R26 = .35, R37 = .26, R47 = .96**, R57 = -.53, R67 = -.63
Table-3C: Average Compound Rate of Growth of GDP and HDI during the Post Period
1 2 3 4 5 6 7
Continent GDP 1992-2008 GI 1990-2007 PGI 1990-2007 SGI 1990-2007 EGI 1990-2007 HDI 1990-2005 Asia 0.0604 0.0252 0.0222 0.0342 0.0271 0.0209
Africa 0.0353 0.0197 0.0220 0.0194 0.0228 0.0162
Europe 0.0804 0.0117 0.0109 0.0133 0.0112 0.0071
North America 0.0539 0.0180 0.0145 0.0149 0.0233 0.0105
South America 0.0835 0.0212 0.0208 0.0265 0.0196 0.0105
Corr. R23 = -.28, R24 = -.38, R25 = .07, R26 = -.60, R37 = .84*, R47 = .80*, R57 = .77, R67 = .84*
Table-4A: CV of Growth of GDP and HDI during the Whole Period
1 2 3 4 5 6 7
Continent GDP 1970-2008 GI 1970-2007 PGI 1970-2007 SGI 1970-2007 EGI 1970-2007 HDI 1975-2005 Asia 38.71 39.80 44.99 54.26 55.04 42.72
Africa 42.01 40.45 43.44 98.62 73.72 61.89
Europe 21.024 30.503 116.320 27.789 35.307 16.904
North America 52.463 37.278 67.762 61.886 42.835 54.013
South America 14.810 28.906 57.442 36.909 35.487 37.579
Corr. R23 = .85*, R24 = -.40, R25 = .69, R26 = .55, R37 = .75, R47 = -.81*, R57 = .90**, R67 = .74
Table-4B: CV of Growth of GDP and HDI during the Previous Period
1 2 3 4 5 6 7
GDP 1970-1992 GI 1970-1990 PGI 1970-1990 SGI 1970-1990 EGI 1970-1990 HDI 1975-1990 Asia 42.73 69.32 83.99 110.03 136.46 47.77
Africa 36.61 68.84 60.27 -166.63 249.70 23.45
Europe 10.863 38.580 1384.652 37.293 54.500 27.171
North America 26.391 58.690 182.421 166.218 66.623 63.958
South America 22.271 51.243 133.716 125.470 55.728 41.522
Corr. R23 = .98**, R24 = -.80*, R25 = -.21, R26 = .70, R37 = .20, R47 = -.40, R57 = .82*, R67 = -.46
Table-4C: CV of Growth of GDP and HDI during the Post Period
Continent GDP 1992-2008 GI 1990-2007 PGI 1990-2007 SGI 1990-2007 EGI 1990-2007 HDI 1990-2005
1 2 3 4 5 6 7
Asia 126.04 38.39 47.92 65.46 63.05 42.94
Africa 212.00 50.33 89.47 76.83 83.78 61.95
Europe 68.124 60.293 74.697 68.216 82.159 16.937
North America 139.602 56.855 91.876 68.001 53.882 54.160
South America 33.755 35.952 57.550 54.323 49.295 43.745
18 The overall impact of globalisation on the economic growth and human development
is robust. Table 3a shows that though overall globalisation especially social and economic
globalisation is positively correlated with overall human development index (HDI); political
globalisation is negatively correlated with HDI. During the pre-globalisation phase,
continents had better overall globalisation and strong in political globalisation recorded better
economic growth and also human development. But in the post-globalisation phase the
impacts in overall sense weakened though some positive impact on human development is
observed (Table 3b & 3c). Continents having more inter-country variability in globalisation
recorded significantly positive variation in economic growth and that is more significant in
case of effect of variability in social globalisation on human development across the
countries. On the other hand, variation in political globalisation is inversely connected with
the human development (Table 4a). All these correlations were highly significant in the
pre-globalisation period (Table 4b) while they became weaker in the post-pre-globalisation phase
(after 1990s). However, positive correlation between the variation in social globalisation and
economic growth became stronger in the post 1990 phase. Though correlation between social
globalisation and human development index was strong in the earlier period, it became weak
in the post 1990 phase. It indicates that in the previous period, social globalisation was
having more impact on non-economic human development factors that is education and
health indicators and in the later phase though it has accelerated the growth process that has
not been reflected in the human development indicators.
Conclusion:
In this paper we have tried to examine whether and to what extent nations within the
continents are co-integrated in regard to their move towards globalisation over time. It should
be noted that all the nations within each continent are not considered here due to data
limitations, but the data sets available and used here are sufficient to draw conclusions. The
results suggest the presence of co-integration among the selected nations despite the fact that
the European nations are more co-integrated than the other continents. It is followed by the
countries in Africa and Asia. Looking at the characteristics of the selected nations of various
continents, it is apparent that Socio-political, demographic and cultural
homogeneity/heterogeneity, differences in economic and technological advancement play
important roles in the choice of globalisation path (timing and speed) of various nations and
19 nations of various continents on the glove. In case of coefficient of variation and its change
over time, Europe is far ahead of the other continents.
The proximity matrices of overall globalisation and political globalisation provided
some important indications that geographical proximity, economic necessities, cultural and
political understanding play crucial role in determining the clusters of countries in terms of
globalisation or choice of the countries to open with other nations for trade, cultural exchange
etc. The continent that recorded less variability and more openness are found to progress
faster, though the relationship of various globalisation components with the economic and
human development indices are robust. Countries in each continent are found to converge
over time but there are the differences in the speed of convergence. The differences in the
coefficients indicate different level of convergence and the continents having high initial
coefficient of variation like Asia recorded faster convergence than the continents having less
initial inter-country variations like that of Europe. Overall, the convergence is observed
across the globe which indicates the nations with less initial value of globalisation indices are
opening at faster rate than the initially more globalised countries for various social and
economic interests.
References:
Amavilah, VH (2009a), “National Identity, Globalization, and the Well-being of Nations”, MPRA paper No. 14948.
Available at http://mpra.ub.uni-muenchen.de/14948/1/MPRA_paper_14948.pdf.
Amavilah, VH (2009b), “National Symbols, Globalization, and the Well-being of Nations”, Available at http://mpra.ub.uni-muenchen.de/14882/1/MPRA_paper_14882.pdf.
Antweiler, W., Copeland, B. R., and Taylor, M. S. (2001), “Is Free Trade Good for the Environment?”, American Economic Review, 91(4): 877–908.
Barro, R.J. (1991), “Economic Growth in a Cross-Section of Countries”, Quarterly Journal of Economics, 106: 407–43.
Barro, R.J. and Sala-i-Martin, X. (1992), “Convergence”, Journal of Political Economy, 100: 223–51.
Baumol, W.J. (1986), “Productivity Growth, Convergence and Welfare: What the Long-run Data Show”, American Economic Review, 76: 1072–85.
Beams, Nick (2000, June), “Globalisation: The Socialist Perspective”,Downloaded from http://www.wsws.org/articles/2000/jun2000/lec1-j05.shtml (accessed on 12-12-2010).
20 Bernard, A. and Durlauf, S. (1996), “Interpreting Tests of the Convergence Hypothesis”,
Journal of Econometrics, 71: 161–74.
Cherni J. A. (2001), “Globalisation and Environmental Sustainability in Cities of Developed and Developing Countries” Revista Theomai (edicion electronic), numero 4, Universidad Nacional de Quilmes, Argentina.
Choi, I. and Ahn, B.C. (1998), “Testing the Null of Stationarity for Multiple Time Series”,
Journal of Econometrics, 88: 41–77.
Cole, M. A. (2004), “Trade, the Pollution Haven Hypothesis and the Environmental Kuznets Curve: Examining the linkages”, Ecological Economics, 48:71–81.
De, U.K. and Pal, M. (2011), “Dimensions of Globalization and their Effects on Economic Growth and Human Development Index”, Asian Economic and Financial Review, 1(1): 1-13.
DeLong, J.B. (1988), “Productivity Growth, Convergence, and Welfare: Comment”,
American Economic Review, 78: 1138–54.
Dickey, D. and Fuller, W. (1979), “Distribution of the Estimators for Autoregressive Time Series with a Unit Root”, Journal of the American Statistical Association, 74: 427–31.
Dreher, A. (2006). “Does Globalization Affect Growth? Evidence from a New Index of Globalization”. Applied Economics, 38(1): 1091–1110.
Durlauf, S. and Quah, D. (1999). ‘The New Empirics of Economic Growth’, in J.B. Taylor and M. Woodford (eds), Handbook of Macroeconomics, North- Holland Elsevier Science, Amsterdam, 231–304.
Effland, A., Normile, MA., Roberts, D., Wainio, J. (2006), “World Trade Organization and Globalization Help Facilitate Growth in Agricultural Trade” Downloaded from
http://www.ers.usda.gov/AmberWaves/June08/Features/WTO.htm (accessed on 12-12-2010).
Engle, R.F, Granger, C.W. (1987), “Co-integration and Error Correction: Representation, Estimation and Testing”, Econometrica, 55: 251–276.
Evans, P. (1997), “How Fast Do Economies Converge?’, Review of Economics and Statistics, 79: 219–25.
Eweje, G. (2005), Lecture notes: Globalisation & Anti-Globalisation Movements, Topics in International Business, Lecture 2. Albany, Massey University.
Heintz, James (2006), “Globalization, Economic Policy and Employment: Poverty and Gender Implications”, Employment Strategy Papers, Geneva International Labour Office, 2006.
21 Johansen, S. (1988), “Statistical Analysis of Cointegration Vectors”, Journal of Economic Dynamics and Control, 12: 231-254.
Kulkarni, Kishore G. (2005), “Effect of Globalization on India’s Economic Growth”, presented in the Oxford Roundtable Conference held in Oxford University, UK, in July 2005.
Levin, A. and Lin, C.F. (1992). ‘Unit Root in Panel Data: Asymptotic and Finite Sample Properties’, Working Paper 92–63, Department of Economics, University of California, San Diego.
Levin, A. and Lin, C.F. (1993), “Unit Root Tests in Panel Data: New Results”, Working Paper 93–56, Department of Economics, University of California, San Diego.
Li, Q. and Papell, D. (1999), “Convergence of International Output: Time Series Evidence for 16 OECD countries’, International Review of Economics and Finance, 8: 267–80.
Mankiw, G., Romer, D., and Weil, D. (1992). ‘A Contribution to the Empirics of Economic Growth’, Quarterly Journal of Economics, 107: 407–37.
Quah, D. (1992), “International Patterns of Growth: I. Persistence in Cross-Country Disparities”, Working Paper, London School of Economics, October.
Quah, D. (1993), “Galton’s Fallacy and Tests of the Convergence Hypothesis”, The Scandinavian Journal of Economics, 95: 427–43.
Quah, D. (1994), “Exploiting Cross-Section Variations for Unit Root Inference in Dynamic Data”, Economic Letters, 44, 9–19.
Sala-I-Martin, X. (1994), “Cross Sectional Regressions and the Empirics of Economic Growth”, European Economic Review, 38: 739-47.
Sala-i-Martin, X. (1995), “The Classical Approach to Convergence Analysis”, Discussion Paper no. 1254, CEPR, London.
Tang, Rong (2008), “Is the Common Good Improved by Economic Globalisation and the Activities of Multinational Corporations?”, International Journal of Business and Management, 3(1): 141-145.
Taylor, M. and Sarno, L. (1998), “The Behavior of Real Exchange Rates during the Post- Brettonwoods Period”, Journal of International Economics, 46: 281–312.
Versi, A. (2004), “The Human Face of Globalisation”, [Online] Available: Business Source Premier, ISSN:01413929, Massey University.
22
Appendix-1: Testing of Convergence of the Continents in terms of Inter-country Variability in Globalisation Index Over Time
Sample (adjusted): 1972 2007 Trend assumption: Linear deterministic trend
Unrestricted Cointegration Rank Test (Trace), Hypothesized Trace 0.05
No. of CE(s) Eigenvalue Statistic Critical Value Prob.**
None 0.776052 130.0795 95.75366* 0.0000
At most 1 0.594761 76.21117 69.81889* 0.0141
At most 2 0.417359 43.69318 47.85613 0.1166
At most 3 0.302533 24.24653 29.79707 0.1902
At most 4 0.268754 11.27571 15.49471 0.1951
At most 5 0.000209 0.007537 3.841466 0.9304
Trace test indicates 2 cointegrating eqn(s) at the 0.05 level
Unrestricted Cointegration Rank Test (Maximum Eigenvalue), Hypothesized Max-Eigen 0.05
No. of CE(s) Eigenvalue Statistic Critical Value Prob.**
None 0.7760 53.8683 40.0776* 0.0008
At most 1 0.5948 32.5180 33.5180 0.0719
At most 2 0.4174 19.4467 27.5843 0.3807
At most 3 0.3025 12.9708 21.1316 0.4549
At most 4 0.2688 11.2682 14.2646 0.1413
At most 5 0.00021 0.0075 3.8415 0.9304
Max-eigenvalue test indicates 1 cointegrating eqn(s) at the 0.05 level
Unrestricted Cointegrating Coefficients (normalized by b'*S11*b=I):
Asia Africa Europe North America South America Oceania -0.952912 0.152886 -0.045020 1.184383 -0.055702 -0.676364 -0.732616 -0.235926 1.394487 -0.832391 1.132443 0.716793 0.179888 -0.536305 0.918485 -0.826114 0.096673 0.280253 -0.530755 -0.797162 -0.300921 0.383884 0.991910 -0.504235 0.205878 -0.492168 -0.071849 0.226619 -1.080784 0.111492 -0.369610 0.102385 -0.072080 -0.124086 0.850050 -0.564012
Unrestricted Adjustment Coefficients (alpha):
D(ASIA) 0.528054 -0.024094 0.195445 -0.100540 0.058588 -0.010202 D(AFRICA) -0.272354 0.053864 0.381557 0.174454 0.262912 -0.003214 D(EUROPE) -0.202343 -0.181877 0.126605 -0.180760 0.087753 -0.003408 D(North America 0.023472 -0.065392 0.494345 -0.026704 -0.064442 -0.001331 D(South America 0.543527 -0.186538 0.045349 -0.111896 0.225508 0.002088 D(OCEANIA) 0.111590 -0.605237 0.134528 0.483687 -0.082391 0.001682
1 Cointegrating Equation(s): Log likelihood -226.9959
23
Appendix-2: Test of Trend Stationarity of overall Globalisation among the Selected Countries across the Continents using Augmented Dickey-Fuller Test
Asia Africa
Level Form First Difference Level Form First Difference
Country Coeff. Coeff. Country Coeff. Coeff.
Bangladesh .0357 1.717 -1.0534 -6.167 Algeria -.0492 -.820 -1.275 -7.265
China .0109 .9897 -1.004 -5.856 Botswana -.1202 -1.609 -1.159 -6.602
India .0377 2.0609 -.8071 -4.806 Cameroon -.0629 -.875 -1.285 -7.764
Indonesia -.0032 -.1173 -.9334 -5.4569 Congo, Rep. -.1804 -2.180 -1.342 -7.925 Iran, Islamic Rep. -.0647 -.9584 -.7814 -4.6017 Ghana -.0097 .288 -.990 -5.780
Israel* -.1126 -2.80 -.4450* -4.762* Lesotho -.123 -1.761 -1.108 -6.314
Japan .0066 .2331 -1.706 -5.015 Mauritania -.0193 -.244 -1.277 -7.674
Korea, Rep. .0008 .0461 -.8715 -5.123 Morocco .0892 1.699 -.699 -4.277
Malaysia .0475 1.6550 -2.1287 -4.774 Nigeria .0022 .0771 -.916 -5.331
Nepal -.0304 -.6443 -1.297 -5.080 Senegal -.0549 -.945 -1.234 -7.366
Oman -.0097 -.2069 -1.092 -6.334 South Africa .0298 1.010 -.728 -4.433
Pakistan .0302 1.4555 -.9609 -5.647 Togo -.0436 -.638 -1.204 -6.341
Philippines -.0091 -.3625 -.9560 -5.525 Tunisia .0060 .232 -1.013 -5.915
Singapore -.0597 -2.111 -.7241 -4.392 Zimbabwe -.0076 -.250 -.747 -4.458
Sri Lanka .0212 .6849 -1.0813 -6.336
Syrian Arab Rep. .0133 .4174 -1.0835 -6.338 North America
Thailand .0157 .9870 -.9384 -5.459 Level Form First Difference
Turkey -.0112 -.3675 -1.232 -7.385 Country Coeff. Coeff.
Canada -.0497 -1.549 -.744 -4.488
Europe Costa Rica .0098 .3294 -1.133 -6.624 Level Form First Difference Dominican Rep. .0509 1.442 -.834 -4.941
Country Coeff. Coeff. Guatemala .0174 .4142 -1.20 -7.143
Austria -.0299 -1.163 -1.058 -6.164 Honduras .0288 1.273 -.6307 -3.963
Belgium -.0179 -1.0358 -.7738 -4.662 Jamaica -.0691 -1.025 -1.294 -7.888
Denmark -.0132 -.4129 -1.098 -6.412 Nicaragua .0236 .8005 -.9515 -5.557
Finland -.0034 -.1574 -.8539 -5.044 Panama -.0788 -1.007 -1.012 -5.908
France -.0126 -.6915 -.8770 -5.183 Trinidad & Toba. -.0359 -.8049 -.7227 -4.385 Greece -.0077 -.2394 -.8896 -5.224 United States -.0201 -.779 -.9802 -5.733 Hungary -.0079 -.402 -.4545 -2.222**
Ireland -.0284 -1.072 -.7286 -4.416
Italy .0087 .4945 -.6968 -2.331** South America
Netherlands -.0687 -2.550 -.6952 -4.250 Level Form First Difference
Norway -.0423 -1.510 -1.242 -7.490 Country Coeff. Coeff.
Portugal .0126 .557 -.713 -4.342 Argentina -.0122 -.475 -.5336 -2.457
Spain -.0101 -.637 -.6455 -4.040 Bolivia -.0302 -.6894 -.8328 -4.798
Sweden -.0434 -1.849 -1.129 -6.590 Brazil .0007 .0306 -.8915 -5.222
Switzerland -.0547 -2.07 -1.104 -6.479 Chile .0126 .6432 -.8359 -4.935
UK -.0503 -1.904 -1.175 -6.966 Colombia .0059 .1783 -1.231 -7.394
Ecuador -.0064 -.183 -1.264 -6.600
Oceania Guyana -.0449 -.920 -5.512
Level Form First Difference Paraguay .0172 -.9534 -5.711
Country Coeff. Coeff. Peru .0205 .5804 -1.027 -5.993
Australia .0045 .1026 -1.373 -8.637 Uruguay .0111 .3374 -.9763 -5.656
Fiji -.644 -3.845 -1.697 -6.358 Venezuela, RB -.0369 -1.221 -.910 -5.224 New Zealand -.0247 -.5544 -1.407 -8.873 Critical value
Papua New Guinea -.145 -1.053 -1.359 -4.70 At 1% -3.621 -3.627
Vanuatu -.135 -1.676 -1.322 -7.734 At 5% -2.943 -2.946
Notes: 1. * indicates that the coefficient is significant at 1% level of significance, while ** indicates that the coefficient is significant at 10% level of significant.