Journal of Chemical and Pharmaceutical Research, 2014, 6(5):1888-1895
Research Article
CODEN(USA) : JCPRC5
ISSN : 0975-7384
University gymnastics teaching quality comprehensive evaluation model
research based on principal component analysis
Juan Wang
Sports Academy, Chuzhou University, Chuzhou, Anhui, China
_____________________________________________________________________________________________
ABSTRACT
University’s traditional gymnastics teaching pattern has already been lagged far behind that cannot adapt the demand of social development. On the basis of researching university gymnastics teaching development influence factors, the paper establishes two mathematical model, firstly utilizes principal component analysis to discuss scientific university teaching comprehensive evaluation indicator, and then based on that, it carries out three layers indicators fuzzy evaluation on collected objects with collected lots of data, finally uses normalization method to get results for the purpose of propelling to gymnastics widely spreading and developing in university. By principal component analysis, it gets a comprehensive evaluation value with students scores as objective evidence, and combines with above obtained fuzzy comprehensive evaluation scores, it gets the two weights, the result is a more objective final comprehensive evaluation value, from which the value’s size reflects in gymnastics teachers’ teaching levels, the value gets bigger that reflects teaching levels get higher.
Key words: gymnastics, teaching quality, principal component analysis, comprehensive evaluation, physiological indicator
_____________________________________________________________________________________________
INTRODUCTION
Gymnastics comes from ancient Greek language; its Italian is “the naked technique”, because they at that time all stark naked carry on the drill, latter by European and American countries use. China calls it as “gymnastics”. Its definitions and contents have differences with era changing. “Gymnastics” is the general term of all gymnastics events. According to purpose and tasks, gymnastics can be divided into basic gymnastics and competitive gymnastics two major kinds [1-5]. Basic gymnastics refers to one kind of gymnastics that its movement and technique is relative simple, its main purpose, task is to fortify one’s health and cultivate good body shape, the main objects that it faces to are the broad masses, the most common ones are radio gymnastics and fitness gymnastics to prevent and cure each king of occupational diseases [6-9]. And competitive gymnastics, literally it refers to one kind of gymnastics with the purpose of striving for victory, getting excellent results, fighting for medals on the field [10-12]. The kind of gymnastics has big movement difficulty, complex techniques with certain risk, it is mainly athletes go in for the kind of gymnastics training. Gymnastics is Chinese university sports traditional teaching subject; it plays important roles in promoting students’ physical development and improving its sports technology aspects. But, with Chinese university sports educational reform development, traditional gymnastics teaching system already cannot adapt the demand of social development, its teaching ideas lagging, teaching ways and methods dullness, stiffness, teaching contents old-fashioned, teaching test ways singleness and other factors, which cause serious effects on students’ gymnastics learning interestingness, learning efficiency and gymnastics learning values embodiment as well as multiple aspects and let gymnastics teaching in university suffer larger degree constraints [8].
try to comprehensive estimate on teaching, the paper selects proper gymnastics teaching indicators, because too many indicators will lead to complex operation and information overlapping interference, and finally cannot achieve purposes. The paper selected fewer and uncorrelated indicators from them to replace many quantities and correlated indicators, and meanwhile it can reflect original indicators information. Reality evaluation way on gymnastic teachers’ teaching abilities is ultimate estimation, that is to say; only consider evaluating teachers by performance, in this evaluation way, how to analyze students’ final results so that can relatively objective reflect teachers’ teaching. The paper considers absolute indicators and relative indicators that reflect students’ gymnastics technology levels. For these defined indicators, it makes principal component analysis so that define teachers’ teaching comprehensive evaluation value. When making teaching evaluation on teachers, except for considering students’ final results, it will also consider other data. Therefore, by questionnaire, the paper gets some relative teachers’ evaluation indicators, which is divided into main factors and sub factors. Due to quantitative analyze evaluation of these indicators is not easy, which means it has fuzziness, therefore the paper establishes comprehensive evaluation model by multiple layer fuzzy comprehensive evaluation method.
GYMNASTICS TEACHING COMPREHENSIVE EVALUATION INDICATOR SYSTEM Principal component analysis theory
Principal component analysis is a kind of statistical analysis method that converts original multiple variables into fewer comprehensive indicators, from the perspective of mathematics; it is a kind of dimension reduction process technique. Assume that it exists
n
pieces of geographical samples, every sample totally hasp
pieces of variables description, in this way it constructs an
×
p
order geographic data array:
=
np n
n
p p
x x
x
M M
M
x x
x
x x
x
X
2 1
2 22
21
1 12
11
Then how to analyze geographic things internal regularity from numerous variables data? To get the answer, obviously it should investigate in
p
dimensional space; the method is surely quite troublesome. To solve the difficulty, it should go through dimension reduction processing, that is to say, use fewer comprehensive indicators to replace original many indicators. In this way, it can ensure fewer comprehensive indicators can reflect original more indicators reflected information; meanwhile indicators are mutual independent from each other. However, for the kind of comprehensive indicators (that are new variables), how to get them? It is well known that most simple form is using original indicators linear combinations, by proper changing combination coefficient; it ensures new indicators are mutual independent from each other and representative to be best.If record original variable indicator as
x
1,
x
2,
,
x
i, their comprehensive indicator –new variable indicator is)
(
,
21
x
z
m
p
x
m≤
. Then:
+ + + −
+ + + −
+ + + −
p mp m
m m
p p
p p
x l x
l x l z
x l x
l x l x
x l x
l x l x
2 2 1 1
2 2
22 1 21 2
1 2 12 1 11 1
1
z
isx
1,
x
2,
,
x
p the maximum variance in all linear combinations;z
2isx
1,
x
2,
,
x
p maximum variance inall linear combinations and uncorrelated to
z
1 ;z
misx
1,
x
2,
,
x
p maximum variance in all linear combinationsand uncorrelated to
z
1,
z
2,
z
m−1.Based on above selected new indicators
z
1,
z
2,
,
z
m are original indicatorsx
1,
x
2,
,
x
pfirst, second…、 m_____________________________________________________________________________
Based on above analysis, it is clear that principal components achieving is to define original indicator
) , , 2 , 1
(j p
xj = in principal component zi(i=1,2,,m) load1ij(i=1,2,,m;j=1,2,,p). They are respectively x1,x2,,xp
correlation matrix
m
pieces of larger feature values corresponding features vectors.System establishment
Input initial data all individuals’ data one by one into above each principal component linear combination formula, and then calculate and get all subjects principal component scores. Students’
n
time’s gymnastics testing results relative absolute indicators have: the teachers teaching class represented overall level average scores:c = n n
times tests total result times tests total participants
The teachers’ teaching class represented variation degree uses variance:
σ
= 1 2) ( 1
c c n
n i
i −
∑
=
Now we accept mass education, teachers’ one of important teaching task is to let student master basic knowledge, so teaching estimation should consider pass rate:
α
=n ntimes tests qualified number of people times tests total participants
Another indicator that represents university gymnastic teachers’ teaching abilities is excellent rate:
β
=n ntimes tests number of excellent people times tests total participants
Relative indicator:
Grade progress is beneficial to facilitate learning impetus improving; therefore progress rate
∑
−
=
= 1 1 n
i i
i
N
E
γ
is a kind of important indicator to evaluate university gymnastics teachers.
By principal component analysis of these five indicators, it can get objective gymnastics teachers teaching comprehensive evaluation value indicator
E
. The paper random selects one university’s four classes and respectively record them asA
,
B
,
C
,
D
. The four classes’ principal components are as following:
Progress rate: x1=(0.666667,0.454545455,0.675676,0.774194).
Pass rate: x2=(0.930555556,0.909090909,0.932432432,0.983870968).
Excellent rate: x3 =(0.152777778,0.227272727,0.135510511,0.24935484).
Average value: x4=(74.59722222,76.25,73.32432432,76.67741935).
Standard deviation: x5=(5.103538321,8.8705975,6.480966119,5.139267531).
Firstly, respectively solve evaluated gymnastics teachers’ classes
i
(i
=1, 2, 3, 4) thej
(j
=1, 2, 3, 4, 5) = =
5.1393 76.677 0.24194 0.98387 0.77419 6.481 73.324 0.13551 0.93243 0.67568 8.8706 76.25 0.22727 0.90909 0.45455 5.1035 74.597 0.15278 0.93056 0.66667 5 4 3 2 1x
x
x
x
x
T XSecondly, with an aim to get rid of indicators dimensions interference, by standardization processing, it gets standard
matrix
Z
, from whichZ
ij= (x
ij-x
i)/s
j. It further establishesx
iandx
j correlation matrixv
feature equation,and gets feature root(
λ
1,λ
2,λ
p), and by∑
=
i i iq
λ
λ
calculation, it gets contribution rate
q
i.Component analysis Feature root
λ
iContribution rate
q
i1 )
(x1 2.36259 0.47252
2 )
(x2 1.35642 0.27128
3 )
(x3 1.281 0.2562
4 )
(x4 0 0
5 )
(x5 0 0
And then, by orthogonal transformation Jacobi iteration method, calculate and get corresponding feature vector matrix as following:
0.20791 0.047567 3577 0.8 0.35776 0.35776 0.1975 0.75816 0.31631 0.47054 0.25441 0.64765 0.0092981 0.083372 0.16843 0.73834 0.64738 0.056332 0.065738 0.63211 0.41695 0.28146 0.64782 0.43607 0.47187 0.29714
Finally, by Matlab software, it calculates score matrix as:
0.75919 0.42562 0.73449 0.40092 1.0398 0.85307 0.0092437 0.17744 0.56674 0.33308 0.78723 0.11259 1.711 0.019943 0.065298 1.6257
By score matrix, it can calculate E(A)= -3.4219, E(B)= 1.1335, E(C)= 2.0796, E(D)= -1.5184. Based on above data, it can get: Class A is the worst, secondary is class D, the third is class B, the best is class C.
GYMNASTICS TEACHING QUALITY MULTIPLE HIERARCHY FUZZY COMPREHENSIVE EVALUATION MODELS
Multiple hierarchy fuzzy comprehensive evaluation theory
Set k layer component element domain of discourse U(k≥2), ( (1) (1))
2 ) 1 (
1 U Um
U
U= is first layer( top layer) m
pieces of elements, V =(v1 v2 vn) is its remark set, then multiple hierarchy fuzzy comprehensive evaluation
_____________________________________________________________________________
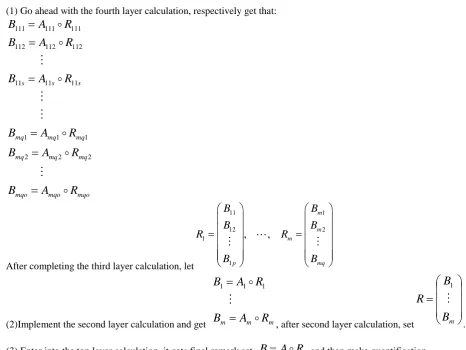
(1) Go ahead with the fourth layer calculation, respectively get that:
mqo mqo mqo
mq mq mq
mq mq mq
s s s
R
A
B
R
A
B
R
A
B
R
A
B
R
A
B
R
A
B
A
A
A
A
A
A
=
=
=
=
=
=
2 2 2
1 1 1
11 11 11
112 112 112
111 111 111
After completing the third layer calculation, let
11 1
12 2
1
1
,
,
m m m
p mq
B
B
B
B
R
R
B
B
=
=
(2)Implement the second layer calculation and get
B
mA
mR
mR
A
B
A
A
=
=
1 11
, after second layer calculation, set
=
m
B
B
R
1
.
(3) Enter into the top layer calculation, it gets final remark set
B
=
A
A
R
, and then make quantification.Model establishment
[image:5.595.66.533.67.417.2]Now common evaluation way is ultimate evaluation, that is to say, it uses results to evaluate gymnastics teachers. Then in the method, how to analyze students final results so that can objective reflect teachers’ teaching. The paper considers students’ gymnastics technology level represented absolute indicator and relative indicator. Make principal component analysis of defined indicators, and then it gets comprehensive evaluation values. If only consider using gymnastics course final results to evaluate, it causes indicators to be single, so the paper adds other indicators. Therefore, the paper puts forward gymnastics teachers’ evaluation’s other indicators (that are divided into main factors and sub factors). Due to make quantitative analysis of these indicators evaluation is not easy; that is to say, fuzzy data are too many, therefore the paper adopts multiple hierarchy fuzzy comprehensive evaluation method to establish model, as following Table 1.
Table 1: Gymnastics education teaching quality evaluation indicator system
The first layer The second layer( main factor) The third layer( sub factor)
T
ea
ch
in
g
q
u
ali
ty
Teaching attitude F1(0.2)
Classroom readiness degree F11(0.3) Classroom teaching records F12(0.3)
Work correction and after-school tutoring F13(0.4)
Teaching content F2(0.3)
Fulfill syllabus requirements F21(0.2)
Extracurricular materials and textbook combination F22(0.4) Classroom discussion implementing F23(0.4)
Teaching strategies and methods F3(0.2)
Students gymnastics interest stimulating F31(0.4) Gymnastics lecturing appropriateness F32(0.3)
Guide for differences, focus on teaching according to one’s aptitude F33(0.3)
Teaching efficiency F4(0.3)
Test results at ordinary time F41(0.4)
Gymnastics exchange and applying capacity F42(0.4) Classroom attendance rate and work hand in rate F43(0.2)
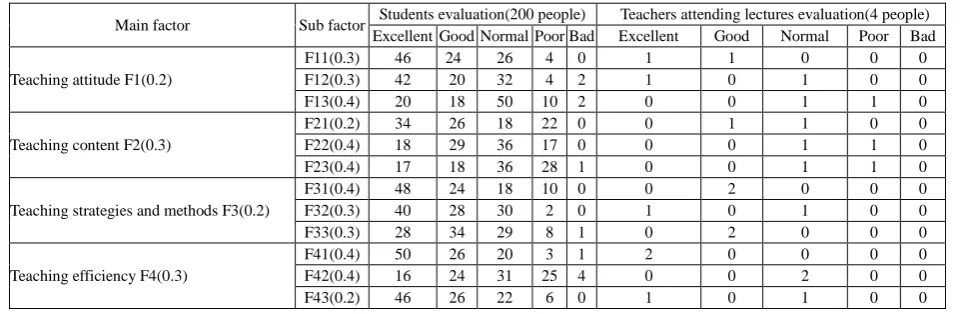
Table 2: Number of students and teachers attend lectures statistics according to grade evaluation on each indicator
Main factor Sub factor Students evaluation(200 people) Teachers attending lectures evaluation(4 people)
Excellent Good Normal Poor Bad Excellent Good Normal Poor Bad
Teaching attitude F1(0.2)
F11(0.3) 46 24 26 4 0 1 1 0 0 0
F12(0.3) 42 20 32 4 2 1 0 1 0 0
F13(0.4) 20 18 50 10 2 0 0 1 1 0
Teaching content F2(0.3)
F21(0.2) 34 26 18 22 0 0 1 1 0 0
F22(0.4) 18 29 36 17 0 0 0 1 1 0
F23(0.4) 17 18 36 28 1 0 0 1 1 0
Teaching strategies and methods F3(0.2)
F31(0.4) 48 24 18 10 0 0 2 0 0 0
F32(0.3) 40 28 30 2 0 1 0 1 0 0
F33(0.3) 28 34 29 8 1 0 2 0 0 0
Teaching efficiency F4(0.3)
F41(0.4) 50 26 20 3 1 2 0 0 0 0
F42(0.4) 16 24 31 25 4 0 0 2 0 0
F43(0.2) 46 26 22 6 0 1 0 1 0 0
Secondly, analyze collected objects to the third layer indicator’s fuzzy evaluation, as Table 3.
Table 3: 200 students to indicator F11 (lessons preparation full extent) fuzzy evaluation
Grade Excellent Good Normal Poor Bad
Number of people 46 24 26 4 0
Percentage 0.46 0.24 0.26 0.04 0.00
The evaluation result can use fuzzy set to record as R111= (0.46, 0.24, 0.26, 0.04, 0.00). Similarly, it can solve 200 students to indicator F12、F13 fuzzy evaluation fuzzy set:
R112=(0.42, 0.20, 0.32, 0.04, 0.02) R113=(0.20, 0.18, 0.50, 0.10, 0.02)
Thereupon, it gets students to indicator F1 single factor evaluation matrix: R11=
02 . 0 10 . 0 50 . 0 18 . 0 20 . 0
02 . 0 04 . 0 32 . 0 20 . 0 42 . 0
00 . 0 04 . 0 26 . 0 24 . 0 46 . 0
Then, analyze collected objects to the second layer indicator’s fuzzy evaluation. Teaching attitude F1 four indicators weights allocation is
F11(0.3)、F12(0.3)、F13(0.4), is can use fuzzy set to express as A11=(0.3, 0.3, 0.4). Thereupon, it gets 200 students to F1 comprehensive evaluation as:
B11’=(0.3, 0.3, 0.4).
02 . 0 10 . 0 50 . 0 18 . 0 20 . 0
02 . 0 04 . 0 32 . 0 20 . 0 42 . 0
00 . 0 04 . 0 26 . 0 24 . 0 46 . 0
=( 0.3440 0.2040 0.3740 0.0640 0.0140)
Normalize evaluation result B1’, by 0.3440+0.2040+0.3740+0.0640+ 0.0140=1, it gets:
B11=
1 0140 . 0 , 1 0640 . 0 , 1 3740 . 0 , 1 2040 . 0 , 1 3440 . 0
=( 0.3440 0.2040 0.3740 0.0640 0.0140)
The normalization result shows that in 200 students, 34.40% student’s evaluation on the teacher teaching attitude is “excellent”, 20.40% evaluation is “good”, 37.40% evaluation is “normal”, 6.40% evaluation is “poor”, and 1.40% evaluation is “bad”. Similarly, it can get the100 students to teaching content F2, teaching strategies and methods F3, teaching efficiency F4 comprehensive evaluation as:
_____________________________________________________________________________
= 0200 . 0 1240 . 0 2480 . 0 2520 . 0 3560 . 0 0030 . 0 0700 . 0 2490 . 0 2820 . 0 3960 . 0 004 . 0 224 . 0 324 . 0 24 . 0 208 . 0 0140 . 0 0640 . 0 3740 . 0 2040 . 0 3340 . 0 1 R So:B1=A1
A
R1=(0.2 0.3 0.2 0.3)A
0200 . 0 1240 . 0 2480 . 0 2520 . 0 3560 . 0 0030 . 0 0700 . 0 2490 . 0 2820 . 0 3960 . 0 004 . 0 224 . 0 324 . 0 24 . 0 208 . 0 0140 . 0 0640 . 0 3740 . 0 2040 . 0 3340 . 0
=(0.3172 0.2448 0.2962 0.1312 0.0106)
B1 is students to the teacher fuzzy comprehensive evaluation, it shows 31.72% student’s evaluation on the teacher is “excellent”, 24.48% evaluation is “good”, 29.28% evaluation is “normal”, 13.12% evaluation is “poor”, and 1.06% evaluation is “bad”. Similarly, it can get teachers attend lectures to the teacher fuzzy comprehensive evaluation result as:
B2=( 0.2400 0.2000 0.4000 0.1600 0.0000)
R1’=
0000 . 0 1600 . 0 4000 . 0 2000 . 0 2400 . 0 0210 . 0 1289 . 0 2928 . 0 2423 . 0 3150 . 0
SoR=
(
0.4 0.6)
AR'1=(0.2700 0.2169 0.3571 0.1476 0.0084)Now give scores to each remark:” Excellent”——90~100;“Good”——80~89;“normal”——70~79;
“poor”——60~69;“bad”——50~59. Therefore, the gymnastic teacher fuzzy comprehensive evaluation score is (all score sections respectively take middle value):
81.027 55 * 0.00424 65 * 0.14848 75 * 0.35848 85 * 0.21792 95 * 0.27088
G= + + + + =
It belongs to “good” grade.
If make evaluations on multiple gymnastics teachers, model one gets a comprehensive evaluation value with students scores as objective evidence by principal component analysis, then combines with above obtained fuzzy comprehensive evaluation scores, it gets the two weights, result is a more objective final comprehensive evaluation value, from which the value size reflects in gymnastics teachers’ teaching level, the value gets bigger, then it shows teaching level gets higher.
CONCLUSION
To gymnastics teaching comprehensive evaluation indicator system, the paper first gets class overall level representative average score, variation degree variance, students final test pass rate, gymnastics teacher’s teaching excellent rate and progress rate these five indicators. By principal component analysis of them, it gets objective gymnastics teacher teaching comprehensive evaluation value indicator; then test the model, and finally get comprehensive evaluation value. To gymnastics teaching quality multiple hierarchy fuzzy comprehensive evaluation model, the paper first get number of students and teachers attend lectures statistics data quantity according to grade evaluation, then by multiple hierarchy indicators fuzzy evaluation, it gets gymnastics teacher evaluate grade. The purpose is to propel to the event popularization in universities, and improve universities gymnastics teachers’ teaching abilities and levels.
REFERENCES
[1] Liu Qingqing. Sports Science Research, 1998, (1).
[2] Ding Dong-sheng. Fujian Sports Science and Technology, 2008, 27(1), 51-53.
[3] YANG Ji-ping, RAN Meng-hua. Journal of Physical Education Institute of Shanxi Teachers University,2003, 18(4), 47-49, 101.
[4] GUO Gai-ling. Journal of Physical Education Institute of Shanxi Teachers University, 2002, 17(4), 41-42. [5] LIU Jie, LIAO Hui-jun. Journal of Liuzhou Teachers College, 2005, 20(4), 84-85, 130.
[6] LI Xiu_hua, LIU Cheng, YANG Xiao_hong. Journal of Guangzhou Physical Education Institute, 2001, 21(4), 107-109.
[9] LIU Lin. Journal of Guangzhou Physical Education Institute, 2001, 21(4):110-112