Development and Validation of Stability Indicating
HPLC method for Determination of Eperisone
HCL in Bulk and in Formulation
Sanjay Patil1, Suvarna Vanjari 2, Rajendra Patil 3, Tushar Deshmukh4 1
TSSM’S Bhivarabai Sawant College of Engineering &Research, Narhe, Pune, SPPU 2
JSPM’S Rajashri Shahu College of Pharmacy &Research, Tathawade ,Pune, SPPU 3
JSPM’S Rajashri Shahu College of Pharmacy &Research, Tathawade ,Pune, SPPU 4
Hon’ble Loksevak Madhukarrao Chaudhari College of Pharmacy, Faizpur, North Maharashtra University, Jalgaon (M.S.)
Abstract:A new simple, accurate, precise and selective stability- indicating high performance liquid chromatographic (HPLC) method was developed and validated for estimation of Eperisone hydrochloride in bulk and in formulation. An isocratic HPLC method was developed and validated using NUCLEOSIL 100-5 C18 (250 x 4.6 mm, 5 µm) column and Methanol: Pot. Dihydrogen phosphate buffer pH 3 adjusted with o- phosphoric acid in the ratio of 70: 30 % v/v as mobile phase and detection is carried out at a wavelength of 257 nm. The retention time for drug was found to be 3.843 ± 0.006 min. The calibration curve was found to be linear between 5-30 µg/ml. The limit of detection and quantitation were found to be 0.146 µg/ml and 0.443 µg/ml. The proposed method was found to be accurate, precise, reproducible, specific and sensitive and applicable for the determination of Eperisone. The drug was subjected to stress condition of hydrolysis (acid, base and neutral), oxidation, photolysis and thermal degradation.
Keywords: Eperisone hydrochloride, HPLC, Stability.
I. INTRODUCTION
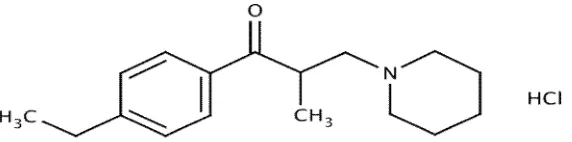
[image:2.612.166.452.500.571.2]This document is Eperisone hydrochloride (EPI), is chemically 2(RS)-1- (4-ethylphenyl)-2-methyl-3-(1-piperidyl)-propane-1-one (Figure 1) Eperisone is an antispasmodic drug. It acts by relaxing both skeletal muscles and vascular smooth muscles, and demonstrates a variety of effects such as reduction of myotonia, improvement of circulation, and suppression of the pain reflex.1
Figure 1: Structure of Eperisone HCl
II.EXPERIMENTAL
A. Reagents and Chemicals
Authentic sample of EPI was obtained from Inventia Healthe care Pvt. Ltd. East, Mumbai. The brand of Myosone 50; Macleods Pharmaceuticals Pvt Ltd, labeled to contain Eperisone HCl equivalent to 10 mg of Eperisone was procured form local market. Methanol (HPLC grade) was obtained from S. D. Fine Chem. Limited (Mumbai, India), HPLC grade water was collected at college using ELGA water purification system, potassium hydrogen phosphate, sodium hydroxide, o- phosphoric acid (all AR grade) were purchased from S. D. Fine Chem. Limited (Mumbai, India).
B. Chromatographic Condition
Chromatographic separation studies were carried out on the working standard solution of Eperisone (10µg/ml). Initially, trials were carried out using methanol and acetonitrile in various proportions along with buffer of varying pH, to obtain the desired system suitability parameters. After several trials, Methanol: Potassium Dihydrogen phosphate buffer pH 3 adjusted with o- phosphoric acid in the ratio of 70 : 30 % v/v was chosen as the mobile phase which shows good resolution and acceptable peak parameters at a flow rate of 1ml/min.
C .Selection of Detection Wavelength
[image:3.612.105.505.323.474.2]From the standard stock solution further dilutions were done using mobile phase and scanned over the range of 200 - 400 nm and the spectrum was obtained. It was observed that Eperisone HCl showed considerable absorbance at 257 nm (Figure 2).
Figure 2: UV Spectra of Eperisone (10 µg/ml)
III. STRESSDEGRADATIONSTUDIESOFBULKDRUG
Stress degradation studies were carried under condition of acid, base, neutral hydrolysis, oxidation, dry heat and photolysis. For each study, two samples were prepared (Blank and EPI). The blank subjected to stress in the same manner as the drug solution. Dry heat and photolytic degradation were carried out in solid state.
A. Alkaline hydrolysis
1 ml working standard solution of EPI (1000 µg/ml) was mixed with 1 ml of 1 N methanolic NaOH and 8 ml of Methanol. The solution was kept for 4 hrs at room temperature in dark place. The 1 ml of resulting solution was diluted with mobile phase to 10 ml (10 µg/ml) .
B. Acidic hydrolysis
ml working standard solution of EPI (1000 µg/ml) was mixed with 1 ml of methanolic 1 N HCl and 8 ml of methanol. The solution was kept for overnight in dark place. The 1 ml of resulting solution was diluted with mobile phase to 10 ml (10 µg/ml).
C. Neutral Hydrolysis
D. Oxidation
1 ml working standard solution of EPI (1000 µg/ml) was mixed with 1 ml of 30 % solution of H2O2 and 8 ml of methanol. The solution was kept for 2 hr in dark place. The 1 ml of resulting solution was diluted with mobile phase to 10 ml (10 µg/ml).
E. Degradation Under Dry Heat
Dry heat studies were performed by keeping drug sample in oven (800 C) for a period of 6 hrs. Sample was withdrawn and processed as per standard solution preparation procedure mentioned under 6.5 to get solution having concentration 100 µg/ml. The 1 ml of resulting solution was further diluted with mobile phase to 10 ml (10 µg/ml).
F. Photo-Degradation Studies
Photolytic studies were also carried out by exposure of drug to UV light up to 200 watt hours/square meter and subsequently to cool fluorescent light to achieve an illumination of 1.2 million Lux Hr. Sample was withdrawn after exposure and processed as per standard solution preparation procedure mentioned under 6.5 to get 100 µg/ml as solution concentration. The 1 ml of resulting solution was diluted with mobile phase to 10 ml (10 µg/ml) and then was injected.
IV.RESULTANDDISCUSSION
A. Optimization of Chromatographic Conditions
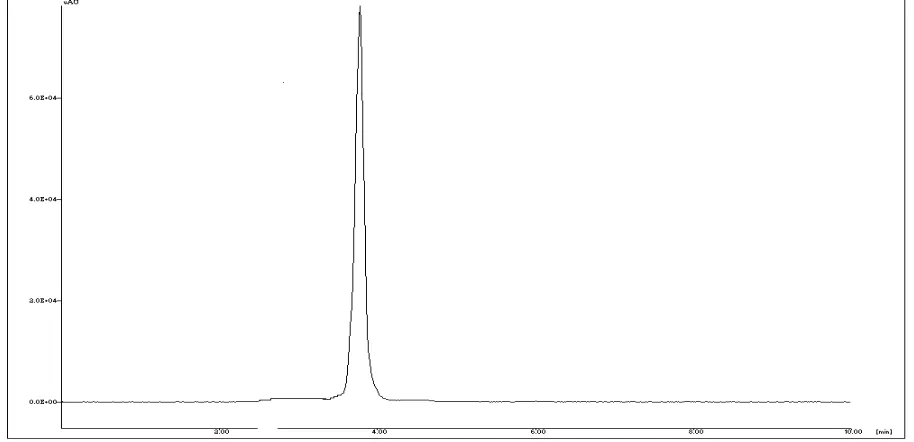
[image:4.612.75.532.364.585.2]The primary target in developing this stability indicating HPLC method is to achieve the resolution between EPI and its degradation products. To achieve the separation, we used a stationary phase C-18 column and mobile phase Methanol: Potassium Dihydrogen phosphate buffer pH 3 adjusted with o- phosphoric acid in the ratio of 70: 30 % v/v. The tailing factor obtained was less than two and retention time was 3.843 ± 0.006 min (Figure 3). Forced degradation study showed the method is highly specific and no degradation products were eluted at retention time of drug.
Figure 3 Chromatogram of Standard Eperisone HCl (10 µg/ml)
B. Result of Forced Degradation Studies
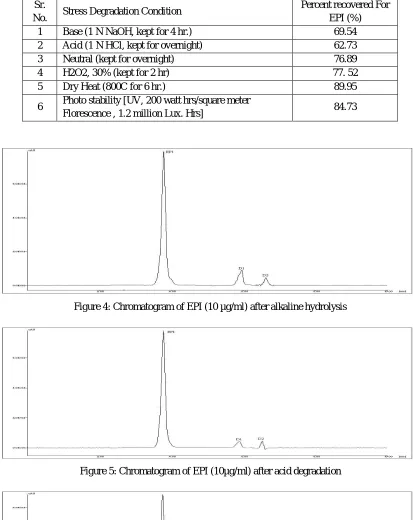
Degradation was observed for EPI during stress conditions like base, acid, oxidation dry heat and UV and Fluorescence. Summary of stress degradation results is given in Table 1. A well resolved peak was observed for product of alkali induced degradation (D1 and D2) at RT 5.91 and 6.58 mins. (Figure 4), products of acid induced degradation (D3 and D4) at RT 5.92 and 6.54 mins (Figure 5), products of neutral degradation (D5 and D6 ) at 2.52 and 3.04 mins (Figure 6) and product under dry heat condition (D7) at 2.51 respectively (Figure 7).
Table 1: Summary of stress degradation study of EPI RS Sr.
No. Stress Degradation Condition
Percent recovered For EPI (%)
1 Base (1 N NaOH, kept for 4 hr.) 69.54
2 Acid (1 N HCl, kept for overnight) 62.73
3 Neutral (kept for overnight) 76.89
4 H2O2, 30% (kept for 2 hr) 77. 52
5 Dry Heat (800C for 6 hr.) 89.95
6 Photo stability [UV, 200 watt hrs/square meter
Florescence , 1.2 million Lux. Hrs] 84.73
[image:5.612.96.509.92.612.2]Figure 4: Chromatogram of EPI (10 µg/ml) after alkaline hydrolysis
Figure 5: Chromatogram of EPI (10µg/ml) after acid degradation
Figure 7: Chromatogram of EPI (10µg/ml) after exposing dry heat
C. Method Validation
[image:6.612.128.487.284.444.2]From the standard stock solution (100 µg/ml) of Eperisone HCl further dilutions were made with mobile phase to obtain range of solution containing six different concentrations. Six replicates per concentration were injected. The linearity (relationship between peak area and concentration) was determined over the concentration range of 1-10 µg/ml.Figure 8).
Figure 8: Calibration curve for EPI
1) Precision: The precision of the method was demonstrated by Intra-day and Inter-day variation studies. In the Intra day studies, 3 replicates of 3 different concentrations (3, 4, 5 µg/ml) of EPI were analyzed in a day and percentage RSD was calculated. For the inter day variation studies, 3 replicates of different concentrations were analyzed on 3 consecutive days and percentage RSD were calculated. For intraday precision and inter-day precision, % RSD found to be 0.27 and 0.39 respectively.
2) Accuracy: To check accuracy of the method, recovery studies were carried out by adding standard drug to sample at three
different levels 50, 100 and 150 %. Basic concentration of sample chosen was 2 μg/ml of EPI from tablet solution. These
solutions were injected in stabilized chromatographic conditions in triplicate to obtain the chromatograms. The drug concentrations of EPI were calculated by using linearity equation. (Table 2).
Table 2: Recovery study of EPI
3) Specificity: The specificity of the method was ascertained by peak purity profiling studies. The peak purity values were found to be more than 996, indicating the no interference of any other peak of degradation product, impurity or matrix.
Level Amount added
(µg/ml)
Amount recovered (µg/ml)
% Recovery*
± SD Mean ± SD
50 % 1 4.94 99.57 ± 1.09
101.28 ± 1.55
100 % 2 10.52 102.60 ± 1.83
[image:6.612.53.539.576.677.2]4) Limit of detection (LOD) and limit of quantification (LOQ):LOD and LOQ were calculated as 3.3σ/S and 10σ/S, respectively; where σ is the standard deviation of the response (y-intercept) and S is the slope of the calibration plot. The LOD and LOQ were found to be 0.146 µg/ml and 0.443 µg/ml respectively.
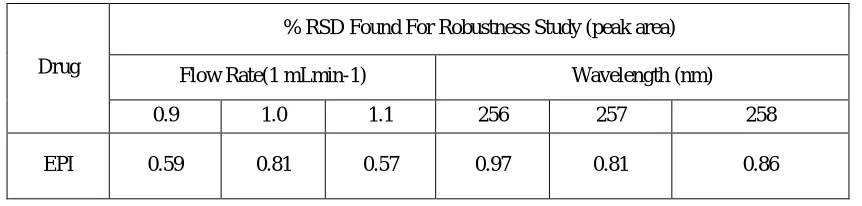
[image:7.612.92.523.167.270.2]5) Robustness: Robustness of the method was determined by carrying out the analysis under conditions during which flow rate, wavelengths were altered and the effects on the area were noted (Table 3)
Table 3: Robustness study
Drug
% RSD Found For Robustness Study (peak area)
Flow Rate(1 mLmin-1) Wavelength (nm)
0.9 1.0 1.1 256 257 258
EPI 0.59 0.81 0.57 0.97 0.81 0.86
V.CONCLUSIONS
The developed method is stability indicating and can be used for assessing the stability of drug in bulk drug and pharmaceutical dosage form. The developed method is specific, selective, robust, rugged and precise.
REFERENCES
[1] http://en.wikipedia.org/wiki/ Eperisone hydrochloride accessed in Feb. 2008.
[2] Patel P, Patel S, Patel U, “Spectrophotometric method for the simultaneous determination of diclofenac sodium and Eperisone hydrochloride in bulk and synthetic mixture ” ,International Research Journal of Pharmacy ,3(9),203-206,2012 .
[3] Suthar J, Patel P, Shah N ,“Development and validation of derivative spectrophotometric method for simultaneous estimation of Eperisone hydrochloride and Diclofenac sodium in combined capsule dosage form”, Novus International Journal of Chemistry , 1(1),24-32, 2012,
[4] Jain P, Girase D, Gawad J, “Development and validation of stability indicating TLC densitometric method for simultaneous determination of Eperisone hydrochloride and paracetamol in bulk tablet dosage form” Journal of Pharmaceutical and Scientific Innovation, 2 (4), 93-97, 2013.
[5] Alagar R , Godavari S, Selva Kumar, “Analytical method development & validation of Eperisone Hydrochloride and Diclofenac Sodium in Rapisone DSR Capsules by RP-HPLC” Journal of Advanced Pharmacy Education & Research , 3 (2),61-66, 2013.
[6] Patel S, Patel P, Patel J and Patel U, “Spectrophotometric estimation of Eperisone hydrochloride and Diclofenac Sodium in synthetic mixture by Q-absorbance ratio method ” , American Journal of Pharm Tech Research 3(1) , 398-403 ,2013.
[7] Patel P, Prajapati A, “ Spectrophotometric determination of Eperisone hydrochloride and Lornoxicam In Synthetic Mixture ” International Journal of PharmTech Research ,5 (2) 398 -403 ,2013
[8] Harde M, Zinjad P, Chaudhari P, “ Development and validation of UV-Visible spectrophotometric methods for simultaneous estimation of Eperisone hydrochloride and diclofenac sodium in bulk and capsule dosage form ” International Journal of Universal Pharmacy and Life Sciences ,3(3) 21-29 ,2013 . [9] Pagar V, Mulgund S, “Development and Validation of a stability indicating HPTLC method for determination of eperisone hydrochloride in bulk drug”