FOR THE SIZING OF DG IN DISTRIBUTION
SYSTEM
SITI NOR BAIZURA ZAWAWI
ELECTRICAL ENERGY AND INDUSTRIAL
ELECTRONIC SYSTEMS
EEIES 2009
7-8 DECEMBER 2009
A Study on Optimization Techniques for the
Sizing of DG in Distribution System
Siti Rafidah Abdul Rahim*, Syahrul Ashikin Azmi*, M o h d H e r w a n Sulaiman*, M u h a m a d Hatta Hussain , Siti Nor Baizura Zawawi"^.
* Universiti Malaysia Perlis/School of Electrical systems Engineering, Kangar, Pedis. Email: rafidahfaiunimap.edu.mv , ashikin(@,unimap.edu.mv, mherwanffilunimap.edu.my. muhdhatta@,unimap.edu.my
** Universiti Tun Hussein Onn Malaysia/ Faculty of Electrical and Electronic Engineering, Batu Pahat, Johor. Email: baizura engfgvahoo.com.
Abstract—Recent changes in the electric utility
infrastructure created the opportunities for many technological innovations including the application of DG in order to achieve a variety of benefits. To achieve the benefits, factors such as the capacity of the units and the best location have to be considered. This problem was addressed in this study by the development of the techniques to optimize the output of the DG in order to obtain maximum benefits from its installation. The proposed technique was capable to effectively improve the system performance in terms of system losses. This paper presents the comparative study on the performance of the optimization techniques for determining the optimal sizing of DG using Evolutionary Programming and Artificial Immune System. The proposed technique was tested on IEEE Reliability Test systems namely the IEEE 69-bus and the program was developed using the MATLAB programming software.
Keywords — Distributed generator; Evolutionary
programming (EP); Artificial Immune System
I. INTRODUCTION
The terms of DG implies the use of any modular technology that is sited throughout a utility service area or interconnected to the distribution or sub-transmission system to lower the cost of service. DGs are normally small generating sets, connected to the grid or feeding power islands, based on technologies such as internal combustion engines, small and micro gas turbines, fuel cells, photovoltaic and wind plants [1, 2, and 3]. The introduction of DG on the distribution network can significantly impact to the flow of power, voltage conditions and power quality at customers and utility equipment [4].
The increase in penetration of distributed generation in distribution network requires the system engineers to properly plan the implementation of DG. Determining the suitable location and sizing of a distributed generator is important in order to ensure for maximum benefits to be obtained from the implementation of DG. The great attention should be considered in determining the allocation and sizing of DG since non-optimal places and sizing of DG can result in an increase in the system losses. This paper presents the comparative study on the
performance of the optimization techniques in order to determine the optimal sizing of DG using EP and AIS.
II. METHODOLOGY
The optimal size of the distributed generator is determined by having the kW output (Pg) of the
distributed generator as the variable to be optimized. The kVar output of the distributed generator was determined using (2) and the power factor of the system was set to be 0.85.
Xi = Pg (1)
Q
g= P
g*tan'd (2)
c o s
0 =
0 . 8 59 = Power factor angle
The operation of the distributed generator is considered to be at steady state and therefore, the distributed generator is modelled as injected active and reactive power, Pg and Qg respectively [5]. The number of
variables depends on the number of distributed generators or compensating capacitor to be installed in the systems.
A. Sblutionary fbgramming
Evolutionary Programming originally was conceived by Lawrence J. Fogel in 1960 as an alternative approach to artificial intelligence [6]. Evolutionary Programming (EP) has been employed in the field of design search and optimization more thoroughly after the exposure from Fogel [7] when it was first implemented in the prediction of finite states machines. EP has been applied for a variety of power engineering problems, e.g. optimal distribution system planning [8], operation optimization [6] and distribution network reconfiguration [9, 10].
B. Artificial bimune System
The Artificial Immune System (AIS) is a new Computational Intelligence (CI) approach that is inspired in the vertebrate immune system and has produced efficient computational tools for solving problems [11]. Figure 2 shows the flowchart of project methodology for implementation of AIS. The mutation process implemented based on (3).
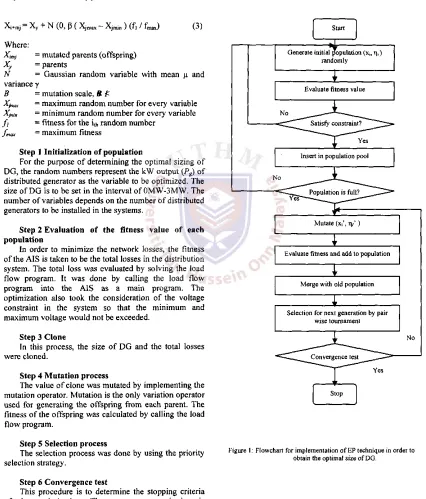
Xi + m j = Xy + N (0, p ( Xj m a x - Xj m i„ ) (f, / f ^ J (3)
Where:
= mutated parents (offspring) Xy = parents
N = Gaussian random variable with mean u and variance y
B = mutation scale, S £
Xjna = maximum random number for every variable Xj„i„ = minimum random number for every variable fi = fitness for the in, random number
/max = maximum fitness
Step 1 Initialization of population
For the purpose of determining the optimal sizing of DG, the random numbers represent the kW output (Pg) of distributed generator as the variable to be optimized. The size of DG is to be set in the interval of 0MW-3MW. The number of variables depends on the number of distributed generators to be installed in the systems.
Step 2 Evaluation of the fitness value of each population
In order to minimize the network losses, the fitness of the AIS is taken to be the total losses in the distribution system. The total loss was evaluated by solving the load flow program. It was done by calling the load flow program into the AIS as a main program. The optimization also took the consideration of the voltage constraint in the system so that the minimum and maximum voltage would not be exceeded.
Step 3 Clone
In this process, the size of DG and the total losses were cloned.
Step 4 Mutation process
The value of clone was mutated by implementing the mutation operator. Mutation is the only variation operator used for generating the offspring from each parent. The fitness of the offspring was calculated by calling the load flow program.
Step 5 Selection process
The selection process was done by using the priority selection strategy.
Step 6 Convergence test
This procedure is to determine the stopping criteria of the optimization. The convergence criterion is
specified by the difference between the maximum and minimum fitness to be less than 0.0001. If the convergence condition is not satisfied, the processes will be repeated.
maimum flmess-minimum f,mess< 0.0001 (4)
Start
Generate initial population ( X j , n i )
randomly
Evaluate fitness value
Insert in population pool
Mutate (Xj\ n/ ) Evaluate fitness and add to population
t
Merge with old population
*
Selection for next generation by pair wise tournament
No
Stop
[image:3.594.82.508.196.695.2]Start
4 — Generate initial population (x;)
randomly
Evaluate fitness value
Insert in population pool
Clone (xO
Mutate (Xi')
I
Evaluate fitness and add to population
I
Selection for next generation
No
Stop
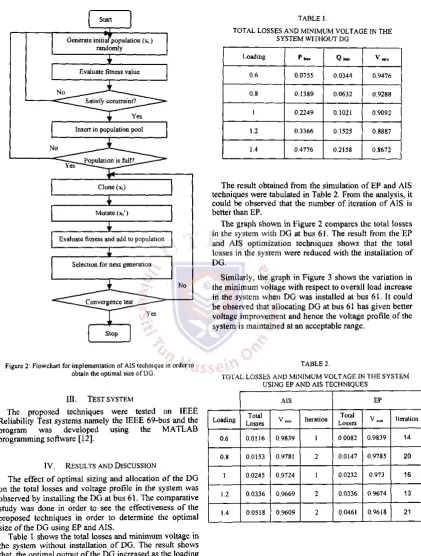
Figure 2: Flowchart for implementation of AIS technique in order to obtain the optimal size of DG.
III. TEST SYSTEM
The proposed techniques were tested on IEEE Reliability Test systems namely the IEEE 69-bus and the program was developed using the MATLAB programming software [ 1 2 ] .
IV. RESULTS AND DISCUSSION
The effect of optimal sizing and allocation of the D G on the total losses and voltage profile in the system was observed by installing the D G at bus 6 1 . The comparative study was done in order to see the effectiveness of the proposed techniques in order to determine the optimal size of the D G using EP and AIS.
Table 1 shows the total losses and minimum voltage in the system without installation of D G . The result shows that, the optimal output of the D G increased as the loading at a load bus was incremented.
TABLE 1.
TOTAL LOSSES AND MINIMUM VOLTAGE IN THE SYSTEM WITHOUT DG
Loading P lots V rain
0.6 0.0755 0.0344 0.9476
0.8 0.1389 0.0632 0.9288
1 0.2249 0.1021 0.9092
1.2 0.3366 0.1525 0.8887
1.4 0.4776 0.2158 0.8672
The result obtained from the simulation of EP and AIS techniques were tabulated in Table 2 . From the analysis, it could be observed that the number of iteration of AIS is better than EP.
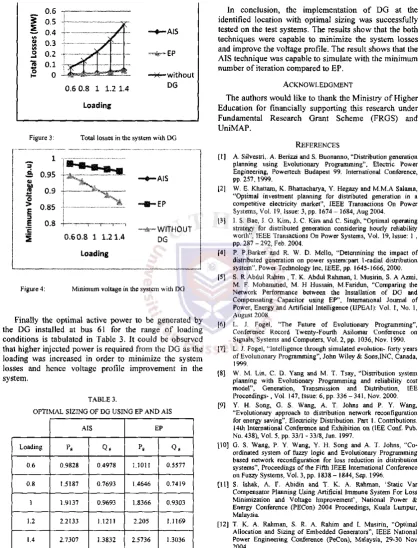
The graph shown in Figure 2 compares the total losses in the system with D G at bus 6 1 . The result from the EP and AIS optimization techniques shows that the total losses in the system were reduced with the installation of
D G .
Similarly, the graph in Figure 3 shows the variation in the minimum voltage with respect to overall load increase in the system when D G was installed at bus 61. It could be observed that allocating D G at bus 61 has given better voltage improvement and hence the voltage profile of the system is maintained at an acceptable range.
TABLE 2.
TOTAL LOSSES AND MINIMUM VOLTAGE IN THE SYSTEM USING EP AND AIS TECHNIQUES
AIS EP
Loading Losses Total V„,„ Iteration Losses Total vm i„ Iteration
0.6 0.0116 0.9839 1 0.0082 0.9839 14
0.8 0.0153 0.9781 2 0.0147 0.9785 20
1 0.0245 0.9724 1 0.0232 0.973 16
1.2 0.0336 0.9669 2 0.0336 0.9674 13
[image:4.594.89.511.107.663.2]5
s
(A VI VI o0.6 0.8 1 1.2 1.4
Loading
AIS
-EP
-without
[image:5.594.84.503.126.674.2]DG
Figure 3: Total losses in the system with DG
•S 0.95
o>
no
2 0.9 o
> 0.85 E 'E
I
0.8
—•—AIS
•EP
, , j j —r-™-™,
0.60.8 1 1.21.4
-WITHOUT DG
Loading
Figure 4: Minimum voltage in the system with DG
Finally the optimal active power to be generated by the DG installed at bus 61 for the range of loading conditions is tabulated in Table 3. It could be observed that higher injected power is required from the DG as the loading was increased in order to minimize the system losses and hence voltage profile improvement in the system.
TABLE 3.
OPTIMAL SIZING OF DG USING EP AND AIS
AIS EP
Loading Pg Q, Pg
0.6 0.9828 0.4978 1.1011 0.5577
0.8 1.5187 0.7693 1.4646 0.7419
1 1.9137 0.9693 1.8366 0.9303
1.2 2.2133 1.1211 2.205 1.1169
1.4 2.7307 1.3832 2.5736 1.3036
V. CONCLUSION
In conclusion, the implementation of DG at the identified location with optimal sizing was successfully tested on the test systems. The results show that the both techniques were capable to minimize the system losses and improve the voltage profile. The result shows that the AIS technique was capable to simulate with the minimum number of iteration compared to EP.
ACKNOWLEDGMENT
The authors would like to thank the Ministry of Higher Education for financially supporting this research under Fundamental Research Grant Scheme (FRGS) and UniMAP.
[1]
REFERENCES
A. Silvestri,. A. Berizzi and S. Buonanno, "Distribution generation planning using Evolutionary Programming", Electric Power Engineering, Powertech Budapest 99. International Conference, pp. 257,1999.
W. E. Khattam, K. Bhattacharya, Y. Hegazy and MM.A Salama, "Optimal investment planning for distributed generation in a competitive electricity market", IEEE Transactions On Power Systems, Vol. 19, Issue: 3, pp. 1674 - 1684, Aug 2004.
I. S. Bae, J. O. Kim, J. C. Kim and C. Singh, "Optimal operating strategy for distributed generation considering hourly reliability worth", IEEE Transactions On Power Systems, Vol. 19, Issue: 1 , pp. 287 - 292, Feb. 2004.
P. P.Barker and R. W. D. Mello, "Determining the impact of distributed generation on power system:part 1-radial distribution system", Power Technology Inc, IEEE, pp. 1645-1666, 2000. S. R Abdul Rahim , T. K. Abdul Rahman, I. Musirin, S. A Azmi, M. F. Mohammed, M. H Hussain, M.Faridun, "Comparing the Network Performance between the Installation of DG and Compensating Capacitor using EP", International Journal of Power, Energy and Artificial Intelligence (IJPEAI): Vol. 1, No. 1, August 2008.
L. J. Fogel, "The Future of Evolutionary Programming", Conference Record Twenty-Fourth Asilomar Conference on Signals, Systems and Computers, Vol. 2, pp. 1036, Nov. 1990. L. J. Fogel, "Intelligence through simulated evolution- forty years of Evolutionary Programming", John Wiley & Sons,INC, Canada, 1999.
W. M. Lin, C. D. Yang and M. T. Tsay, "Distribution system planning with Evolutionary Programming and reliability cost model", Generation, Transmission and Distribution, IEE Proceedings-, Vol. 147, Issue: 6, pp. 336 - 341, Nov. 2000. Y. H. Song, G. S. Wang, A. T. Johns and P. Y. Wang, "Evolutionary approach to distribution network reconfiguration for energy saving", Electricity Distribution. Part 1. Contributions. 14th International Conference and Exhibition on (IEE Conf. Pub. No. 438), Vol. 5, pp. 33/1 - 33/8, Jun. 1997.
G. S. Wang, P. Y. Wang, Y. H. Song and A. T. Johns, "Co-ordinated system of fuzzy logic and Evolutionary Programming based network reconfiguration for loss reduction in distribution systems", Proceedings of the Fifth IEEE International Conference on Fuzzy Systems, Vol. 3, pp. 1838 - 1844, Sep. 1996.
S. Ishak, A. F. Abidin and T. K. A. Rahman, 'Static Var Compensator Planning Using Artificial Immune System For Loss Minimization and Voltage Improvement', National Power & Energy Conference (PECon) 2004 Proceedings, Kuala Lumpur, Malaysia.
Determination of Location and Number of
D-STATCOM at the Distribution Network
S h a m s u l A i z a m Zulkifli*, M d Z a r a f i A h m a d * , R o h a i z a H a m d a n * , a n d N o o r R o p i d a h B u j a l " * Faculty of Electrical and Electronic Engineering, Universiti Tun Hussein Onn Malaysia, Johore, Malaysia. Email:
[email protected], [email protected], and [email protected], and ** [email protected]
Abstract— P o w e r quality devices are used to i n c r e a s e / m o n i t o r the electric system distribution network. T h i s p a p e r is focus on to d e t e r m i n e the location a n d n u m b e r of D i s t r i b u t i o n Static C o m p e n s a t o r ( D - S T A T C O M ) at 10 b u s b a r distribution n e t w o r k . B y find the optimal n u m b e r a n d locati on of D S T A T C O M , it r e d u c e d the n u m b e r s of D -S T A T C O M n e e d s in mitigate voltage s a g p r o b l e m . T h e m o d a l analysis a n d the t i m e d o m a i n simulation are used in d e t e r m i n e the b e s t locat ion o f D - S T A T C O M in distribution n e t w o r k .
Keywords—
D - S T A T C O M , M o d a l A n a l y s i s , recovery t i m e , P S C A DI. INTRODUCTION
Power
quality is the ability of utilities to provide electric p o w e r without interruption. In recent years, due to increase in critical load an electronic device, customers require high form of p o w e r quality than before. T h e most c o m m o n p o w e r quality problems are voltage sags, harmonics, voltage swell, p o w e r interruptions and voltage flicker.Reactive p o w e r compensation is an important issue in electrical p o w e r systems where Flexible A C Transmission System ( F A C T S ) devices play an important role in controlling the reactive p o w e r flow to the power network. Static Synchronous Compensator ( S T A T C O M ) is a m e m b e r of F A C T S family that is connected in shunt with the system. In distribution system, it is also known as D - S T A T C O M . Recent days, S T A T C O M commonly located at every critical load in distribution system and it will increase the p o w e r quality monitoring cost. Optimal n u m b e r and location of D - S T A T C O M will reduce or eliminate p o w e r quality problems in distribution system.
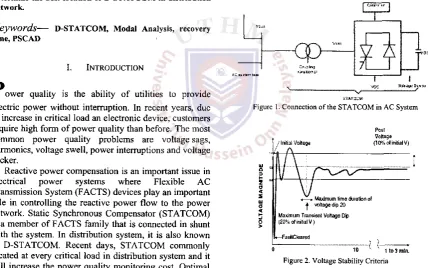
A. D-STA TCOM Configuration
T h e most basic configuration of S T A T C O M consists of two-level Voltage Source Converter ( V S C ) with a D C energy storage device, a coupling transformer connected in shunt with the A C system and the associated control circuits. Fig. 1 shows the schematic diagram of the D -S T A T C O M . T h e V -S C converts the D C voltage across the storage device into a set of three phase A C output
[image:6.594.75.504.321.589.2]voltages that are in phase and coupled with the A C system through the reactance of coupling transformer. A k e y characteristic of this controller is that the active and reactive powers exchanged between the converter and the A C system can b e controlled b y changing the phase angle between the converter output voltage and the bus voltage at the point of c o m m o n coupling [ l ] - [ 4 ] .
Figure 1. Connection of the STATCOM in AC System
Post Voltage /Irate] Voltage (10% ot initial V)
A
1« — M a x i m u m time duration of | voltafledip20
Maximum Transient Voltage Dip (20% of initial V )
*—FaiitCleared
-
\ \•
i o *N v 1 to 3 mm.
Figure 2. Voltage Stability Criteria
B. Voltage Stability and Voltage Recovery Criteria
m e a n s that the D - S T A T C O M that needs to be located must have clearing time for less then 0.4 s
I
: <cyO-
I
1.1 1.0
0 . 9 0 . 8
0 . 7 0 . 6
0.S 0 . 4
0 . 3 0 . 2
0.1
0 . 0 0 . 3 0 . 6 0 . 9 1.2 1.5 1.8 2 . 1 2 . 4 2 . 7 3 . 0 Tim* (Second*)
Figure 3. Voltage Recovery Criteria [5]
0.5 S o u n d s
Fault
.Clearing
T h e distribution network w a s obtained from T e n a g a Nasional Berhad, Batu Pahat, Johor, Malaysia. The overall flow of this paper is summarized in the flow chart as s h o w n in Fig. 4.
The P S C A D software w a s used to simulate the network where the single line diagram w a s converted to electrical network using mathematical formulas. For three phase loads, the active p o w e r was considered as load resistance and reactive p o w e r was considered as load inductance. T h e loads was calculated for each bus bar and the three phase voltage (VL_l) from m a i n supply
sub-station ( M E S ) is 1 l k V and apparent p o w e r (S) equal to 3 0 M V A . T h e designed network using P S C A D is shown in Fig. 5 and Fig. 6 for the system without D - S T A T C O M and the system with D - S T A T C O M respectively.
II. N E T W O R K D E S I G N
^ START ^
IjiwiiO M I A 1 l« M
T
CED
Figure 4. Project Flow-Chart
i
i i
i i
f f
L
-Figure 5. Distribution System without D-STATCOM
T h e distribution network is divided into three group which are main b u s bar A, m a i n b u s b a r B a n d main b u s bar C and the grouping of b u s e s is shown in Table 1.
TABLE 1
GROUPING OF MAIN BUSBAR
G r o u p N o . o f Bus
A Busbar 1, Busbar 2,
Busbar 3 , Busbar 4 and Busbar 6
B Busbar 7 and Busbar 8
(b) Group of main bus B
[image:8.594.297.516.374.564.2]t t
Figure 6. Distribution System with D-STATCOM.
In this simulation, a fault time is set to 1 s and occurs from 0.5 s until 1.5 s. T h e fault component is connected in shunt to the study distribution system as shown in Fig. 5 and Fig. 6. T h e simulation is run in t w o conditions, which are, a network without D - S T A C O M and a network with D - S T A T C O M . T h e network without D - S T A T C O M is simulated to monitor the voltage at each main group bus bar and the voltage sag that been occurred. Modal analysis is used to identify the best location of D -S T A T C O M . T h e idea is to get the time of recovery based on voltage recovery criteria as shown in Fig. 3 where it is classified to ideal, adequate or poor. T h e ideal bus bar then will be chosen as the best location of D - S T A T C O M .
III. RESULTS AND ANALYSIS
A. Result of Simulation Network without D-STA TCOM
T h e system w a s simulated for three seconds with three phase balance fault occurring at time 0.5 s for duration of 1.0 s. The results of simulation are shown in Fig. 7. For the system without D - S T A T C O M , the load voltage dropped from 0.818 p.u to 0.800 p.u at the group of main b u s bar A as shown in Fig. 7(a).
PorjOnll Voiago
-Mm0.7SB Max O-ai 9
(a) Group of main bus A
0.2O 0 . 4 0 ^ 0.60 O.BO 1 .20 1 .40 1 JO 1 OO 2HO X 0 . 9 8
(c) Group of main bus C
Figure 7. Without D-STATCOM at (a) bus A, (b) bus B, (c) bus C
T h e voltage dropped starting from 0.5 s until 1.5 s because of faults time is set to start at 0.5 s for the duration of 1 s. After the fault time, the voltage will return constant at the normal condition. This short-term reduction in voltage is called voltage sag. In this simulation, the voltage sag is non-repetitive but in the real network, it can be happen.
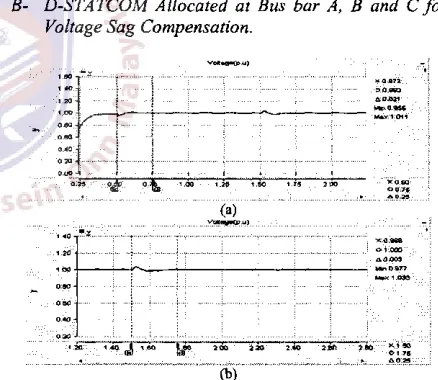
B- D-STATCOM Allocated at Bus bar A, B and C for Voltage Sag Compensation.
0.30
0 )
O.BO
O.eo
(LpO 300 2.20 2.*Q 2*D 2.RO
[image:8.594.67.278.634.714.2]0>)
Figure 8. Load voltage of group main Bus A, a) without D-STATCOM b) with D-STATCOM. c) Time of Recovery
T h e simulation results of the D - S T A T C O M at group bus b a r A response in term of the load voltage in per unit are shown in Fig 8. F o r the system with the D -S T A T C O M connected in the system, the load voltage will increase from 0.800 p.u to 0.993 p.u as shown in Fig. 8(a) while Fig. 8(b) shows the load voltage takes 0.25 s to recover to the rated voltage.
(a)
X 0.988 01.000 A 0.003
2.00 2 20 2.40 2.60 3 9
[image:9.594.77.280.98.294.2](b)
Figure 9. Load voltage of group main Bus B , a) With D-STATCOM. b) Time of Recovery
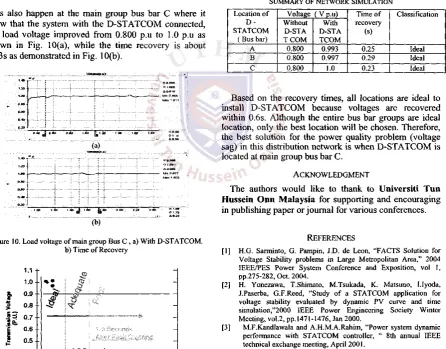
This also happen at the main group bus b a r C where it show that the system with the D - S T A T C O M connected, the load voltage improved from 0.800 p.u to 1.0 p.u as shown in Fig. 10(a), while the time recovery is about 0.23s as demonstrated in Fig. 10(b).
ao a-to
HE
73
(a)
[image:9.594.81.528.298.647.2]s r £ "° J f A E» "° "> ~ ' ; : ~
Figure 10. Load voltage of main group Bus C , a) With D-STATCOM. b) Time of Recovery
S3
.St
1.1 1.0 0.9 0.8 0.7 0.6 0.5 0.4 0.3 0.2 0.1—
J
1: o
Fault .Clearing
0.5 Seconds •Aft®' £puif..Cte.sfiD.a
- t - -+- -+-
-4-0.0 0.3 0.6 0.9 1.2 1.5 1.8 2.1 2.4 2.7 3.0
[image:9.594.84.266.562.707.2]Tima(Ssconds)
Figure 11. Plot of voltage time recovery
From the results obtained, all the recovery time are plotted at the graph of voltage recovery time as shown in Fig. 11. T h e plotted graph demonstrates that all the desiring time is fall at the ideal condition means the D -S T A T C O M can be placed in any point of bus system. The results also presents a spike at the beginning and at the end of fault duration and these are caused by the process of charging and discharging of the capacitor in D -S T A T C O M circuit.
I V . C O N C L U S I O N
The simulation results obtained shows that, the D -S T A T C O M responded well in mitigating voltage sag caused b y three-phase balance fault. The summarize data of voltage recoveries, time recoveries and classification of the network are depicted in Table 2.
TABLE 2
SUMMARY OF NETWORK SIMULATION
Location of D -STATCOM
(Bus bar)
Voltage ( V p . u ) Time of recovery (s) Classification Location of D -STATCOM (Bus bar) Without D-STA TCOM With D-STA TCOM Time of recovery (s) Classification
A 0.800 0.993 0.25 Ideal
B 0.800 0.997 0.29 Ideal
C 0.800 1.0 0.23 Ideal
Based on the recovery times, all locations are ideal to install D - S T A T C O M because voltages are recovered within 0.6s. Although the entire bus bar groups are ideal location, only the best location will b e chosen. Therefore, the best solution for the power quality problem (voltage sag) in this distribution network is when D - S T A T C O M is located at main group bus bar C.
ACKNOWLEDGMENT
The authors would like to thank to Universiti T u n Hussein O n n Malaysia for supporting and encouraging in publishing paper or journal for various conferences.
REFERENCES
[1] H.G. Sarminto, G. Pampin, J.D. de Leon, "FACTS Solution for Voltage Stability problems in Large Metropolitan Area," 2004 IEEE/PES Power System Conference and Exposition, vol 1, pp.275-282, Oct. 2004.
[2] H. Yonezawa, T.Shimato, M.Tsukada, K. Matsuno, I.Iyoda, J.Paserba, G.F.Reed, "Study of a STATCOM application for voltage stability evaluated by dynamic PV curve and time simulation,"2000 IEEE Power Engineering Society Winter Meeting, vol.2, pp.1471-1476, Jan 2000.
[3] M.F.Kandlawala and A.H.M.A.Rahim, "Power system dynamic performance with STATCOM controller, " 8th annual IEEE technical exchange meeting, April 2001.
[4] Noor Izzri bin Hj Abdul Wahab, "Power Quality Improvement Using Distribution Static Compensator (D-STATCOM) On 11 kV Distribution System", Universiti Putra Malaysia: Msc Thesis. 23¬ 31, 38-72, May 2002.