www.wjpr.net Vol 4, Issue 05, 2015.
2096
DEVELOPMENT, CHARACTERISATION AND PRECLINICAL
EVALUATION OF SOME NOVEL ENZYMES WITH VITAMIN
Amol S.Rakte*1, Dr. Basavaraj K.Nanjwade2
*1Department of Pharmaceutics, Faculty of Pharmacy, Pacific University, Udaipur-313024, Rajasthan, India.
2
Department of Pharmaceutics, Faculty of Pharmacy, Omer Al-Mukhtar University, Tobruk,
P. O. Box 919, Libya.
ABSTRACT
Aim of the present research was to formulate and evaluate a
multienzyme (Bromelain, Papain, Bacterial Protease, Rutin) with
Vitamin C effervescent tablet with sufficient mechanical integrity,
good palatability, robust formulation, good stability, inexpensive and
shop floor friendly product produced in normal thermo-hygrometric
conditions. In the preformulation study, identification of each enzymes
were done with the help of MALDI-TOF instrument and compatibility
evaluation was performed which implies that drug and excipients were
compatible with each other. The formulations of tablets were done by
using different methods like wet granulation, dry granulation and direct
compression. Total ten trials for each method was prepared and
evaluated for hardness, friability, effervescent time, weight variation, and pH. Finally one
batch from each method having good physical parameters was kept for stability {DC-6
(direct compression) DG-7(dry granulation) and WG-8(wet granulation)}. From that
techniques stability of tablets with wet granulation method was found to be satisfactory than
other methods. The preclinical evaluation of this composition study has been undertaken to
investigate the anti-inflammatory and toxicity studies in laboratory animals (Albino Wistar
Rats).The main method used for Anti-inflammatory was Carrageenan induced paw edema
and for toxicity studies OECD 407 (Repeated Dose 28-Day Oral Toxicity Study in Rodents)
and OECD 425 (Acute Oral Toxicity – Up-and-Down Procedure).
KEYWORDS: Effervescence, Enzyme Premix, OECD, MALDI-TOF, Carrageenan induced paw edema.
Volume 4, Issue 5, 2096-2123. Research Article ISSN 2277– 7105
Article Received on 07 March 2015,
Revised on 30 March 2015, Accepted on 20 April 2015
*Correspondence for
Author
Amol S.Rakte
Department of
www.wjpr.net Vol 4, Issue 05, 2015.
2097 INTRODUCTION
Effervescence is the reaction (in water) of acids and bases producing carbon dioxide. Typical
acids used in this reaction are citric, malic, tartaric, adipic, and fumaric. Citric acid is the
most commonly used, and it imparts a citrus-like taste to the product. Tartaric, adipic, and
fumaric acids are used sparingly because of their low water solubility’s. Typical bases used in
the effervescent reaction are sodium bicarbonate, potassium bicarbonate, sodium carbonate,
and potassium carbonate. Sodium bicarbonate is very common in effervescent formulas and
produces a clear solution after tablet disintegration. When sodium levels are a concern,
potassium bicarbonate is used. Both types of carbonates are used mainly as desiccants.
Binders are normally necessary in effervescent tablets to bring the tablet hardness to a point
where handling is possible. A binder should be used very cautiously because binders can
carry free moisture into the tablet, which is undesirable and can increase disintegration times
when used in large quantities. The ideal amount of binder is one that makes the tablet hard
enough to handle, but soft enough to disintegrate (harder the tablet, slower the disintegration)
and dry enough to be stable.[1] Effervescent system also available with powder form, the
problem with this type of formulation is content of uniformity, but not associated with
effervescent tablets. Generally any effervescent product requires strictly temperature (650F to
750F) and humidity (10 to 20 % RH) controlled area. So, we were trying to prepare such type
of product in a normal thermo-hygrometric controlled area (240C/35% RH) with good
palatability, robust formulation, good stability, inexpensive and shop floor friendly product.
Following advantages with effervescent dosage form,
1) Ingredients are fully bio-available[2]
2) The Presence of carbon dioxide enhances absorption[3]
3) Creates a buffered solution[4]
4) Incorporation of more active nutrients[5]
5) Consistent and reliable dose[5]
6) Great taste
7) Gentle action, less stomach upsets
8) Effervescent vitamins are easier to swallow[6]
MATERIAL AND METHODS Materials
Enzyme blend were obtained as gift sample from AE, Mumbai. Citric acid (anhydrous),
www.wjpr.net Vol 4, Issue 05, 2015.
2098
Sodium bicarbonate, Tartaric acid purchased from Lar Chemicals. Simethicone (30%) gift
sample from Meyer Mumbai. Aerosil-200 gift sample from Evonik, Mumbai. Orange flavor
gift sample from Quest fragrances, Mumbai. Povidone, Isopropyl alcohol,
Methylenedichloride gift sample from AE. Mannitol, Lactose, Microcrystalline Cellulose,
Crospovidone, Hypromellose, Tween-80 gift sample from Signet Chemical Corporation,
Mumbai.
Methods
In this research three methods were used.
A) Direct compression
B) Dry granulation (Slug)
C) Wet granulation
A) Direct compression
Enzyme blend, citric acid (anhydrous), tartaric acid, sodium bicarbonate, sodium carbonate,
sodium citrate, sodium glycine carbonate, hypromellose, povidone, sodium lauryl sulphate,
sodium benzoate were separately weighed and passed through sieve no. #40. Orange flavor
and acesulfame potassium weighed and passed through sieve no.#80.Purifed talc and
colloidal silicon dioxide were weighed and passed through sieve no.#60.Then the ingredients
mixed in geometric order and compressed it using 24.8 mm circular plain punches on single
rotary 12 stations tablet compression machine. Followingwere the trial formulations prepared
with this method shown in Table 1.
B) Dry Granulation (Slug)
Typically, the process involves compressing a powder mixture into a rough tablet or ‘slug’ on
a heavy duty rotary tablet press. The slugs are then broken up into granular particles by a
grinding operation, usually by passage through an oscillating granulator the individual steps
include mixing of the powders, compression (slugging) and grinding.[7] 1) Slug preparation
Enzyme blend, povidone, half quantity of mannitol, lactose, crospovidone, sodium benzoate
were weighed and passed through sieve no.#40 and compressed it using 16 mm FBE (Flat
beveled edges) circular plain punches on single rotary tablet compression machine with
hardness 6 – 7 Kg/cm2.Obtained tablets were milled in 3.0 mm screen and then passed
www.wjpr.net Vol 4, Issue 05, 2015.
2099 2) Granulation
Half quantity of citric acid (anhydrous), tartaric acid, sodium bicarbonate were weighed and
passed through sieve no.#40.Taken the 1 % of water for granulation with total granulating
material. Obtained wet mass were sift through sieve no. #8 and kept for drying at 500 C ± 50C
for 30 minutes. Semidried mass were passed through sieve no. #20 and then dried at 500 C ±
50C until L.O.D. obtained below 1.0 %.
3) Prelubrication
Remaining half quantity of mannitol, citric acid (anhydrous), tartaric acid, and sodium
bicarbonate were taken with microcrystalline cellulose and passed through sieve no.
#40.Weighed the acesulfame potassium, orange flavor and passed through sieve no.
#80
4) Lubrication
Colloidal silicon dioxide, purified talc weighed and passed through sieve no.#60 along with
remaining half quantity of sodium benzoate already passed through sieve no. #40.The all
steps were mixed and taken the trials using 24.8 mm circular plain punches on single rotary
12 stations tablet compression machine. Followingwere the trial formulations prepared with
this method shown in Table 2.
Table.1. Direct compression formulation
⃰
Appropriate overages were added to compensate the probable loss on storage
API & Excipients DC-1 DC- 2 DC- 3 DC- 4 DC- 5 DC- 6 DC- 7 DC- 8 DC- 9 DC-10
Enzyme Premix 400 ⃰ 400 ⃰ 400 ⃰ 400 ⃰ 400 ⃰ 400 ⃰ 400 ⃰ 400 ⃰ 400 ⃰ 400 ⃰
Citric Acid (Anhydrous) 400 400 520 400 500 460 490 480 500 460
Tartaric Acid 800 450 - 350 300 915 980 960 1000 920
Sodium Bicarbonate 1200 600 1520 1245 1065 1350 1425 - 1500 -
Sodium Carbonate 45 600 - - 200 - - 1480 - 1350
Sodium Citrate 150 200 - - - 215 200 - 220 -
Sodium Glycine Carbonate - - 163 165 200 - - 170 - -
Sodium Lauryl Sulphate 30 20 - 20 15 25 20 20 15 30
Povidone (PVP-K-30) 120 100 120 110 115 110 90 110 100 90
Acesulfame Potassium 20 - - 20 20 25 20 25 30 30
Sodium Benzoate 20 20 25 15 25 30 25 25 25 25
Purified Talc 5 12.5 12.5 10 5 10 10 10 10 5
Colloidal Silicon Dioxide 10 7.5 7.5 5 10 5 10 5 10 10
Orange Flavor 35 20 35 25 30 30 35 40 40 20
www.wjpr.net Vol 4, Issue 05, 2015.
2100 Table.2. Dry granulation formulations
API & Excipients DG-1 DG- 2 DG- 3 DG- 4 DG- 5 DG- 6 DG- 7 DG- 8 DG- 9 DG-10
Enzyme Premix 400 ⃰ 400 ⃰ 400 ⃰ 400 ⃰ 400 ⃰ 400 ⃰ 400 ⃰ 400 ⃰ 400 ⃰ 400 ⃰
Citric Acid (Anhydrous) 400 300 250 400 450 600 400 500 450 350
Tartaric Acid 800 600 500 500 200 - 600 500 800 700
Sodium Bicarbonate 1200 1350 1200 1100 1000 1100 1300 850 1000 1050
Mannitol
(Pearlitol 200 SD) 100 100 120 110 120 130 150 175 200 225
Lactose
(Pharmatose DCL-21) 50 65 80 100 110 120 50 50 80 75
Crospovidone
(Polyplasdon XL) 50 65 80 100 110 100 70 60 80 75
Microcrystalline
Cellulose 100 90 100 80 100 120 130 125 150 150
Povidone
(PVP-K-30) 50 65 80 65 85 100 80 85 100 90
Acesulfame Potassium 30 40 35 40 45 50 40 55 50 40
Sodium Benzoate 25 30 35 40 45 50 35 40 45 50
Purified Talc 05 10 10 10 10 10 10 10 10 10
Colloidal Silicon
Dioxide 05 10 10 10 10 10 10 10 10 10
Orange Flavor 35 40 30 30 50 40 35 50 45 35
Weight of the tablet
(mg) 3250 3165 2930 2985 2735 2830 3310 2910 3420 3260
⃰Appropriate overages were added to compensate the probable loss on storage
C) Wet granulation[8]
This method comprises four steps- drug granulation, acidic granulation, alkaline granulation and lubrication.
Drug granulation method - Enzyme blend and orange flavor were weighed and passed
through sieve no. #40.Tween-80, hypromellose were weighed and dissolved in isopropyl
alcohol made a binding to the enzyme blend and obtained wet mass passed through sieve no.
# 8 & kept in tray dried at 450C for half an hour then the semidried wet mass passed through
sieve no. # 20 and the granules were dried until the L.O.D. was observed below 1%.
In acidic granulation weighed the citric acid, tartaric acid were blended and passed through
sieve no. #40. Second step simethicone (30%) were weighed and dissolved in organic solvent
i.e. methylene dichloride. Granules of acidic component were made with this solution. The
obtained wet mass passed through sieve no. # 8 & kept in tray dried at 550C for half an hour
then the semidried wet mass passed through sieve no. # 20 and the granules were dried until
www.wjpr.net Vol 4, Issue 05, 2015.
2101
In alkaline granulation method weighed sodium bicarbonate, sodium carbonate passed
through sieve no.# 40.The granulation were carried out with a binder solution comprises
povidone dissolved in isopropyl alcohol. The obtained wet mass passed through sieve no. # 8
& kept in tray dried at 450C for half an hour then the semidried wet mass passed through
sieve no. # 20 and the granules were dried until the L.O.D. was observed below 1%. (On IR
moisture balance at 1050C for 5 min.)
Lubrication was done with sodium lauryl sulphate and acesulfame potassium was weighed
and passed through sieve no. # 40.These ingredients were mixed with above obtained
granules passed already through sieve no. # 40.Finally in this blend weighed and add
colloidal silicon dioxide, sodium benzoate (passed through sieve no. # 40), purified talc
(passed through sieve no. # 60). Taken the trials with above obtained blend using 24.8 mm
circular plain punches on single rotary 12 stations tablet compression machine.
Followingwere the trial formulations prepared with this method shown in Table 3
Table.3. Wet granulation formulations
API & Excipients
WG-1 WG- 2 WG- 3 WG- 4 WG- 5 WG- 6 WG- 7 WG- 8 WG- 9 WG-10
Enzyme Premix 400 ⃰ 400 ⃰ 400 ⃰ 400 ⃰ 400 ⃰ 400 ⃰ 400 ⃰ 400 ⃰ 400 ⃰ 400 ⃰
Citric Acid (Anhydrous) 400 - 500 400 800 450 470 480 500 450
Tartaric Acid 800 - 1000 800 - 900 940 960 1000 900
Fumaric Acid 200 600 - - - -
Sodium Bicarbonate 1200 1200 1520 1200 1400 1350 1425 1440 1490 1350
Sodium Carbonate 150 200 - - - 200 200 210 200 -
Sodium Glycine Carbonate - 150 - 140 120 - - - - 160
Simethicone 30% 45 50 40 45 35 45 50 60 60 35
Hypromellose
(HPMC-5-CPS) 20 30 35 20 25 15 25 15 15 20
Polysorbate-80 15 20 - 20 15 25 20 20 15 10
Sodium Lauryl Sulphate
(SLS) 20 - - 20 20 25 20 20 15 10
Povidone (PVP-K-30) 85 105 100 110 100 110 100 115 100 90
Acesulfame Potassium 15 25 35 30 15 40 45 50 55 -
Sodium Benzoate 20 20 25 15 25 25 25 25 20 20
Purified Talc 5 10 5 10 5 10 5 5 5 10
Colloidal Silicon Dioxide 10 5 5 5 10 5 5 5 5 5
Orange Flavor 35 20 35 25 30 30 35 45 30 20
Iso propyl alcohol q.s. q.s. q.s. q.s. q.s. q.s. q.s. q.s. q.s. q.s.
Methylenedichloride q.s. q.s. q.s. q.s. q.s. q.s. q.s. q.s. q.s. q.s.
Weight of tablet (mg) 3420 2835 3700 3240 3000 3630 3765 3850 3910 3480
www.wjpr.net Vol 4, Issue 05, 2015.
2102 Drug - Excipients compatibility and identification of enzymes peak study
The drug-excipients compatibility study was carried out by using Infrared spectroscopy.IR
study was conducted using KBr powder mixing method (Shimadzu , Japan) and the
spectrums were recorded in the wavelength region of 4000 - 400 cm-1.The individual
identification of enzymes can be identified by using Matrix Assisted Laser Desorption
Ionization – Time of Flight (MALDI-TOF) instrument.
Evaluation of granules[9] 1) Angle of repose
Angle of repose was determined by Neumann’s method and calculated using the formula, for
powder as well as granules (lubricated or unlubricated) Tan θ = (h / r) or θ = Tan-1
(h / r)
Where, h = height of pile, r = radius of the pile base
2) Bulk density (g/cm3)
The bulk density was calculated using equation,
Volume Bulk
powder the
of Weight Density
Bulk
Apparent
3) Tapped density (g/cm3)
The tapped density was calculated using equation,
volume Tapped
powder the
of Weight density
Tapped
4) Hausner ratio
Calculated by,
y BulkDensit
Density Tapped
io HausnerRat
5) Compressibility index
Compressibility index of granules determined by,
Evaluation of IPQC parameters of tablets 1) Hardness[10]
Hardness was determined by using Monsanto tablet hardness tester (Campbell Electronics,
www.wjpr.net Vol 4, Issue 05, 2015.
2103 2) Thickness and Diameter[10]
The thickness and diameter of tablets were measured with vernier caliper. Average thickness
and diameter were calculated.
3)Weight variation[10]
20 tablets were weighed individually. Average weight was calculated from the total weight of all tablets. The individual weights were compared with the average weight. The percentage
difference in the weight variation should be within the permissible limits (± 5.0%)
4) Effervescent time
Shouldnot more than 5 min. as per pharmacopoeias (I.P. /B.P.)
5) Friability[10]
The friability of tablets using 10 tablets as a sample was measured using a Roche friabilator.
Tablets were rotated at 25 rpm for 4 minutes or up to 100 revolutions. The tablets were taken
out, deducted and reweighted. The percentage friability was calculated from the loss in
weight as given in equation below. The weight loss should not more than 1%.
6) Carbon dioxide content[11]
I. Refer to the electronic balance user’s guide to set up the balance. Be sure to level and
zero the unit.
II. Put empty glass beaker on balance and note down the reading (in gm).
III. Add water (app. 3 – 4 ounces) in the weighed beaker and note down the reading (in gm)
IV. Take and note down the accurate weight of tablet / powder (M3).
V. Note down the weight of glass beaker filled with water and tablet / powder (in gm)
before the effervescent reaction (M2).
VI. Add the weighed tablet / powder in glass beaker filled with water.
VII. After complete effervescent reaction (5 min.) note down the weight of glass beaker
(M1).
www.wjpr.net Vol 4, Issue 05, 2015.
2104
Carbon dioxide, percent by mass = M2 - M1 × 100
M3
Where,
M1 – Mass in grams after the test
M2 – Mass in grams before the test,
M3 – Mass in grams of the sample taken for test
Stability studies of optimized formulations
Stability testing of drug products begins as a part of drug discovery and ends with the demise
of the compound or commercial product. Optimized formulation were packed and stored in
stability chambers as per ICH guidelines maintained at 25°C±2°C/60%±5%RH, 30°C±
2°C/65% ±5% RH, 40°C±2°C/75%±5% RH for two months. The tablets were withdrawn
periodically and evaluated for thickness, hardness, effervescent time, pH of solution etc. At
the end of studies, samples were analyzed for the % drug content.
Drug-excipients compatibility study
The incompatibility between the drug and excipients were studied by IR spectroscopy. The
spectral data of pure drug and drug-excipient mixtures indicate that there was no chemical
incompatibility between drug excipients used in formulation. The following identical peak
was observed within study 2924 - 2918 cm-1 (H-C-H Asymmetric and Symmetric stretching),
2854 – 2850 cm-1 (Alkyl C-H Stretching), 1658 -1635 cm-1 (C-C=C Symmetric stretching),
1546 – 1527 cm-1 (N-H bending), 744 – 705 cm-1(Aromatic C- H bending).
Peak identification
The individual peak of enzymes were identified with the help of MALDI-TOF instrument.
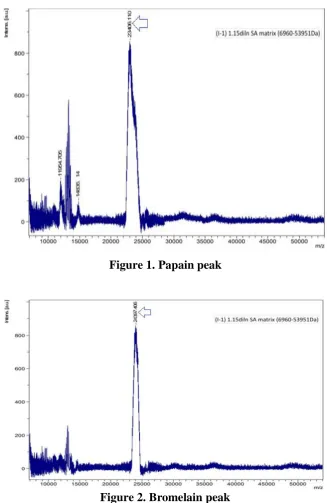
1) Papain- (Mole.wt. - 23,406 Da)
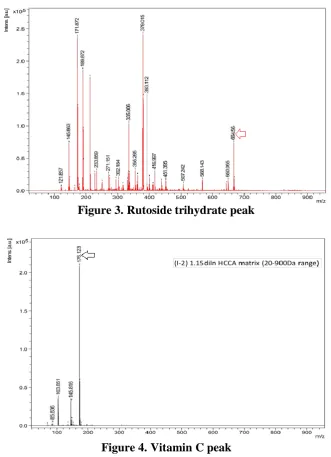
2) Bromelain- (Mole.wt.- 24,397 Da)
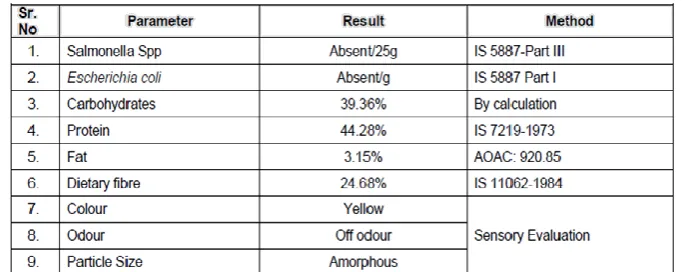
3) Rutoside Trihydrate- (Mole.wt.- 664.56 Da)
www.wjpr.net Vol 4, Issue 05, 2015.
[image:10.595.132.460.63.567.2]2105 Figure 1. Papain peak
www.wjpr.net Vol 4, Issue 05, 2015.
[image:11.595.131.463.66.524.2]2106 Figure 3. Rutoside trihydrate peak
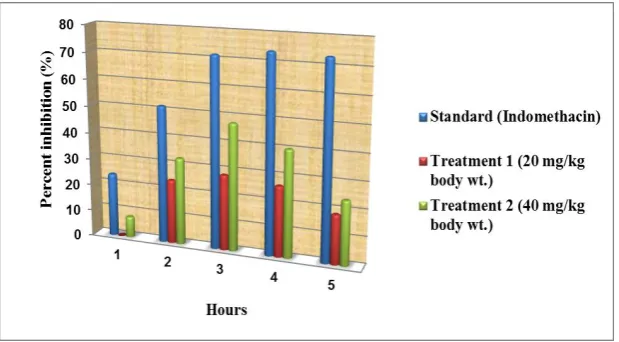
Figure 4. Vitamin C peak Evaluation of tablet parameters
The formulation with direct compression (DC-6), dry granulation (DG-7) and wet granulation
(WG-8) trials were found satisfactory physical parameters as compared to other trials with
respective method of tablet preparations. The appearance of tablets was found good in DG-8
as compared to DC-6 and DG-7.
The evaluation of physical parameters of DC-6 (Direct compression), DG-7(Dry granulation)
and WG-8 (wet granulation) shown in Table 4, were concluded that the WG-8 trial
formulation observed comprehensive better physical characteristics than others.
www.wjpr.net Vol 4, Issue 05, 2015.
[image:12.595.16.589.88.230.2]2107 Table 4. Comparison of best trial formulations physical parameters
Method Thickness
(mm)
Hardness (Kg/cm2)
Friability (%) Efferve. time (sec) pH of solution L.O.D. (%) Diameter (mm) CO2 gm/tab Wt. Variation (%) DC-6 (Direct compression) 6.15
(±0.15) 4 – 5 1.2 % 70 ± 5
6.80
(±0.02) 1.30 %
24.80 (+0.01) 0.414 (11.57%) 3.80 (±0.2) DG-7(Dry granulation) 5.70
(±0.15) 4 – 5 0.9 % 75 ± 5
6.80
(±0.02) 1.25%
24.80 (+0.01) 0.35 (10.57%) 2.90 (±0.2) WG-8 (Wet granulation) 5.90 (±0.1) 4 –5
0.8 % 80 ± 5 6.40
(±0.02) 0.85%
24.80 (+0.01) 0.50 (12.98%) 2.40 (±0.2)
(Mean ± SD) n=5
The tablets obtained with wet granulation method were found to be satisfactory as compared
to other methods. For stability study the good three trial formulations within each method
i.e.DC-6(direct compression), DG-7(dry granulation), WG-8 (wet granulation) were
considered. The physical properties of WG-8 (wet granulation) were found good rather than
DC-6 and DG-7 trial formulations. The initial nutritional and microbiological analysis of trial
formulation WG-8 (wet granulation) was shown in Table 5. The FPS of trial formulation
WG-8 (wet granulation) was shown in Table 6.
[image:12.595.126.470.426.562.2]Table 5. Microbiological, nutritional report of WG-8 wet granulation formulation
Table 6. Finished product specifications WG-8 (wet granulation)
Sr.No. Test Acceptance criteria Observed
1 Description Beige colored circular shaped tablet
having plain on both sides.
Beige colored circular shaped tablet having plain on both sides.
2 Thickness 5.80 ± 0.2 mm (5.60 mm to 6.00 mm) 5.70 mm to 5.90 mm
3 Uniformity of weight 3850 mg ± 5.0 %
( 3830.75 mg to 3869.25 mg) 3835 mg to 3860 mg
4 Effervescent time (sec.) Not more than 5 minutes 75 to 85
5 Content of actives
(Enzyme activity/tablet)
Not less than 2000 FIP units as per FCC 2500 Units / tablet ± 10.0 % of input ( 2250 Units to 2750 Units / tablet)
2468 Units / tablet (123.4 % with overages)
6 % Content of active
(%Enzyme activity/tablet)
Not less than 90.0 % to Not more than
www.wjpr.net Vol 4, Issue 05, 2015.
2108
The three trial formulations DC-6, DG-7, WG-8 were kept for stability as per ICH guidelines
in 0.04 mm aluminium-aluminium single tablet strip. The stability study was done up to 2
months. After 2 months stability evaluate the physical and analytical parameters of all
stability batches. The comparative evaluations of stability study with all batches were shown
in Table 7.
Table 7. Comparative evaluation of stability study after two months Sr.
No.
Trial
Formulations Pack
Physical and Analy- tical parameters
Initial results
Climatic conditions 400C/
75 % RH
300C/ 65 % RH
250C/ 60 % RH
1 DC-6 (Direct Compression) Alu-Alu strip (0.04 mm)
Assay 121.9% 100.02% 105.3% 110.2%
Thickness (mm) 6.10(±0.2) 6.50(±0.2) 6.25(±0.2) 6.11(±0.2)
Hardness (Kg/cm2) 4 – 5 3– 4 3.5 – 4.5 4 – 5
Effervescent time (sec.) 70 ± 5 200 ± 5 190 ± 5 140 ± 5
pH of solution 6.90
(± 0.03) 6.60 (±0.03) 6.50 (±0.03) 6.70 (±0.03) 2 DG-7 (Dry Granulation) Alu-Alu strip (0.04 mm)
Assay 122.8% 101.2% 107.8% 115.02%
Thickness (mm) 5.65(±0.2) 5.85(±0.1) 5.75(±0.1) 5.7(±0.1)
Hardness (Kg/cm2) 4 – 5 3 – 4 3.5 – 4.5 4 – 5
Effervescent time (sec.) 75 ± 5 190 ± 5 155 ± 5 135 ± 5
pH of solution 6.80 ± 0.03 7.10± 0.03 6.95±0.04 6.85± 0.03
3 WG-8 (Wet Granulation ) Alu-Alu strip (0.04 mm)
Assay 123.4% 113.9 % 117.8 % 119.4 %
Thickness (mm) 5.80 (±0.2) 6.10(±0.1) 5.95(±0.2) 5.90 (±0.2)
Hardness (Kg/cm2) 4 – 5 3.5 – 4.5 4 – 5 4 – 5
Effervescent time(sec.) 80 ± 5 170 ± 5 150 ± 5 110 ± 5
pH of solution 6.40 ± 0.03 6.85 ±
0.03 6.70 ± 0.02 6.50 ± 0.03
Preclinical Study
Measurement of Anti-inflammatory activity
To study the acute and sub acute phases of inflammation in rodents (rats and mice),
carrageenan is a widely used irritant or inflammogen or a phlogestic agent. Chemically, it is a
sulphated polysaccharide from sea weeds (Rhodophyceae). The experimental tissue injury
caused by this irritant initiates the cascade of events leading to formation of exudates. The
inflammation induced it is biphasic in nature. The first phase is attributed to the release of
histamine, 5-HT and kinins, while the second phase is related to the release of prostaglandins.
Therefore, to study the effect of test preparation on acute inflammation a well recognized
carrageenan induced rat paw edema technique.[12-14] This technique has been successfully
www.wjpr.net Vol 4, Issue 05, 2015.
2109
The hind paw edema in rats (24 nos.) was induced by injecting 0.1ml (w/v) of 1%
carrageenan (prepared in normal saline) in sub planter region. These rats were equally
divided in four groups. The rats in different groups received treatments one hour prior to
carrageenan administration. The rats in group I received no treatment which served as a
control group and rats in group II received indomethacin as a standard drug at the dose rate of
10 mg/kg body weight. Rats in group III, group IV received test preparation at the dose rate
of 20 mg/kg body weight and 40 mg/kg body weight respectively. The paw volume, up to the
ankle joint, was measured before and at the end of each hour up to three hours after
carrageenan injection, by using the plethysmometrically (Model no.PLM-01, Make- Orchid
Scientific, Nashik). An increase in paw volume has been expressed as percent increase over
control values recorded in terms of unit (ml). The percent inhibition of acute inflammation
was calculated by using the formula.
Percent Inhibition (%) = Vc – Vt X 100 Vc
Where, Vc and Vt represent mean paw volumes in control and treated group, respectively.
Toxicity Study
The experiment was carried out as per Organization for Economic Co-operation and
Development (OECD) guideline no. 407 and 425[22-23] with slight modifications. The rats
were kept under observation for a period of 28 days during the study. During this time the
animals were weighed daily. The blood was collected from any six animals for the
hematological and biochemical analysis before the beginning of the experiment on 15th day
and on 29th day of the experiment through retro-orbital plexus 24 hr. after the last dose,
centrifuged at 3000 rpm at 4°C for 10 minutes to separate serum.[24] The activities of serum
glutamate pyruvate transaminase (SGPT)[25], Albumin[26] were assayed. The alkaline
phosphatase activity in the serum was also measured. [27] The blood was also used to estimate
other hematological parameters of normal, control and treated animal groups.[28-29] The liver
was excised, rinsed in ice-cold normal saline followed by cold 0.15 M Tris-HCl (pH 7.4),
blotted and weighed. Proteins were estimated by using bovine serum albumin as the
standard.[30]
In the toxicity study the following parameters were checked.
www.wjpr.net Vol 4, Issue 05, 2015.
2110
Body weights: The weights of the animals recorded daily throughout the treatment period. Biochemical parameters: The biochemical parameters were studied on 15th day and 29th day of study and the values were compared to corresponding values from the same animals at 0
day. The biochemical parameters were studied to find out the kidney and liver functions of the animals under study.
Hematological parameters:The hematological parameters were studied on day 0 day, 15th day
and 29th day of study for any changes. The Hemoglobin, WBC, Platelets, RBCs, etc.
parameters were studied.
Histopathological study: On 29th day of study the representative rats were sacrificed and all
the vital organs were observed for any macroscopic changes.
Anti-inflammatory effect of test drug on carrageenan induced paw edema
Test drug had shown a significant anti-inflammatory activity against carrageenan induced
paw edema in a dose dependent manner. In this carrageenan induced paw edema model
Treatment 1(20 mg/kg body weight) and Treatment 2 (40 mg/kg body weight) showed
maximum percent inhibition at 3rd hr as follows: 28.23 % and 47.56 % respectively. During
present study the standard drug indomethacin showed maximum percent inhibition at 4th hr
73.83 % at a dose of 10 mg/kg body weight. Percent anti-inflammatory activity in different
groups of rats based on an increase in paw volume at different time interval is shown in
(Tables 8, 9 and Figure 5)
Table 8. Average increase in paw volume (ml) at different hours in various groups and percent Anti-inflammatory activity as compared to control (n=6)
Group Time (hr)
1 2 3 4 5
Control 0.533 1.069 1.449 1.357 1.172
Standard 0.405 0.518 0.413 0.355 0.313
Treatment 1 (20 mg/kg body weight) 0.548 0.813 1.040 0.998 0.955
Treatment 2 (40 mg/kg body weight) 0.490 0.720 0.760 0.813 0.890
% activity - Standard 23.82 51.52 71.48 73.83 73.26
% activity –Treatment 1 (20mg/kg body weight) -3.07 24.01 28.23 26.47 18.49
www.wjpr.net Vol 4, Issue 05, 2015.
[image:16.595.14.592.100.246.2]2111 Table 9. Showing increase in paw volume (Mean ± SE) in different group of animals at the end of different hours (n=6)
C.D. - Critical Difference, S.E.M. - Standard Error Mean, C.V.- Coefficient of Variation
*p<0.01 significantly different as compared to control (n=6 in each group) .The test drug
were compared with the Indomethacin group. - Data are represented as Mean ± S.E.M.
Statistical analyze was done by one-way ANOVA
Figure 5. Percent inhibition of inflammation by Standard (Indomethacin), Treatment 1, Treatment 2 in carrageenan induced inflammation in rats
Group 1 hr 2 hr 3 hr 4 hr 5 hr
Mean S.E.(±) Mean S.E.(±) Mean S.E.(±) Mean S.E.(±) Mean S.E.(±) I (Control) 0.533* 0.022 1.070* 0.084 1.449* 0.097 1.357* 0.108 1.172* 0.061
II (Standard) 0.405* 0.036 0.518* 0.065 0.413* 0.053 0.355* 0.031 0.313* 0.039
III (Treatment 1) 0.542* 0.019 0.813* 0.087 1.042* 0.095 0.998* 0.092 0.955* 0.094
IV (Treatment 2) 0.487* 0.046 0.722* 0.034 0.762* 0.020 0.813* 0.014 0.892* 0.014
C.D. 0.096 0.211 0.219 0.217 0.177
S.E.M. 0.032 0.071 0.074 0.073 0.060
[image:16.595.144.454.331.502.2]www.wjpr.net Vol 4, Issue 05, 2015.
2112 Table 10. Average body weights (gm) of the rats during the study period of 28 day
S.D.- Standard Deviation S.E.-Standard Error
Table 11. Various Biochemical parameters at 0 day, 15th day and 29th day of study
C.D. - Critical Difference, S.E.M. - Standard Error Mean, C.V.- Coefficient of Variation *p<0.01 and **p<0.05 significantly different
at 15th dayand 29th day compared to control 0 day (n=6 in each group) - Data are represented as Mean ± S.E.M. -Statistical
analyze was done by one-way ANOVA followed by completely randomized design.
A
n
i.
N
o
. Days of Treatment
1 2 3 4 5 6 7 8 9 10 11 12 13 14 15 16 17 18 19 20 21 22 23 24 25 26 27 28
1 181 209 208 208 212 214 210 215 222 231 235 232 235 235 232 223 216 213 216 217 220 226 232 240 232 232 232 235 2 200 228 232 230 228 226 217 229 230 240 238 243 250 252 245 246 240 241 243 246 246 248 249 246 243 248 242 243 3 190 216 220 220 224 236 228 246 245 251 252 246 245 250 249 232 242 238 241 241 243 244 250 254 242 243 246 233 4 191 219 220 219 219 220 214 222 226 236 237 238 243 244 239 235 228 227 230 232 233 237 241 243 238 240 237 239 5 194 221 224 223 224 227 220 232 234 242 242 242 246 249 244 238 237 235 238 240 241 243 247 248 241 244 242 238 6 214 236 232 230 235 240 230 231 230 234 229 225 226 230 219 213 228 228 220 221 226 223 227 229 218 223 220 220 7 204 219 220 225 226 229 226 228 227 226 224 225 227 218 218 217 224 220 215 220 218 224 230 226 219 219 215 221 8 217 227 221 230 228 227 224 221 214 224 228 228 221 225 222 216 230 231 229 232 229 232 235 230 227 224 229 230 9 209 228 226 228 232 235 228 230 229 230 227 225 227 224 219 215 226 224 218 221 222 224 229 228 219 221 218 221 10 212 227 224 228 230 232 227 227 224 228 227 226 225 224 220 215 227 226 221 224 224 226 231 228 221 222 221 224 Avg. 182.
88 202.8
3 202.76 204. 08 205. 73 208. 35 202.7 0 208. 05 208. 08 213. 79 213.5 6 212. 88 214. 23 214. 94 210. 98 205. 94 210. 45 209. 24 208. 11 210. 26 211. 18 213. 53 217. 47 217. 77 211.2 9 212. 88 211. 68 211. 95 S.D. 12.
02 7.71 6.90 6.98 6.61 7.67 6.87 8.24 8.06 8.29 8.69 8.43 10.6 2 12.5 5 12.5 9 11.6
6 7.83 8.43 10.6
2 10.2
2 10.0
2 9.58 8.86 10.1
5 10.39 11.1
1 11.2
9 8.59 S.E. 3.804 2.440 2.185 2.208 2.093 2.427 2.174 2.607 2.552 2.624 2.750 2.669 3.360 3.971 3.986 3.689 2.476 2.667 3.362 3.235 3.172 3.033 2.802 3.213 3.289 3.515 3.571 2.717
Treat -ment
Blood Urea
Nitrogen Creatinine SGPT
Alkaline
Phosphatase Total Protein Albumin Globulin A:G Ratio Mean S.E.(±) Mean S.E.(±) Mean S.E.(±) Mean S.E.(±) Mean S.E.(±) Mean S.E.(±) Mean S.E.(±) Mean S.E.(±) 0 day 45.508* 2.114 1.075* 0.116 93.520** 13.249 129.963 14.224 6.262** 1.003 4.822* 0.650 1.542* 0.174 2.788* 0.503
15th day 52.275* 3.753 1.285* 0.079 76.500** 5.207 147.325 5.793 8.482** 0.139 6.285* 0.159 2.197* 0.094 2.928* 0.189
29th day 76.100* 7.363 2.122* 0.227 129.675** 18.428 141.525 9.575 6.097** 0.264 3.362* 0.174 2.735* 0.185 1.357* 0.172
C.D. 14.981 0.470 40.895 N/A 1.839 1.214 0.475 0.991
S.E.M. 4.925 0.154 13.444 10.449 0.604 0.399 0.156 0.326
www.wjpr.net Vol 4, Issue 05, 2015.
2113 Toxicity study
During the entire toxicity study (28 days), none of these animals was died and all the animals
were found clinically healthy with normal feeding and watering. The weights of the animals
were recorded daily are depicted in the Table 10. In the toxicity studies we have compared 15th
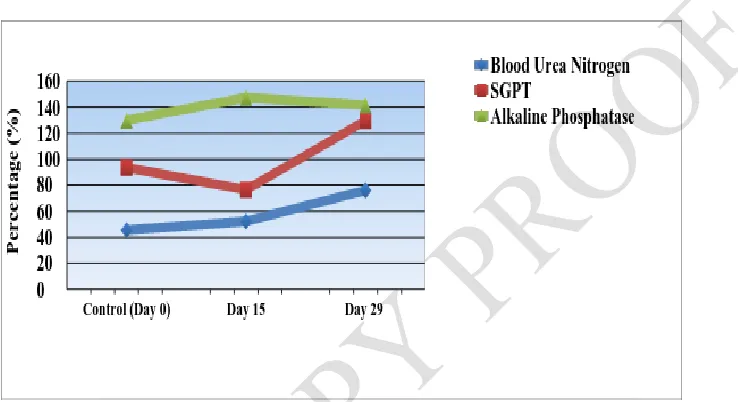
day and 29th day observed biochemical and hematological parameters with 0 day (Tables 11, 12
and Figure 6, 7, 8, 9).
[image:18.612.126.495.200.401.2][image:18.612.82.494.396.657.2]
Figure 6.Effect of oral administration of test drug on BUN, SGPT, Alkaline phosphatase in rats
www.wjpr.net Vol 4, Issue 05, 2015.
[image:19.842.7.837.81.261.2]2114 Table 12. Various Hematological parameters at 0 day, 15th day and 29th day of study
C.D. - Critical Difference, S.E.M. - Standard Error Mean, C.V.- Coefficient of Variation N/A-Not Applicable *p<0.01 and **p<0.05 statistical
significance at 15th day and 29th day compared to control 0 day (n=6 in each group) - Data are represented as Mean ± S.E.M.
- Statistical analyze was done by one-way ANOVA followed by completely randomized design.
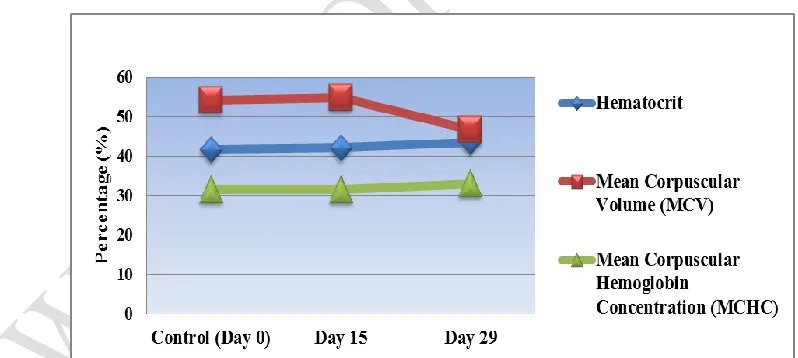
Figure 8. Effect of oral administration of test drug on Hematocrit, MCV, MCHC in rats
Treatment Hemoglobin
(Hb) WBC Platelets RBC
HTC (Hematocrit)
MCV (Mean Corpu- scular Volume)
MCH (Mean Corpuscular Hemoglobin)
MCHC (Mean Corpuscular Hemoglobin Concentration)
Mean S.E.(±) Mean S.E.(±) Mean S.E.(±) Mean S.E.(±) Mean S.E.(±) Mean S.E.(±) Mean S.E.(±) Mean S.E.(±)
0 day 13.000 0.056 11.135** 0.476 7.168 0.333 7.677* 0.078 41.583 0.498 54.155** 0.265 17.017* 0.171 31.473* 0.288
15th day 13.275 0.165 11.625** 0.880 8.012 0.383 7.690* 0.132 42.117 0.580 54.800** 0.762 17.217* 0.117 31.483* 0.271
29th day 14.733 0.986 14.383** 1.158 8.205 0.350 5.600* 0.486 43.575 2.989 46.642** 3.954 24.608* 1.256 33.100* 0.341
C.D. N/A 2.687 N/A 0.895 N/A 7.087 2.235 0.918
S.E.M. 0.578 0.883 0.356 0.294 1.781 2.330 0.735 0.302
[image:19.842.205.604.313.492.2]www.wjpr.net Vol 4, Issue 05, 2015.
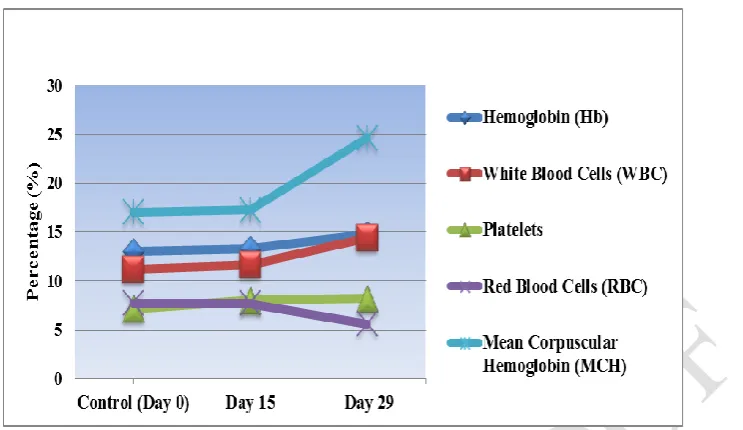
[image:20.595.126.498.68.283.2]2115 Figure 9.Effect of oral administration of test drug on Hb, WBC, Platelets, RBC, MCH in rats
Microscopical observations
On 29th day of study the representative rats were sacrified and all the vital organs were
observed for any macroscopic changes. All the organs were found to be normal as per the
gross observations. The organs such as liver, kidney, spleen and lungs were then collected
and examine for the histopathological study compared to the normal structures. The results
are presented in the slides 1, 2, 3, 4, 5, 6, 7, 8 and 9. The both liver and kidney sections showed the mild degeneration and congestion of pathological grade ‘+’ (H & E stain 400 X).
The spleen sections showed mild congestion and depopulation of Pathological grade‘+’ (H
&E stain 400 X).Whereas, lung did not show any changes in the histoarchitecture. Following
slides shows the changes of treated animal organs with healthy animal organs.
In the present study histopathological changes that observed in the liver were of mild degree
and may be found as the incidental changes; however lesions in spleen were indicative of
mild depopulations in some of the animals, which indicate mild immune suppression. The
lesions in kidneys and lung were of not related to drug administration.
www.wjpr.net Vol 4, Issue 05, 2015.
2116 Slide 1. Normal structure of
Liver
Slide 2. Liver photograph showing mild degeneration
(white arrow) and congestion (red arrow)
H&E stain 100X Pathological grade : +
Slide 3. Liver photograph showing mild degeneration
(white arrow) and congestion (red arrow)
H&E stain 400X Pathological grade : +
www.wjpr.net Vol 4, Issue 05, 2015.
2117 Slide 4. Normal structure of
Kidney
Slide 5. Kidney photograph showing mild degeneration (white arrow) and congestion
(red arrow) H&E stain 100X Pathological grade : +
Slide 6. Kidney photograph showing mild degeneration (white arrow) and congestion
www.wjpr.net Vol 4, Issue 05, 2015.
2118 Slide 7. Normal structure of
Spleen
Slide 8. Spleen photograph showing mild degeneration (white arrow) and congestion
(red arrow) H&E stain 100X Pathological grade : +
Slide 9. Spleen photograph showing mild degeneration (white arrow) and congestion
(red arrow) H&E stain 400X Pathological grade : +
DISCUSSION
www.wjpr.net Vol 4, Issue 05, 2015.
2119
The result of this study shows that the test drug (combination of Bromelain, Papain, Bacterial
Protease, with Rutin and Vitamin C) showed significant anti-inflammatory activity in
Carrageenan induced paw edema method.
Toxicity study
During the entire toxicity study(28 days), none of these animals was died and all the animals
were found clinically healthy with normal feeding and watering. The biochemical parameters
as well as hematological parameters were studied to find out the effect of test drug on the
kidney, spleen, liver and lung functions of the animals under study. All parameters were
studied on 15th day and 29th day of study and the values was compared to corresponding
values from the same animals at control 0 day.
Biochemical parameters
From the results it was observed that blood urea nitrogen which showed 45.508 ± 2.114 was
non-significantly increased to 52.275 ± 3.753 on 15th day of study and further increased
significantly to 76.100 ±7.363 by the end of study. Similarly, creatinine was increased
non-significantly to 1.285 ± 0.079 and 2.122 ± 0.227 on 15th day and 29th day respectively as
compared to its initial value of 1.075 ± 0.116.
The Serum Glutamate Pyruvate Transaminase (SGPT) levels were also increased
non-significantly and reached to 129.675 ± 18.428 on 29th day of study compared to its initial
values of 93.520 ± 13.249. Alkaline Phosphatase also increased non-significantly by the end
of study to 141.525 ± 9.575 over its initial level of 129.963 ± 14.224. Similarly, Total Protein
6.262 ± 1.003 increased significantly to 8.482 ± 0.139 on 15th day of study and thereafter
declined to significantly from this level to 6.097 ± 0.264 on 29th day of study showing
non-significant difference to the initial Total Protein levels. Albumin levels increased non-significantly
to 6.285 ± 0.159 on 15th day of study and again declined significantly to 3.362 ± 0.174 on
29th day of study and these levels were significantly less even to that of the initial albumin
level of 4.822 ± 0.650. However, the globulin levels which were 1.542 ± 0.174 increased
significantly to 2.197 ± 0.094 and 2.735 ± 0.185 respectively on 15th day and 29th day of
study.
Hematological parameters
From the results It was observed that, Hemoglobin, Platelets and Hematocrit increased
non-significantly by the end of study to 14.733 ± 0.986, 8.205 ± 0.350, 43.575 ± 2.989 over its
www.wjpr.net Vol 4, Issue 05, 2015.
2120
MCHC which showed 11.135 ± 0.476, 17.017 ± 0.171, 31.473 ± 0.288 was non-significantly
increased to 11.625 ± 0.880, 17.217 ± 0.117, 31.483 ± 0.271 on 15th day of study and further
increased significantly to 14.383 ± 1.158, 24.608 ± 1.256, 33.100 ± 0.34 respectively by the
end of study.
Similarly, RBC and MCV showed 7.677 ± 0.078, 54.155 ± 0.265 was non-significantly
increased to 7.690 ± 0.132, 54.800 ± 0.762 on 15th day of study and thereafter declined
significantly to 5.600 ± 0.486, 46.642 ± 3.954 respectively at the end of study.
CONCLUSION
Effervescent tablet containing Enzymes with Vitamin C can be prepared successfully by
using direct compression, dry granulation (slug) and wet granulation method. The
effervescent tablets with wet granulation method were found to be most feasible with good
stability among all the formulations with all different method, WG-8 after two months
stability shows assay of tablet 113.9%, 117.8% and 119.4 % compare to DC-6 (100.02%,
105.3%, 110.2%) and DG-7 (101.2%,107.8%,115.02%) at 400C/75 % RH,
300C/65 % RH, 250C/60 % RH respectively. Stability studies revealed that there were no
significant changes in hardness, thickness, effervescent time of WG-8 compared to DC-6 and
DG-7 trial formulations.
Also from the results obtained in the present study it can be concluded that, the test
preparation is having significant anti-inflammatory activity which was observed to be dose
dependent. Also, from the present study it was concluded that, the test material if given in the
dose of 2.5gm/kg in rats did not show any remarkable toxic effects except some increase in
the biochemical and hematological parameters which were also confirmed by the
histopathological study. However, as per the observed data report histopathological changes
that observed in the liver were of mild degree and may be found as the incidental changes;
however lesions in spleen were indicative of mild depopulations in some of the animals,
which indicate mild immune suppression. The lesions in kidneys and lung were of not related
to drug administration.
ACKNOWLEDGEMENT
The authors are greatful to Dean of Pharmacy, Pacific University for their supporting through
www.wjpr.net Vol 4, Issue 05, 2015.
2121
Toxicology Dept. College of Veterinary and Animal Sciences, Udgir for providing necessary
facility for preclinical study. I sincerely express my gratitude to research institutes for
providing excellent infrastructural facility for undertaking this research work. Also thankful
for to all the vendors who gave us the free samples for research work.
REFERENCES
1. Database for effervescent tablet-key fact from
http://www.amerilabtech.com/wp-content/uploads/2012/01/EffervescentTabletsKeyFacts.pdf
2. Bhagavan HN, Wolkoff BI. Correlation between the disintegration time and the
bioavailability of vitamin C tablets. Pharm Res. 1993; 10: 239-242.
3. Yassin, A.E.B. Optimization of the biological availability of certain medicament. Ph.D.
dissertation. Al-Azhar University, 1996.
4. Nuernberg, B. and Brune, K. Buffering the stomach content enhances the absorption of
diflunisal in man. Biopharm. Drug Disp., 1989; 10: 377-387.
5. Eichman, J.D. and Robinson, J.R. Mechanistic studies on effervescent-induced
permeability enhancement. Pharmaceutical Research, 1998; 15(6): 925-930.
6. Database for vitamin effervescent tablets available from
http://www.iceberglabs.net/effervescent.htm
7. Lieberman H. A., Lachman L., Schwartz J. B., Pharmaceutical Dosage Forms: Tablets,
Vol.1, 2, Marcel Dekker, Inc. NY, 1993; 285.
8. James Selim, US Patent, US6544755 B2, 2003.
9. Parikh,D.M.,Handbook of Pharmaceutical Granulation, Marcel Dekker Inc.,New York,
1997.
10.Sanada H, Yonezawa Y and Danjo K. Preparation and evaluation of compressed tablet
rapidly disintegrating in the oral cavity. Chem Pharm Bull., 1996; 44: 2121-2127.
11.Kevin Bryan, George Lyle online Demonstration Equipment Guide - Teacher's
Determination of the mass of carbon dioxide evolved by Alka Seltzer using an electronic
analytical balance http://www.csun.edu/scied/4discrpeantevent/ co2_evo_alka_ seltzer/
co2_ evo_alka_seltzer.htm
12.Winter, C.A; Risley, E.A. and Nuss. G.W. Carrageenan induced edema in hind paw as an
assay for anti-inflammatory drugs. Proc Soc Exp Biol. Med., 1962; 111: 544 – 547.
www.wjpr.net Vol 4, Issue 05, 2015.
2122
14.Nantel F., Denis D., Gordon R., Northey A., Cirino M., Metters K.M., Chan C.C.
Distribution and regulation of cyclooxygenase-2 in carrageenan-induced
inflammation. Br. J. Pharmacol, 199; 128: 853–859.
15.Di Rosa M. Biological properties of carrageenan., J. Pharm.Pharmacol, 1972; 24: 89–102
16.Di Rosa M., Giroud J.P., Willoughby D.A. Studies on the mediators of the acute
inflammatory response induced in rats in different sites by carrageenan and turpentine. J.
Pathol,1971; 104: 15–29.
17.Di Rosa M., Papadimitriou J.M., Willoughby D.A. A histopathological and
pharmacological analysis of the mode of action of nonsteroidal anti-inflammatory drugs.
J. Pathol., 1971; 105: 239–256.
18.Garcia Leme J., Hamamura L., Leite M.P., Rocha E Silva M. Pharmacological analysis of
the acute inflammatory process induced in the rat's paw by local injection of carrageenan
and by heating. Br. J. Pharmacol, 1973; 48: 88–96.
19.Warawanna, B.; Wisut, W.; Pornchai, R and Pasarapa, T. Synthetic Curcumin Inhibits
Carrageenan-Induced Paw edema in Rats. J. Health Res., 2009; 23 (1): 11-16.
20.Vasudevan, M.; Kunnam, K. K., and Parle, M. Antinociceptive and anti-inflammatory
properties of Daucus carota seeds extract. J. Health Sci., 2006; 52(5): 598-606.
21.Pandurangan, A., Khosa R. and Hemalatha, S. Evaluation of anti-inflammatory and
analgesic activity of root extract of solanum trilobactum Linn. Indian Journal of
Pharmaceutical Research., 2007; 7(3): 217-221
22.Organization for Economic Co-operation and Development (OECD) Guideline no.-407
Repeated Dose 28-Day oral toxicity studies in rodents,
http://www.oecd-
ilibrary.org/environment/test-no-407-repeated-dose-28-day-oral-toxicity-study-in-rodents_9789264070684.
23.Organization for Economic Co-operation and Development (OECD) Guideline no. - 425
Acute oral toxicity Up-and-Down procedure.
http://www.oecd-ilibrary.org/environment/test-no-425-acute-oral-toxicity-up-and-down procedure _
9789264071049
24.Sorg, D.A. and Buckner.Simple method of obtaining venous blood for small laboratory,
Proc. Soc. Exp. Bio. Med., 1964; 115: 1131-1132.
25.Bergmeyer HU, Brent E., Methods of enzymatic analysis, Vol.2, New York, USA: Verlag
Chemie Weunheun, Academic Press., 1974.
26.Benjamin, M.M. Outline of clinical veterinary pathology, USA: Colorado State
www.wjpr.net Vol 4, Issue 05, 2015.
2123
27.King J. The hydrolases - acid and alkaline phosphates: Practical clinical enzymology,
(London, UK: Nostrand Company), 1965; 191-208.
28.Schalm OW, Jain NC and Carroll GH., Veterinary Haematology, Belmont, CA:
Wadsworth Publishing, 1975.
29.Wintrobe HM, Lee GR, DR Boggs, TC Bithel, Ethens JW, J Foerester, Clinical
Haematology, Philadelphia P.A: Lea and Febiger, 196.
30.Lowry OH, Rosebrough, Far AL, Randall RJ, Protein measurement with the folin phenol