MULTIVALENT IONS IN POLYMER ELECTROLYTES
Mary Anne Mehta
A Thesis Submitted for the Degree of PhD
at the
University of St Andrews
1993
Full metadata for this item is available in
St Andrews Research Repository
at:
http://research-repository.st-andrews.ac.uk/
Please use this identifier to cite or link to this item:
http://hdl.handle.net/10023/15517
MULTIVALENT IONS
IN
POLYMER ELECTROLYTES
A thesis presented for the degree of
Doctor of Philosophy
in the Faculty of Science of the University of St. Andrews
by Mary Anne Mehta, B.A.
December 1992 Centre for Electrochemical
and Materials Science,
ProQuest Number: 10171045
All rights reserved
INFORMATION TO ALL USERS
The quality of this reproduction is dependent upon the quality of the copy submitted.
In the unlikely event that the author did not send a com plete manuscript and there are missing pages, these will be noted. Also, if material had to be removed,
a note will indicate the deletion.
uest
ProQuest 10171045
Published by ProQuest LLO (2017). Copyright of the Dissertation is held by the Author.
All rights reserved.
This work is protected against unauthorized copying under Title 17, United States C ode Microform Edition © ProQuest LLO.
ProQuest LLO.
789 East Eisenhower Parkway P.Q. Box 1346
DECLARATION
I, Mary Anne Mehta hereby certify that this thesis has been composed by
myself, that it is a record of my own work, and that it has not been accepted in partial or complete fulfilm ent of any other degree or professional qualification.
Signed: Date: (4%.
I was admitted to the Faculty of Science o f the University o f St.Andrews under Ordinance General No. 12 on 1st January 1991 and as a candidate for the
degree of PhD on 1st January 1991.
Signed: Date:
CERTIFICATION
I hereby certify that Mary Anne Mehta has spent twelve tenns of research work
under my supervision and that she has fulfilled the conditions o f the Resolution and Regulations appropriate to the degree of Doctor o f Philosophy.
December 1992 Signed:
LIBRARY DECLARATION
In submitting this thesis to the University of St.Andrews I understand that I
am giving permission for it to be made available for use in accordance w ith the regulations o f the University Library for the time being in force, subject to any
copyright vested in the work not being affected thereby. I also understand that the title
and abstract w ill be published, and that a copy of the work may be supplied to any
bona fide library or research worker.
Chapter 1 AN INTRODUCTION TO POLYMER ELECTROLYTES
1
L I Introduction ... 1
1.2 The morphology and structure of simple polym ers... 3
1.2.1 The amorphous state ... 3
1.2.2 The glass transition ... 4
1.2.3 The crystalline state ... 4
1.2.4 Spherulites ... 6
1.3 Polymer electrolyte formation, morphology and structure 10 1.3.1 N otation ... 10
1.3.2 Polymer electrolyte form ation ... 10
1.3.3 The hard-soft-acid-base theory ... 13
1.3.4 The nature of the polymer h o s t... 14
1.3.5 The morphology o f polymer electrolytes... 17
1.4 The structure of crystalline complexes ... 19
1.5 Phase diagrams ... 23
1.5.1 The PEOiLiCFgSOg system ... 25
1.5.2 The PEO:NaSCN system ... 27
1.5.3 The PEO:ZnCl2 system ... 30
1.5.4 The PE0 :Cu(CF3S0 3 ) 2 system ... 31
1.5.5 The PEO:Eu(CF3S03)3 system ... 32
1.6 Aspects of ionic conductivity in polymer electrolytes... 33
1.6.1 Introduction ... 33
1.6.2 W illiam s, Landel and Ferry (W LF) th e o ry... 34
1.6.3 Free volume theory ... 35
1.6.4 Configurational entropy theory ... 37
1.6.5 Dynamic bond percolation (DBP) th e o ry... 40
1.7 Transference numbers in polymer electrolytes... 42
Chapter 2 FUNDAMENTAL PRINCIPLES OF ELECTROCHEMISTRY ... 52
2.1 Introduction ... 52
2.2 Mass transport and electron transfer ... 52
2.3 Derivation o f the Butler-Volmer equation... 54
2.3.1 High positive overpotentials ... 55
2.3.2 High negative overpotentials ... 55
2.3.3 Small overpotentials ... 56
2.4 The Tafel equations ... 56
2.5 Linear diffusion to a planar electrode... 58
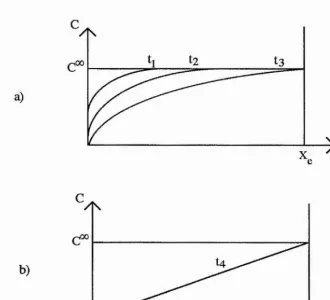
2.6 The potential step experiment ... 59
2.7 Phase form ation ... 62
2.7.1 Introduction ... 62
2.7.2 N ucléation ... 62
2.7.3 D iffusion controlled growth ... 65
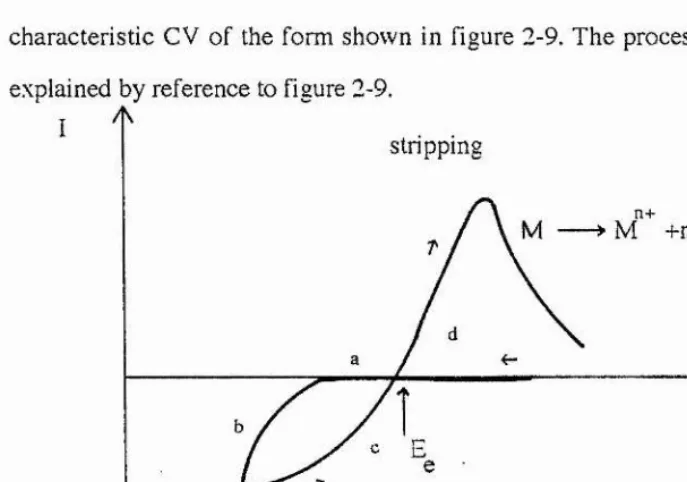
2.8 C yclic Voltam m etry ... 67
2.8.1 Introduction ... 67
2.8.2 The cyclic voltammetry experim ent... 67
2.8.3 Reversible reactions ... 6 8 2.8.4 Irreversible reactions ... 69
2.8.5 Phase formation in cyclic voltam m etry... 71
Chapter 3
THE THEORY OF AC IMPEDANCE MEASUREMENTS 733.1 Complex impedance plots ... 73
3.1.1 The resistor ... 74
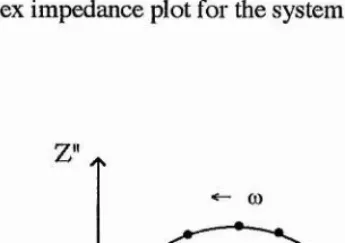
3.2 Simple systems ... 76
3.2.1 A resistor and capacitor in series ...76
3.2.2 A resistor and capacitor in parallel ...77
3.3 Ac impedance measurements on polymer electrolytes... 79
3.3.2 Non blocking electrodes ...82
Chapter 4
E X PE R IM E N TA L ... 874.1 Preparation o f polymer electrolytes ... 87
4.1.1 Solvent casting ... 87
4.1.2 Cryogrinding / Hot pressing ... 87
4.1.3 A comparison of the solvent casting and hot pressing methods for polymer electrolyte preparation... 89
4.2 Preparation o f salts ... 91
4.2.1 Lithium triflate and calcium trifla te ... 91
4.2.2 Europium (III) trifla te ... 91
4.2.3 Europium (II) trifla te ... 92
4.2.3.1 Preparation of the Jones redactor 92 4.2.3.2 Preparation of europium (II) sulphate 92
4.2.3.3 Preparation of europium (II) carbonate 94
4.2.3.4 Preparation of europium (II) trifla te 94
4.3 Instrum entation ... 95
4.3.1 C ell design ... 95
4.3.2 Conductivity measurements ... 96
4.3.3 Cyclic voltammetry and potential step experiments 97 4.3.4 D ifferential scanning calorimetry ... 97
4.3.5 Powder x-ray diffraction ... 97
Chapter 5
THE PEOiCALCIUM TRIFLATE S Y S TE M ... 985.1 Experim ental ... 98
5.1.1 Sample preparation ... 98
5.1.3 D ifferential scanning calorimetry ... 98
5.1.4 Conductivity measurements ... 99
5.2 Results ... 99
5.2.1 X-ray diffraction at room temperature... 99
5.2.2 D ifferential scanning calorimetry ...100
5.2.2.1 Differential scanning calorimetry -1st heating cycle ... 104
5.2.2.2 Differential scanning calorimetry -2nd heating cycle ... 107
5.2.3 X-ray diffraction at elevated temperatures ... 118
5.2.4 Conductivity measurements ... 120
5.3 Determination of the phase diagram for the PEO:Ca(CF3SOg) 2 system ... 123
5.3.1 The proposal ... 123
5.3.2 The rationale ... 125
5.4 Discussion of the conductivity results ... 131
C hapter 6 THE PEOrNICKEL IO DIDE S Y S TE M ... 134
6.1 Sample preparation ... 134
6.2 D ifferential scanning calorimetry ... 134
6.2.1 Experim ental ... 134
6.2.2 Results and discussion ... 135
6.3 X -ray diffra ctio n ... 139
6.3.1 Experim ental ... 139
6.3.2 Results and discussion ... 139
6.4 C onductivity measurements... 141
6.4.1 Experim ental ... 141
6.4.2 Results and discussion... 141
6.5 C yclic voltam metry ... 145
6.5.2 Results and discussion ... 145
6.5.2.1 Analysis of the Tafel P lo t... 148
6.5.2.2 The heterogeneous rate constant... 149
6.5.2.3 Summary of Tafel plot analysis... 150
6.5.2.4 Ac impedance data ... 151
6.5.3 Conclusion ... 153
6 . 6 The potential step experiment ... 154
6.6.1 Experim ental ... 154
6.6.2 Results and discussion ...154
6.6.2.1 Calculation of the diffusion coefficient 156 6.7 Dc polarisation experiments ... 158
6.7.1 Experim ental ... 158
6.7.2 Results and discussion ... 159
6.7.2.1 Untreated electrodes ... 159
6.7.2.2 Polished electrodes (I) ... 160
6.1.23 Polished electrodes (II) ... 162
6.7.3 Sumniary of cationic current fraction data...164
6 . 8 Conclusion ... 165
C hapter 7 THE PEO:EUROPIUM TRIFLATE SYSTEM ... 166
7.1 Experim ental ... 166
7.1.1 Characterisation o f europium salts ... 166
7.1.2 Preparation o f samples ... 166
7.1.3 C yclic voltam metry ... 168
7.1.4 Ac impedance measurements ... 168
7.2 Results ... 169
7.2.1 Cyclic voltammetry with LiCf^SOg as a supporting electrolyte ... 169
7.2.2 Cyclic voltammetry with LiClO^ as a supporting electrolyte ... 175
7.2.2 Ac impedance measurements ... 176
Chapter 8
THE PEO:COBALT THIOCYANATE SYSTEM ... 1828.1 Experim ental ... 182
8.1.1 Sample preparation ... 182
8.1.2 D ifferential scanning calorimetry ... 182
8.1.2 Powder x-ray diffraction ... 182
8.1.4 Conductivity measurements ... 183
8.1.5 U V -visible spectroscopy ... 183
8.2 Results ... 183
8.2.1 D ifferential scanning calorimetry ... 183
8.2.2 X-ray diffraction ... 186
8.2.3 Conductivity measurements ... 188
8.2.4 U V -visible spectroscopy ... 193
8.3 Discussion ... 193
Chapter 9
SUM M ARY ... 201REFERENCES ... 205
Appendix 1
The structure o f the polyethylene oxide: sodium perchlorate complex PEOgNaClO^ from powder x-ray diffraction ... 212Appendix 2
M aterials ... 216A C K N O W L E D G E M E N T S
Thanks are due
to:-my supervisor. Dr. Peter Bruce, fo r his advice and support over the years. In
particular for the time that he gave up from his busy schedule in order to proof read this thesis.
Dr. Stephen Campbell fo r many helpful discussions and advice w ith the electrochemical aspects of the project.
Dr. Philip Lightfoot for assistance with the x-ray diffraction.
Dr. Jan Nowinski for getting me started in the laboratory.
I am also grateful to Jie Shi, Professor Colin Vincent and the members of C.E.M.S.
for many helpful discussions, my fam ily for supporting me throughout my ‘extended’ career as a student and the S.E.R.C. for financial support.
A B ST R A C T
The electrochemical, thermal and structural properties of polyethylene oxide (PEO) based polymer electrolytes containing multivalent ions were investigated.
The phase diagram for the PEO: Ca(CFgS 0 3 ) 2 system was determined by x-ray
diffraction and differential scanning calorimetry techniques. Precipitation of the salt
from the system at high temperatures was directly observed by variable temperature x-
ray diffraction. This was ascribed to a negative entropy of dissolution o f the salt in the polymer. A new crystalline complex PE0 (5Ca(CF3S0 3)2, which exhibits a phase
transition between two polym orphic forms was observed. The temperature dependence of ionic conductivity was related to the phase diagram.
Redox behaviour of the PEO:Nil2 system was probed. Motion o f the N i(II) species
through the system was extremely slow as evidenced by the low effective diffusion coefficient (1.82 x cm^s"!) and cationic current fraction (F+ < 0.1). Deposition
of nickel from the polymer was characterised by instantaneous nucléation followed by
three dimensional diffusion controlled growth.
Investigation o f the redox behaviour of the PEO:Eu(Cp3S0 3 ) 3 system indicated that
reduction of Eu^+ followed an ec mechanism. Evidence was obtained fo r extremely slow diffusion of Eu^+ containing species ( D g f f 3.66 x 10“^^cm V l) through the
system and slow kinetics of electron transfer.
Thermal studies of the PEO:Co(SCN)2 system indicated that the glass transition
temperature (Tg) was grossly elevated by the presence of Co(SCN)2 in the polymer.
The absence of a crystalline PEO:Co(SCN)2 complex was ascribed to the high Tg
which leads to slow crystallisation kinetics. UV-visible spectra indicated that the Co^+
ion was tetrahedrally coordinated in the system at low salt concentrations.
The structure of the PEO3NaC1 0^ crystalline complex was reported as a subsiduary
CHAPTER 1
AN ÏNTRODTJCTION TO PO L Y M E R E L E C T R O L Y T E S
1.1
Introduction
A polymer electrolyte is an ionic conductor formed by the dissolution o f a salt in a high molecular weight polymer host. Interest in the field was generated when it was
dem onstrated!^ that dissolution of alkali metal salts in polyethylene oxide (PEO) produced materials w ith quite significant conductivities. The earliest work
concentrated on developing lithium ion conductors with a view to producing thin film
rechargeable lithium batteries. This is still the main technological focus of the work. Under certain conditions, polymer electrolytes formed from high molecular weight
polymer hosts have many of the macroscopic properties of a solid with some of the
microscopic properties of a liquid. This gives them several advantages over classical
liquid electrolytes.
i) There are not the leakage problems associated with liquid electrolytes. ii) The materials are often soft and form a good interfacial contact with the
electrodes.They can often accomodate the volume changes associated with
the ion-electrode exchange processes.
iii) The materials can be produced in a variety of geometries including thin films.
iv) The manufacturing technology for a polymer electrolyte battery is very
different from that of conventional liquid electrolyte cells. Polymer electrolyte batteries can be manufactured by highly automated multi-layer
processes.
Increased activity in the field of polymer electrolytes quickly led to a greater understanding of the properties of the systems under investigation. It was a natural
Conductivity is one o f the most important properties of a polymer electrolyte. The
most general expression for the conductivity at a given temperature is given by
expresssion 1-i)
o(T) = ^ n. q. p.
1 1 - i)
Where nj is the number o f charge carriers i, qj is their charge and m their m obility.
Interest in the study o f multivalent ions in polymer electrolytes was stimulated by the
possibility that these materials, containing highly charged species, might have slightly enhanced conductivities. It came as no surprise to discover that many m ultivalent cations were essentially immobile in polymer electrolyte systems^. These findings
however sparked o ff new interest in the possibility o f developing systems that were
purely anionic conductors.
The frontiers of polymer electrolyte chemistry continue to be pushed back today.
Current work in the field is progressing in a variety of different directions o f which a few examples follow. The most recent developments in powder X-ray diffraction have made it possible for the structure of polymer electrolyte crystalline complexes to be determined for the first time using this method. This gives valuable insight into the
nature of the bonding and coordination in the crystalline state. Many questions
however remain unanswered as to the type o f charge carriers responsible fo r
conduction in the amorphous phase. The nature of these ions, which may be single ions, triples or other m ultiples, has been probed by NMR^, IR^, and Raman
spectroscopy^'^. Detailed mechanisms for ion transport in many systems have yet to be determined. In particulai*, work in this laboratory has been carried out to investigate
how ion transport processes change with molecular weight of the host polymerR
redox and mass transport properties. The phase diagram for the PEO-calcium
trifluoromethane sulphonate system was investigated and correlated with conductivity measurements for a variety of compositions at different temperatures. These in turn were compared to conductivity data obtained from systems containing Ni^+ and Co^+.
Finally, the structures of some complexes formed between PEO and alkali metal salts
were investigated by powder X-ray diffraction.
The follow ing sections contain a brief treatment o f the background and theory
behind the work carried out in this investigation.
1.2 The morphology and structure of simple polymers
The term 'morphology' refers to the structure, arrangement and physical form o f
polymer molecules in the system. In general there are two types of morphology that are characteristic of polymer systems; the amoiphous state and the crystalline state.
1.2.1 The amorphous state
This is characterised by an almost complete lack of ordering o f the molecules. It
occurs in crystalline polymeric systems above their melting temperature. However some polymers, due to their structure , show no tendency to become crystalline. This
gives rise to systems that have both a liquid and solid amorphous state. In a solid
amorphous state, molecular motion is restricted to very short range vibrations and rotations. The liquid or molten amorphous state is characterised by considerable
conformational freedom which arises from rotation about chemical bonds as well as significant segmental motion of the polymer chains. If a molten polymer remains
amorphous upon cooling to the solid state, the process is called vitrification, so called
1.2.2 The glass transition
When a solid amorphous polymer or glass is heated, the kinetic energy o f the molecules increases. As mentioned above, motion o f the molecules is restricted to short range vibration and rotation. The system thus retains its glass like structure. Above a certain temperature, the glass transition temperature ( Tg ), longer range
motion becomes possible. There is greater rotational freedom and segmental motion of the polymer chains . For segmental motion to occur, it is necessary for approximately
20 to 50 atoms to move. The space between the molecules ( free volume ) is observed to increase above the glass transition temperature. A t the glass transition temperature,
no discontinuities are observed if the entropy or volume of the system is measured as a
function of temperature. A change is however observed in the first derivative of this
function i.e. there is a change in the rate of change of entropy w ith temperature. The glass transition is thus termed a 2nd order transition and is accompanied by a change
in the heat capacity of the system.
1.2.3 The crystalline state
One of the requirements for crystallinity is that the polymer chains must be capable
of packing closely together in a regular array e.g. as stacks o f planar zig-zags or
helices. Thus, in such systems, there may be regions in the polymer matrix where the molecules have arranged themselves into a thermodynamically favourable alignment.
This can be described by the fringed micelle model in which the regions of crystallinity
are much smaller than the length of the polymer chains. Thus, one particular polymer
chain may extend through a number of crystalline regions. The crystalline regions or
micelles are themselves surrounded by an amorphous network.
Crystallization may be induced in a number o f ways e.g. cooling o f the molten polymer, evaporation of a polymer solution or annealing o f the polymer in an inert
atmosphere or under vacuum. Each method allows the polymer molecules the vibrational and rotational freedom to reorient themselves into a crystalline
morphology.
Figure 1 -1 The fringed micelle model
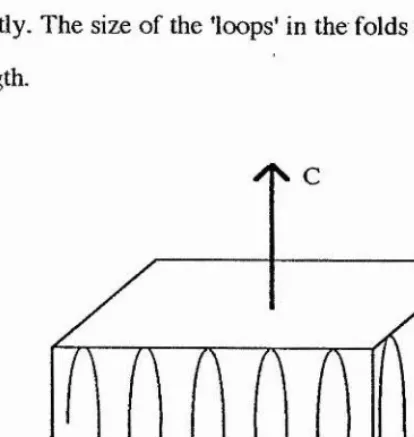
The crystalline regions have been shown to have a plate-like or lamella structure
composed o f polymer chains folded back upon themselves. The chain axis or (c-axis) of the molecules is oriented perpendicular to the lamella.This is called the folded chain
lamella model where the thickness o f the lamellae is very much less than the length o f
the polymer chains. Each fold in the lamella may be connected either adjacently or non-adjacently. The size o f the ’loops' in the folds may be o f either uniform or non-
uniform length.
[image:20.617.171.378.465.684.2]b)
[image:21.612.124.504.96.380.2]c)
Figure 1 -3 Fold connections in the folded chain lamella model, a) adjacent uniform
folds, b) adjacent non-uniform folds and c) non-adjacent non-uniform folds.
It can be seen from figure 1 -3 that an increasing amount of amorphous material is
associated with the lamellae upon proceeding from a) to b) to c).
The onset o f crystallisation is called nucléation and may occur either randomly in the
polymer m atrix ( homogeneous nucléation ), or at the interface w ith an 'im purity'. 'Impurities' are sometimes purposely added to act as nucleating agents.
1.2.4 Spherulites
A variety of crystalline morphologies have been identified by X-ray diffraction
a radial pattern. The fibrils in the spherulites consist o f chain folded lamellae, the
polymer chain axes being perpendicular to the radial direction. Branching in the lamellae causes splaying out of the fibrils. This gives the spherulite its 3-dimensionaI
nature. A spherulite w ill continue to grow until it impinges on other spherulites.
Figure 1 -4 Stages in the formation of a spherulite
It is found that crystalline polymers containing spherulites are tough and can be
deformed under stress. This results from the fact that neighbouring lamellae are bound
together by molecules which may be embedded in more than one crystalline region. There are thus layers o f amorphous material between the lamellae which remain
uncrystallised or crystallise only very slowly. This amoiphous material is reproducibly
present in systems that are regarded as 'crystalline'. For most situations, such systems can be considered as consisting o f a single phase if the time-scale fo r any
measurements is short with respect to any changes in crystallinity. It should however
be appreciated that such polymer systems never achieve true thermodynamic
equilibrium.
Other crystalline morphologies not considered in detail here include the drawn
fib rilla r morphology and the shish-kebab or epitaxial morphology. The former may occur when drawing polymer fibres and the latter occurs during crystallisation of
OJ
(N
CO
CO
cs
CO
CO
CO
o
J D
cn
\o
C/3
CO
3
+ + + + ++
> •
+ + + + +
+ + + + +
+
%
+ + + + + ++ + + + +
+
%
+• + + + ++ + + + +
%
+ + + + ++ + + + +
+ + + + +
1
+ + + + +i
+ + + + +
%
+ + + + + +(T L CQ
+ +
+
+ + + + +
i +
%
+ + + + .+8
*
1.3
Polymer electrolyte formation, morphology and structure
1.3.1 Notation
The polymer electrolyte systems which are the subject of the current investigation are all formed by the dissolution of a salt in high moleculai' weight (M W = 5x10^ ) PEO. The notation adopted in this work is to express the composition as a ratio of the PEO repeat units, ( CH2CH2O ), to salt. Thus, the formula PEO^Nil2 represents the
composition where there are four PEO repeat units for each salt unit,
i.e ( CH2CH2O )^N il2 . Occasionally, it is necessary to express the composition in
terms of a mol fraction or a mass fraction ( X ggu ). The mol fraction of salt is given
by the following
expression:-Mol fraction o f salt = ^o. of mois o f salt
(No. mois of polymer + No. mois o f salt)
The mass fraction of salt in a polymer electrolyte, PEO^Salt, is given
by:-RMM,Salt 'Salt RMMg^ij + ( n X 44 )
where RMMg^it is the relative molecular mass o f the salt and 44 is the 'relative
molecular mass' of the ethylene oxide unit.
1.3.2 Polymer electrolyte formation
A wide variety o f salts w ill dissolve in PEO ( and other polymer hosts ) to form a
polymer electrolyte as shown in table 1 -1 . For dissolution to occur, the free energy
change for the process must be favourable. Thus, the polymer-salt interaction must be significant enough to compensate for the loss of lattice energy of the salt and the
polymer-polymer interaction. When a salt dissolves in a solvent, anion stabilisation
particular ) have no hydrogen bonding capabilities and thus the primary polymer-salt interaction arises from interaction between the polymer and the cation. This may be viewed as an electrostatic interaction between the cation and the negative end of dipolar
groups on the polymer, or as a covalent bond formed between the cation and the lone
pairs o f the coordinating donor atom ( e.g. N or O ) on the polymer.
For a given polymer host, polymer electrolyte formation w ill be most favourable for salts with low lattice energies. Thus anions should ideally be large with a low charge
density. Furthermore, they should preferably be weak bases and have little tendency to form ion pairs to enable the polymer to compete more effectively for the cation. The most suitable choices of anion on this basis include CIO" , CF^SO^ , BF^ and
AsF“ . No polymer electrolytes are observed to form with fluorides due to their high
6
lattice energies. Lithium chloride is the only chloride capable of form ing a polymer electrolyte, the high lattice energy being compensated by the large enthalpy o f
solvation of the strongly solvated lithium ion.
Both Papke et api and W righti^.is adopted a more quantitative approach towards
predicting the occurrence of complex formation, W right proposed that formation o f a complex PEOgMX would occur
if:-E(complex) < E(3EO) + E(MX)
where E(complex), E(3EO) and E(M X) were the lattice energies of the complex, the appropriate length o f crystalline polymer and the salt respectively. Entropy changes
upon complexation were however neglected in this treatment. He was able, using
computational methods, to determine the contribution to each component in the equation for the formation of the complex PEOgNal. Estimates of the corresponding
energetic parameters for other systems enabled more quantitative predictions fo r complex formation to be made. What became clear from the work o f both groups was
the importance o f the magnitude of the salt lattice energy in determining whether
and cation, complex formation would only occur for salts with lattice energies below a
certain threshold value. This is illustrated in table 1-2 for some alkali metal salts.
Li+ Na+ K+ Rb+ Cs+
F- no no no no no
1036 923 823 785 740
ci- yes no no no no
853 786 715 689 659
CH3COO- no - -
-881 763 682 656 (682)
NO3- - no - - no
848 756 687 658 625
NO2- - no - - no
_ 748 648 765 (596)
B r yes yes no no no
807 747 682 660 631
N3- - no - -
-818 731 658 632 604
BH4 - yes - -
-(778) (703) (665) (648) (628)
I- yes yes ? no no
757 704 644 630 604
SCN- yes yes yes yes yes
807 682 616 619 568
CIO4 yes yes - -
-723 648 602 582 542
CF3SO3- yes yes yes yes yes (^ 25) (^650) (:S605) (:&585) (&550)
BF4- yes yes -
-(699) 619 631 605 556
BPI14- yes yes yes yes yes
(:g700) (^630) (:S630) (^630) (^ 5 0 )
Table 1-2. A comparison o f PEO / Salt complex formation w ith lattice energies (kJ/mol) o f the pure salt (Data taken from reference 14)
13.3 The hard-soft-acid-base theory
As the variety of systems under investigation increased an attempt was made to rationalise the theory behind polymer electrolyte complex formation and the efficiency of the material as an electrolyte. Many w o r k e r s ^^ turned to the hard-soft-acid-base
(HSAB) principal devised by Pearson^^ to predict not only whether a complex was likely to fom i, but whether the ions were subsequently likely to be mobile. The HSAB
theory classified Lewis acids and bases as either hard or soft as follows
Hard bases :- Small non-polarisable species with highly electronegative donor atoms.( E.g. ethers, amines and CIO” )
4
Soft bases :- Highly polarisable species with less electronegative donor atoms.( E.g. SCN' and I" )
Hard acids:- Small, non-polarisable species that have no unshared electrons in
their valence shell ( Eg. Ca^+ and Mg^+)
Soft acids :- Large, polarisable species with unshared electrons in their valence
shell. (Eg. Ag+ and Hg^+ )
In general, the most stable complexes are formed between hard acids and bases and between soft acids and bases. PEO can be considered as a regular array of hard bases
( the donor atom being the ether oxygen ). On this basis, it is likely to form its most
stable complexes with hard Lewis acids such as Ca^+, Mg^+ and Li+. Soft Lewis acids such as Ag+ and Hg^+ are likely to interact only weakly w ith PEO and form
relatively unstable complexes. It should be noted however, that although complex formation (i.e. salt dissolution ) may be very favourable between PEO and hard Lewis acids, the complex may be so stable that the cations may subsequently be immobile. Reference to equation 1-i) indicates that this w ill give rise to a poor
electrolyte. Bruce et al.^^ have postulated that hard-soft interactions between the
polymer and salt favour more rapid cation exchange between ligand sites, thus
enhancing mobility.
In summary it can be seen that to form a good polymer electrolyte, there must be a
compromise between two
factors:-a) A strong cation-polymer interaction to compensate for the loss of salt lattice energy.
b) Cation-polymer bond lability to facilitate ion transport.
1.3.4 The nature of the polymer host
There are three important criteria governing the suitability of a polymer to act as a
host.
a) The polymer molecules must have polar groups or donor atoms capable of forming coordinate bonds with the cation.
b) The distance between coordinating groups must be such as to maximise
polymer-cation interaction.
c) The polymer must be capable of adopting low energy conformations to allow multiple inter- and intra- molecular coordination.
These factors are discussed with reference to specific polymer hosts.
In itia lly, the choice of potentially effective polar groups for polymer electrolytes
would appear to be limitless, however, many of those initially proposed are found to
be too electrochemically active e.g. sulphoxides, ketones, nitriles etc. It is for this reason that so much emphasis has been put into the study of polyethers. O f these,
polyethylene oxide (PEO) and polypropylene oxide (PPO) have been the most comprehensively studied. The low glass transition temperature for PEO (-60 °C) is indicative of a flexible polymer backbone that is capable of adopting the conformations
necessary to complex the salt with ease. Despite the increased donor power o f oxygen linked to a secondary carbon atom, Armand et aP demonstrated the greatly reduced
solvating power of PPO compared to PEO. This was partly ascribed to the steric hindrance of the CH3 group interfering with the close approach of two polymer
(CH2CH2CH2 0)n, form polymer electrolytes. Mark^"^ has in fact discussed the highly
constrained nature o f the PMO molecule. The reluctance of PTO and PMO to form
polym er electrolytes is thus ascribed to their in a b ility to form low energy
conformations that would maximise polymer-salt interaction. Watanabe et aP^ investigated polymer electrolyte formation of the host polymers polyethylene succinate and polyethylene sebacetate with alkali metal thiocyanates. They postulated that for
intra-molecular coordination of the cation to occur, it was necessary for there to be a
cooperative interaction of neighbouring polar groups in the polymer backbone with the ion. This was thought to be entropically unfavourable fo r polyethylene sebacetate
where the coordinating groups were separated by octamethylene units. The salts had a
greater tendency to dissolve in polyethylene succinate where there was a higher density o f polar groups to maximise polymer-salt interaction.
It might be expected that because of the high donor number o f the amine group
( N=60, 0=22 ) that linear polyimines would form stronger bonds w ith cations than
their oxygen analogues. The first report o f polymer electrolyte form ation w ith polyethylene imine, (PEI), (CH2CH2NH),i, was from Chiang et aP^ in 1985. They
showed that Nal dissolved in linear PEI (MW 2000) to form a high melting point
crystalline complex at high salt concentrations. Strong polymer-salt interaction was evidenced by the loss o f crystallinity of the polymer at low concentrations. The reduced conductivity of the system ( 5x10“^ Q-^cm"! at 75^C, PEO^gNal ) compared
to values obtained for systems with PEO could also be ascribed to a stronger polymer-
salt interaction, thereby reducing the lab ility o f the bond. A labile bond being a necessity for ion migration. In a later study^o, the same workers investigated polymer electrolyte formation with a wide variety of lithium salts. Evidence for salt dissolution
was obtained from the loss of crystallinity of the polymer as evidenced by the
reduction o f the enthalpy of fusion of the crystalline phase. This was observed to a
concluded that the loss of crystallinity o f the polymer was due to the formation of cross links resulting from the interaction of Li+ w ith lone pairs on N atoms o f neighbouring polymer chains. This would have the affect of disrupting the order of the system ( and therefore the crystallinity ) as well as raising the Tg as observed. They
also concluded that if the fluoride did dissolve, it was to a very much lesser extent than
the other lithium salts.
Harris et a p i investigated the complexing ability of higher molecular weight PEI (M W 10000) w ith sodium triflate (NaCFgSO^) and observed similar behaviour to the
earlier study. Highly amorphous materials were produced but there was evidence for
crystalline complex fomiation at higher concentrations. Preliminary investigations also
indicated that complex formation occurred with transition metal salts although these
materials were amorphous with Tg > 25®C.
The conductivity of polymer electrolyte systems has been ascribed to the motion of ions through the amorphous regions o f the polymer. Takahashi et aP2 chemically
modified linear PEI in an attempt to prevent crystalline complex formation without affecting the ability o f the polymer to dissolve salts and conduct ions. They
investigated systems containing poly(N-acetyl ethylene imine), partially quaternized
PEI w ith ethyl or butyl groups and crosslinked PEI with diepoxyoctane. A ll o f these
modifications, although disrupting the crystallinity of the system, resulted in a large rise in Tg with subsequent reduction of the mobilty of the charge carriers.
Clancy et al23 prepared and characterised some polymer electrolytes formed from
polyalkylene sulphides and some silver salts. It was observed that although polypentamethylene sulphide [(CH2)5S]q, (P5S), and polyethylene sulphide,
(CH2CH2S)i|, (PES),both formed polymer electrolytes, it was the P5S that formed the
most highly conducting system. This was initia lly surprising in view of the lower density of polar groups on P5S. P5S was however, observed to have a low
Tg (-25°C) and melting point (65°C), factors indicative o f a flexible polymer
be highly amorphous although at the highest concentrations evidence for a semi crystalline complex was obtained.
1.3.5 The morphology o f polymer electrolytes
The detailed morphology of polymer electrolytes is highly complex and dependent
not only on the system and its composition but on the method o f preparation used.
Currently, the two most common methods of preparation are the solvent casting method and the cryogrinding / hot pressing method ( described in more detail in sections 4.1.1 and 4.2.2 ). It is found that the morphology of a system can be affected
by the characteristics of the solvent casting process, e.g. the nature of the solvent and rate of removal, as well as by the temperature and thermal history of the sample.
As for the simple polymers, described in section 1.2.4, most polymer electrolyte
systems which crystallise, form spherulites of well defined stoichiomery. It is often found that the interlamella amorphous regions contain small amounts of dissolved salt.
Spherulites of more than one composition may be observed in any given system, the proportion o f each type o f spherulite depends on the overall composition o f the system. Thus Neat et al 24 observed three types of spherulite in the PEO (M W 4x10^) : LiC lO ^ system cast from acetonitrile. Each type of spherulite was characterised by a
different melting point and salt content. No more than two types of spherulite were observed for any one composition. The same authors25 also observed sim ilar behaviour in the PEO : LiCFgSOg system.
The affect of the nature of the solvent on the morphology of polymer electrolytes has been investigated by Payne and W right 26 for the PEO (MW 5x10^) : LiBF^ system.
Films cast from methanol were observed to be semi-crystalline w ith low melting
points. Those cast from a chloroform /acetone mixture were highly crystalline w ith well defined spherulites melting at much higher temperatures. X-ray diffraction studies
pre-association of the ions and the polymer in solution prior to removal of the solvent. For
example, in dilute solutions where the salt is only weakly solvated, it is possible for
'precursor complexes' to be formed w ith the ether. Very little reordering is subsequently required to form the final crystalline structure. In such instances, a highly crystalline material containing high melting point spherulites is expected to form
as exhibited by the acetone/chloroform mixture. For solutions where the salt is highly solvated, complex formation with the ether is not initiated until the bulk of the solvent has been removed. For such concentrated solutions, there is a high degree of polymer
chain entanglement thus reducing the long range order of the resulting complex, as seen from the methanolic solution.
Wendsjo and Yang 27 in their study of factors affecting the degree o f crystallinity of PEO based electrolytes containing PW2 observed that different complexes formed
when the solvents dimethyl sulphoxide (DMSG) and dimethyl formamide (DMF) were
used to dissolve the lead iodide. Furthermore, it was found that the use o f DM F
inhibited the formation of crystalline PEO. The importance of specifying the solvents
used in the preparation procedure is thus emphasised.
The affect o f water on the morphology and electrical properties o f polymer electrolytes has been the subject of several studies. Wendsjo and Y ang 27 observed that
the degree of water uptake vai ies greatly with the nature o f the ions in the electrolyte. Their X-ray diffraction studies of PE0 4ZnCl2 and PEOgNiBr2 clearly indicated that
the uptake o f water destroys the crystalline complex phase. Upon subsequent dehydration o f PEOgNiBr2, peaks due to the crystalline complex reappeared.
Farrington et al28,4 observed that upon controlled hydration / dehydration of PEOxNiBr2 electrolytes, the conductivities and N i2+ transport numbers were greatly
enhanced. Spectroscopic studies indicated that upon exposure to moisture, the water
preferentially coordinated w ith N i(ll) to form the hexa-aquo ion. The increased m obility o f the hydrated N i2+ ion was ascribed to the fact that it was no longer
conductivity of the electrolyte upon dehydration could be due to a significant change in structure and noted that TGA data indicated that all of the N i(II) forms a complex with the PEO. The X-ray diffraction patterns of Wendsjo et al do not indicate a significant
change in structure upon controlled hydration / dehydration. The explanation for the concommitant enhanced conductivity is thus still the subject o f debate.
G ra y 16 has cautioned that it is d ifficu lt to generalise as to the effect of solvent type
and its rate o f removal since this w ill be highly dependent on the individual polymer electrolyte system. In some cases, spherulite growth may not be initiated until after
removal o f the solvent, in which case, the morphology w ill not be affected by its rate of removal.
It is d ifficu lt to make generalisations as to the effect of heat treatment and thermal history on polymer electrolyte morphology. This is also observed to vary w ith the individual system and composition. Lee and Wright^^.is have investigated the effect
o f heat treatment on the morphology of some PEO (MW 10,000) : NaSCN and PEO
(M W 10,000) : Nal complexes. They observed that the solution deposited materials all
contained crystalline lamellae o f thickness 150 - 200 Â (1Â = lO '^^^j), Annealing at
temperatures just below the melting point gave rise to significant lamella thickening which increased with time. If the same material was heated to above its melting point and subsequently cooled, a lower melting point material was produced fo r the PEO:Nal system. This process was irreversible and not observed fo r the PEO :
NaSCN system.
1.4 The structure of crystalline complexes
To date, very little structural work has been reported on any crystalline complexes
formed with PEO. Indeed, until 1992, only three complete structure determinations had been presented, namely PEOgNal, PEOgNaSCN and PEONaSCN263i. Lim ited
— ft
Much of the earlier work probing the structure and bonding in polymer electrolyte crystalline complexes was obtained from vibrational spectroscopic and the X-ray
diffraction studies of oriented fibres listed above. A common characteristic of all the
structures studied was that they contained chains of PEO which adopted sim ilar
conformations to those observed in the pure polymer. Two crystalline modifications of PEO have been reported by Tadokoro et ap334,35 The fim t modification has a helical
structure which contains seven ethylene oxide units with two turns in the fibre identity
period o f 19.3Â. The internal conformations of the PEO chains were assigned by IR
and Raman studies as follows
:-- CH2~ O- trans
- O - CH2 - trans
- CH2 - CH2 - gauche
This is commonly abbreviated as TTG or T2G.
In the second modification of PEO, the molecule adopts a planar zig-zag conformation
containing two ethylene oxide units in the fibre identity period o f 7 .12Â. It should be
noted however, that this conformation is only adopted when the polymer is under stress.
The earliest structural study of a polymer electrolyte crystalline complex was carried
out by Fenton et aP who reported crystalline complex formation between PEO and some sodium and potassium salts. It was not until 1981 however, that detailed models
for the nature of the coordination of the salt by the polymer were proposed. Papke et al^ undertook a detailed study of the complexes formed w ith alkali metal salts using
vibrational spectroscopic techniques. They determined that the PEO chains formed compressed helices in which the ether oxygen atoms were directed towards the centre
o f the channel. They proposed that small cations with ionic radii up to 1.3Â could be accomodated in the channel, coordinated by the ether oxygens.
The complexes formed by rubidium and cesium salts were observed to be
amorphous. This was ascribed to the inability o f the helices to accomodate the large ions which thus formed random bridges between the ether oxygens on neighbouring
chains. The conformation of the polymer backbone in the sodium complexes was determined to
be:--CH2 - O - trans CH2 - O - trans
~ O - CH2 - trans - O - CH2 - trans
- CH2 - CH2 - gauche - CH2 - CH2 - gauche minus
i.e T2GT2G
The repeat distance of the helix in the complexes was observed to be approximately 9 - 11 Â, which showed a marked reduction compared to the 19.3Â in pure (helical)
PEO. In the sodium salt complexes, the Na+ ion was observed to be coordinated by four ether oxygens in a highly distorted tetrahedron. This structure appeared to
maximise polymer - Na+ interactions whilst avoiding energetically unfavourable
conformations for the polymer; namely, consecutive gauche bonds. No evidence for cation-anion interaction was observed in these complexes. Subsequent work by Parker et ap6 proposed a double helical model for the PEO4KSCN and PEOgNaSCN
complexes. Shriver et aP7 however commented that this was unlikely since the
proposed structure resulted in an unfavourable interaction between non-bonding groups due to the almost eclipsed conformation of some OCH2 - CH2O groups.
Papke et ap8.11 subsequently carried out a vibrational spectroscopic study o f
complexes formed w ith a variety of lithium salts. A model sim ilar to that for the sodium complexes was proposed, where the polymer host adopted the T2GT2G
conformation. Some distortion of the conformation was necessary however to enable the polyether helix to 'wrap' round and coordinate the small lithium ion. Some evidence for ion pairing was observed for the PEO : LiNO^ complex.
The first partial X-ray structure determination was performed by Hibma^^ in 1983 for the PEO4KSCN complex. The most important feature of his proposed structure
was that the potassium ions were not enclosed in the polymer helices as had
previously been believed. It was not until 1987 however that a complete structural
w ith space group P2i/a. Na+ and I’ ions were linked alternatively to form a zig-zag
chain along the c-(chain ) axis forming a 2 j helix, (i.e. two N a+r units to each zig
zag). The PEO backbone was determined to consist of six ethylene oxide units per fibre repeat period ( 7.98 Â) which assumed a 2^ helix. Each symmetric unit
containing three ethylene oxide units.(i.e. there were six ethylene oxide units for each
complete turn of the helix). The polymer helix, which coiled around the Na+T chain, was observed to have the following conformation:
-—0 —C —C— 0 — C — C-—0 —c —c —
T T G T T G T T g
Each Na+ ion was coordinated by three ether oxygen atoms and two E ions. The
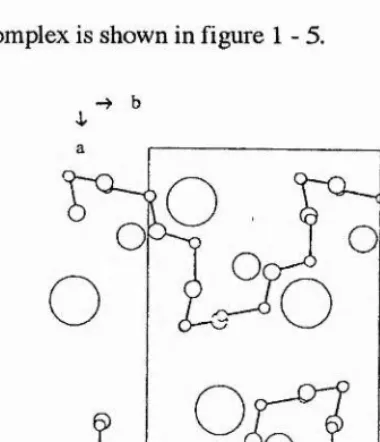
structure of the complex is shown in figure 1-5.
[image:37.617.180.370.345.566.2]b
Figure 1 -5 View of the PEOgNal structure along c
In 1990, Chatani et api determined the structures of two PEO:NaSCN complexes, PEOgNaSCN and PEONaSCN. The structure o f PEOgNaSCN was observed to be sim ilar to PEC^Nal with the exception that there was six-fold coordination o f the ions
instead o f five-fold coordination. Each Na+ ion was coordinated by four ether oxygen
postulated that the different cation coordination resulted from the slightly larger fibre repeat distance ( 7.98Â ) in the PEO : Nal complex.
The PEONaSCN complex was only observed to exist when the polymer was under tension. The polymer adopted a zig-zag structure with conformation
— 0 —C—C— 0 — C — C 2"0 —
T G G T G GEach Na+ ion was coordinated by two N atoms and two S atoms from the SCN" ions as well as two ether oxygen atoms from the same chain. The instability o f the TG2TG2
conformation of the PEO chain was further illustrated by the fact that when the tension was released, the PEOgNaSCN complex was observed to form. No appreciable free
NaSCN was observed after this transformation and it was postulated that the excess
salt dissolved in the amorphous regions of the polymer.
Recent developments in powder X-ray diffraction techniques have enabled the structure of the PEOgNaClO^ complex to be elucidated in this laboratory^^. This is
described in more detail in appendix 1.
1.5 Phase diagrams
Much o f the early work in the field of polymer electrolytes concentrated on
determining the factors affecting the conductivities of each system. In particular, the interdependence of ionic conductivity and the nature and proportion of the different
phases present was of great interest. It was established quite early on^o that the motion
o f ions through the amorphous regions o f the polymer was responsible fo r the significant conductivities of these systems.
As mentioned in section 1.2, many PEO based polymer electrolytes contain at least
conductivity o f the polymer electrolyte systems as a function o f composition and temperature, it was of vital importance to establish which phases were present in the
system at any given time. This information is most clearly presented in the form o f a
phase diagram.
Vincent^! has commented that phase diagrams for polymer electrolyte systems should be approached w ith great caution. The sluggish nature o f the transport
processes and crystallisation kinetics in polymers at low temperatures in particular,
mean that it is only generally possible to approach conditions o f thermodynamic equilibrium. It is well established that even polymers regarded as 'crystalline' contain
amorphous regions that are not in thermodynamic equilibrium. Lee and Crist^^ have discussed the fact that in polymer electrolyte systems, these regions may often contain
salts dissolved up to a certain saturation lim it. Because they appear to occur reproducibly, these regions are often treated as single phases for the purposes o f
phases diagram construction.
The emphasis of much of the earlier work in polymer electrolytes was on systems containing salts o f alkali metals dissolved in PEO. It is for this reason that most of the phase diagrams that have been determined today are for those systems containing salts
of monovalent ions. The growth of interest in polymer electrolytes containing salts of multivalent cations has led to recent determination of the phase diagrams for some of
these systems. It would be fair to comment however, that as a general rule, these
systems are less well understood than their monovalent counterparts.
The most commonly used techniques fo r determining phases diagrams are
differential scanning calorimetry (DSC), X-ray diffraction and hot stage polarising microscopy. Some workers 40,43,44jj^ve used NMR to determine the fractions o f ions
in the amorphous and crystalline regions of the polymer. The most recent
—
1.5.1 The PEO : LiCF3SO3 system
The earliest studies 40,43.44 o f the PEO : LiCF^SOg system using DSC and
X-ray diffraction techniques established the existence of two crystalline phases. Phase I, which was PEO rich, was observed to have a melting point close to that
fo r pure PEO. It was proposed that phase II, which was richer in salt and had a
higher melting point, was the result of stoichiometric complexation of the salt by
the polymer. It was originally believed that this complex had a composition of PEO^LiCFgSOg, but later studies40.44 using NMR techniques established that
the complex composition was in fact PEO3 ^iCFgSOg. Neat et al ^4,25 determined
that both crystalline phases were spherulitic in nature and suggested that phase I consisted of a pure PEO crystalline skeleton with salt dissolved in the interlamellar
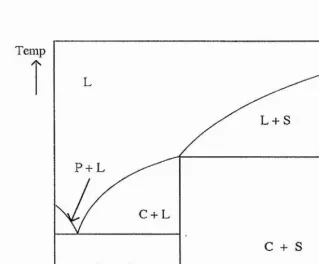
amorphous regions. Sorensen and Jacobsen46 proposed a schematic phase diagram
fo r polymer electrolyte systems containing both crystalline and amorphous phases (figure 1-6). They produced a phase diagram for the PEO : UCF3SO3 system that
was in agreement with this. Although they proposed the existence of a eutectic in the region of PE0 5oLiCF3S0 3, a later study by M inier et aM argued against its existence.
The argument was to continue when Robitaille and Fateux 47 produced evidence for a eutectic in the region of PEOiooLiCF3S0 3 from optical microscopy experiments.
The most recent study by Zahurak et aF^ suggested that these observations could be
explained by the presence of a second complex. Having obtained X-ray diffraction recorded at elevated temperatures. This powerful technique, at present in use in this laboratory, greatly simplifies the identification of the crystalline phases present and
helps in the assignment o f DSC thermal events to processes occurring in the
electrolyte.
It is found that the phase diagrams for polymer electrolyte systems often have many i
features in common. These are illustrated with reference to some specific systems
evidence for a complex of composition PEO-yLiCFgSOg , they argued against the
existance of a eutectic. Two schools of thought still exist regarding the presence o f a eutectic in this system. This further illustrates the d iffic u lty in unambiguous
interpretation of the data necessary for phase diagram construction.
Temp
L + S
P + L
C + L
1
[image:41.613.118.438.217.481.2]0 Molar fraction of salt
Figure 1 -6 A schematic phase diagram ^ for a polymer electrolyte system
containing PEO (P), crystalline complex(C), salt (S) and an amorphous phase (L)
The form of the phase diagram in figure 1 -7 ,which can be considered as being made
50 25
O : Li 8
T /°C
250
200
150
PEOoLiCFqSO
100
50
PEO
0 0.2 0.4 0,6
^LiC%SO^
Figure 1 -7 The phase diagram for the PEO : LiCFgSOg system10
1.5.2 The PEO : NaSCN system
The earliest study of PEO : NaSCN mixtures was carried out by Lee and Crist^z
using DSC, optical microscopy and X-ray diffraction techniques. They proposed that a complex of composition PEO^ ^NaSCN was formed and obtained evidence for a
eutectic o f composition PEO3 7 5NaSCN. In their experiments however, no
precautions were taken to avoid contamination o f the samples with water vapour.
A subsequent study by Robi taille et aM^ produced a phase diagram (figure 1 - 8 )
w ith many sim ilar features to that proposed by Lee and Crist. They proposed a complex of composition PEOgNaSCN and a eutectic of composition PE025NaSCN.
100 12 8
O : Na
2
NaSCN 300
250
NaSCN
200
150
NaSCN
100
PEONaSCN PEC^NaSCN
0.8 1.0
0.4 0.6 0.2
0
X NaSCN
Figure 1 -8 The phase diagram for the PEO : NaSCN system
Analysis o f DSC endotherms enabled them to determine that the composition of the peritectic liquid was PEO^NaSCN. The peritectic reaction could thus be represented
by the following
equation:-4 PEG.NaSCN 3 ( s ) ^ ^ 3 PEQ.NaSCN,,, + N aS C N ,.4 ( I ) ( s )
They observed that the solubility of the salt remained essentially invariant with ether oxygen: N a+ratio of 4:1, over a large temperature range above the peritectic
equilibrium. This was interpreted^ as indicating that well defined solvates formed in
Salt \ .-..— (1) (a)
nPEO(i) + Salt PEO^Salt (b)
Thus, below -240oC, salt dissolution (a) is controlled by the solvation reaction (b),
the solution concentration at saturation being equal to the solvate composition.
The phase diagram for the PEO : NaSCN system closely resembles those for the PEO : KSCN49 and PEO : N al^i systems. Both of these systems form a single stoichiometric crystalline complex ( PEO4KSCN and PEOgNal ) and undergo a
peritectic reaction at elevated temperatures. The PEO : KSCN system differs slightly in
that a crystallinity gap is observed between the 8:1 and 12:1 ether oxygen : K+
compositions; i.e in this composition range, there is an absence of crystalline phases at
any temperature. It is not therefore possible to determine whether a eutectic mixture is
1.5.3 The PEO : ZnCl2 system
Bermudez et al 52 used DSC and X-ray diffraction techniques to determine the phase diagram for the PEO : ZnCl2 system. Two complexes were observed to form with
com position PEO^ZnCl2 , x = 22 and x = 4 to 6 as well as two eutectics with
composition x = 14 and x = 34 as shown in figure 1-9.
40 16
O ; Zn 8 Temp ( 3C)
150
100
0.2
C 0.1
0 0.3
Molar fraction (ZnCl 2)
1.5.4
The PEO : Cu(CF3S03)2 system shown in figure 1 - 10 is very sim ilar to that for
the P E O :ZnC l2 system. Two eutectics are observed in the region of
PE0xCu(CF3S03)2 where x = 6 and x = II . The regions of the phase diagram have
been described in terms of the eutectic compositions. Although this is strictly not
accurate, the precise compositions of the components were possibly d iffic u lt to determine due to the low number of data points. Passerini et al ^3 commented on the highly amorphous nature of compositions that are rich in salt. Although crystalline
material was present, they did not report the stoichiometry of any specific crystalline
complex.
O : Cu
Trc
150
100
50 Liquid
PEO
PEOgCiKCFg 3 0 3 )2
0 0.1 0.2 0.3
Molar fraction Cu(CF^SO^ ^
1.5.5 The PEO : Eu(CF^SO^ ) 5system
W ork has been progressing by Smith et al. to determine the phase digram for the PEO: Eu(CF3S0 3 ) 3 system. A preliminary phase diagram has been reported^^ as
shown in figure 1- 1 1.
150
Liquid
100
50
0 0.03 0.06 0.09 0.12
Mol fraction ( Eu(CI^SC^)g )
1.6 Aspects of ionic conductivity in polymer electrolytes
1.6.1 Introduction
The way in which the ionic conductivity of a polymer electrolyte varies w ith temperature is very characteristic of such electrolytes. Many studies have focussed on determining a(T), the conductivity as a function of temperature. Several attempts have
been made to model and explain the observed temperature dependence. The earliest studies 3 showed that over certain temperature ranges, many a(T) curves followed
either Arrhenius behaviour (box 1) or Vogel-Tamman-Fulcher^^ (VTF) behaviour
(box2).
Box 1
Arrhenius behaviour :■
a = A exp ( -E„ / RT )
A is a constant
Ejj is the activation energy for the process
Box 2
VTF behaviour
a = % exp [- B Z ( T - T q ) ]
c^o is weakly temperature dependent; Oq oc T
To is a reference temperature B is a constant
It has subsequently been found that most polymer electrolytes show one of four patterns of
behaviour:-a) VTF behaviour over the observable temperature range.
b) Arrhenius behaviour for low temperatures and VTF behaviour at higher temperatures.
c) Arrhenius behaviour over the whole temperature range falling into two regions. One with high activation energy close to the glass transition temperature Tg and the
second with a lower activation energy at higher temperatures.
d) VTF behaviour for temperatures just above Tg but Arrhenius behaviour at higher
temperatures.
Theoretical models for the conductivity of polymer electrolytes have encompassed the free volume theoiy of Cohen and Turnbull^'^, the configurational entropy theory of Adam, Gibbs and DiMarzio58.59 and the dynamic bond percolation theory o f Ratner,
Nitzan and Druger6L62 These models,which often expand on the ideas o f W illiam s,
Landel and Ferry, are sketched in more detail below.
1.6.2 Williams, Landel and Ferry (WLF) theory
W illiam s, Landel and Ferryinvestigated the mechanical and electrical relaxation processes characterizing glass forming materials. They observed that the ratio,a'p, of
any relaxation time at a temperature T ( above Tg) to its value at a reference temperature Tg, determined from a variety o f experiments, was identical.
Furthermore, by suitable choice of Tg it was found that a-p as a function o f T - Tg was
identical for a variety of polymers and glass forming materials. This relationship was observed to hold over the range T ^ Tg + 50 ^C. For the systems studied, it was
found that Tg - Tg = 50 + 5°C. Modification of a VTF type equation for the viscosity:- log T] = A + B/(T - Too) I _ ji)
( where A , B and Too are constants and Too « Tg ) yielded an analytical form for the
a^:--C^(T-Tg)
°® ^=(C ,+ T-T^
l-iii)
where a fit was obtained for their data with = 8 .8 6 and C2 = 1 0 1.6.
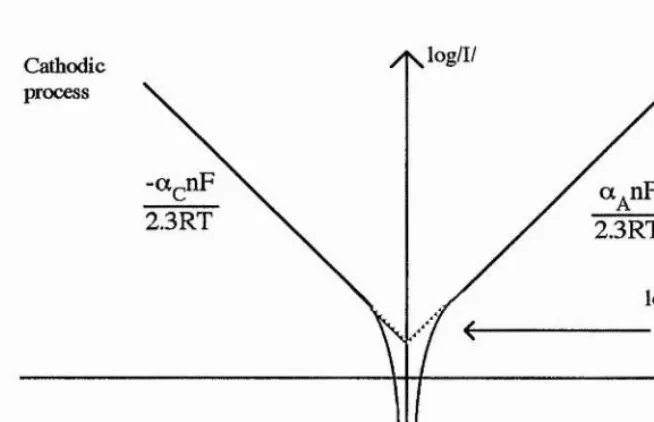
The expression was in good agreement with experimental data except where T < Tg.
The equation could also be written in terms of Tg as the reference temperature.
toga,- -IW -T g )
(51.6 + T - T g ) i_ iv )
W illiams et al commented however that it was less precise.
Using the Doolittle equation, which related viscosity to free
volume:-In ïi = volume:-In A + Bv^v^ 1 . v)
( where vq and Vf were the occupied and free volume per g), they were able to obtain an expression for the shift factor in terms of the fraction of free volume (fg) at Tg and the difference in the thermal expansion coefficients above and below Tg (0C2).
log Up = I 2.303 f-1 T - T g \
1-vi)
This was observed to be of the same form as equation 1 - iv). Thus by equating the coefficients in each expression a = 4.8 x 10 K ’ 1 and fg = 0.025 .
1.6.3 Free volume theory
Free volume theory was most clearly presented by Cohen and Turnbull in their paper
of 1959 . They proposed that molecular transport occurred as the result o f the movement o f molecules into voids greater than a certain critical size formed by the
redistribution of the free volume of the system. They suggested that diffusive motion would occur if another molecule jumped into the hole vacated by the first before it
could return. They defined the free volume of the molecule to be equal to the volume of the molecule in its cage less that occupied by the molecule itself. The contribution of
:-D(v) = ga(v)u I _ vii)
where a(v) was the cage diameter and g a geometric factor.
For the contribution to be non-zero, the volume of the void had to be greater than a critical value v'^. Cohen and Turnbull determined the total probability of a hole with volume > V* and thus obtained an expression for the diffusion coefficient
:-D = ga*u exp ( -yv*/v^) ^
where a* is the molecular diameter and y is a numerical factor to take account o f the
overlap of free volume. They then considered the temperature dependence of the free
volume:-Vf = aVni ( T - Tq) 1 _ix)
where was the mean molecular volume in the temperature range, Tq the temperature
at which the free volume disappears and a as before. The fu ll expression for the
diffusion coefficient derived was
thus:-D = ga*u exp «Vm(T-T^)-yv*
1 - x)
This expression could be related to the conductivity via the Nernst- Einstein
relationship:-0
= 1 ^kT 1 - xi)
where n is the carrier concentration and q the can ier charge. Thus
:-O = :-O o e x p [ - B / ( T - T g ) ]
OQ can be seen to vary with T '*^ 2 since it contains the term u ( where u = [3kT/m ]1^2)
It can thus be seen that the expression for conductivity derived from free volume