Fully Unsupervised Graph-Based Discovery of General-Specific Noun
Relationships from Web Corpora Frequency Counts
Gaël Dias HULTIG University of Beira Interior
Raycho Mukelov HULTIG University of Beira Interior
Guillaume Cleuziou LIFO
University of Orléans
Abstract.
In this paper, we propose a new metho-dology based on directed graphs and the TextRank algorithm to automatically in-duce general-specific noun relations from web corpora frequency counts. Different asymmetric association measures are im-plemented to build the graphs upon which the TextRank algorithm is applied and produces an ordered list of nouns from the most general to the most specif-ic. Experiments are conducted based on the WordNet noun hierarchy and assess 65.69% of correct word ordering.
1 Introduction
Taxonomies are crucial for any knowledge-based system. They are in fact important because they allow to structure information, thus foster-ing their search and reuse. However, it is well known that any knowledge-based system suffers from the so-called knowledge acquisition bottle-neck, i.e. the difficulty to actually model the do-main in question. As stated in (Caraballo, 1999), WordNet has been an important lexical know-ledge base, but it is insufficient for domain spe-cific texts. So, many attempts have been made to automatically produce taxonomies (Grefenstette, 1994), but (Caraballo, 1999) is certainly the first work which proposes a complete overview of the problem by (1) automatically building a hierar-chical structure of nouns based on bottom-up clustering methods and (2) labeling the internal nodes of the resulting tree with hypernyms from the nouns clustered underneath by using patterns such as “B is a kind of A”.
© 2008. Licensed under the Creative Commons
At-tribution-Noncommercial-Share Alike 3.0 Unported
license (http://creativecommons.org/licenses/by-nc-sa/3.0/). Some rights reserved.
In this paper, we are interested in dealing with the second problem of the construction of an or-ganized lexical resource i.e. discovering general-specific noun relationships, so that correct nouns are chosen to label internal nodes of any hierar-chical knowledge base, such as the one proposed in (Dias et al., 2006). Most of the works pro-posed so far have (1) used predefined patterns or (2) automatically learned these patterns to identi-fy hypernym/hyponym relationships. From the first paradigm, (Hearst, 1992) first identifies a set of lexico-syntactic patterns that are easily recog-nizable i.e. occur frequently and across text genre boundaries. These can be called seed patterns. Based on these seeds, she proposes a bootstrap-ping algorithm to semi-automatically acquire new more specific patterns. Similarly, (Carabal-lo, 1999) uses predefined patterns such as “X is a kind of Y” or “X, Y, and other Zs” to identify hypernym/hyponym relationships. This approach to information extraction is based on a technique called selective concept extraction as defined by (Riloff, 1993). Selective concept extraction is a form of text skimming that selectively processes relevant text while effectively ignoring surround-ing text that is thought to be irrelevant to the do-main.
A more challenging task is to automatically learn the relevant patterns for the hypernym/hyponym relationships. In the context of pattern extraction, there exist many approaches as summarized in (Stevenson and Greenwood, 2006). The most well-known work in this area is certainly the one proposed by (Snow et al., 2005) who use ma-chine learning techniques to automatically re-place hand-built knowledge. By using depend-ency path features extracted from parse trees, they introduce a general-purpose formalization and generalization of these patterns. Given a training set of text containing known hypernym pairs, their algorithm automatically extracts use-ful dependency paths and applies them to new corpora to identify novel pairs. (Sang and
mann, 2007) use a similar way as (Snow et al., 2006) to derive extraction patterns for hy-pernym/hyponym relationships by using web search engine counts from pairs of words en-countered in WordNet. However, the most inter-esting work is certainly proposed by (Bollegala et al., 2007) who extract patterns in two steps. First, they find lexical relationships between synonym pairs based on snippets counts and ap-ply wildcards to generalize the acquired knowl-edge. Then, they apply a SVM classifier to de-termine whether a new pair shows a relation of synonymy or not, based on a feature vector of lexical relationships. This technique could be applied to hypernym/hyponym relationships al-though the authors do not mention it.
On the one hand, links between words that result from manual or semi-automatic acquisition of relevant predicative or discursive patterns (Hearst, 1992; Carballo, 1999) are fine and accu-rate, but the acquisition of these patterns is a te-dious task that requires substantial manual work. On the other hand, works done by (Snow et al., 2005; Snow et al., 2006; Sang and Hofmann, 2007; Bollegala et al., 2007) have proposed me-thodologies to automatically acquire these pat-terns mostly based on supervised learning to le-verage manual work. However, training sets still need to be built.
Unlike other approaches, we propose an unsu-pervised methodology which aims at discovering general-specific noun relationships which can be assimilated to hypernym/hyponym relationships detection2. The advantages of this approach are clear as it can be applied to any language or any domain without any previous knowledge, based on a simple assumption: specific words tend to attract general words with more strength than the opposite. As (Michelbacher et al., 2007) state: “there is a tendency for a strong forward associa-tion from a specific term like adenocarcinoma to the more general term cancer, whereas the asso-ciation from cancer to adenocarcinoma is weak”. Based on this assumption, we propose a metho-dology based on directed graphs and the Tex-tRank algorithm (Mihalcea and Tarau, 2004) to automatically induce general-specific noun rela-tionships from web corpora frequency counts. Indeed, asymmetry in Natural Language Processing can be seen as a possible reason for
2
We must admit that other kinds of relationships may be covered. For that reason, we will speak about general-specific relationships instead of hypernym/hyponym rela-tionships.
the degree of generality of terms (Michelbacher et al., 2007). So, different asymmetric associa-tion measures are implemented to build the graphs upon which the TextRank algorithm is applied and produces an ordered list of nouns, from the most general to the most specific. Expe-riments have been conducted based on the WordNet noun hierarchy and assessed that 65% of the words are ordered correctly.
2 Asymmetric Association Measures
In (Michelbacher et al., 2007), the authors clearly point at the importance of asymmetry in Natural Language Processing. In particular, we deeply believe that asymmetry is a key factor for discovering the degree of generality of terms. It is cognitively sensible to state that when some-one hears about mango, he may induce the prop-erties of a fruit. But, when hearing fruit, more common fruits will be likely to come into mind such as apple or banana. In this case, there exists an oriented association between fruit and mango (mango → fruit) which indicates that mango at-tracts more fruit than fruit atat-tracts mango. As a consequence, fruit is more likely to be a more general term than mango.
Based on this assumption, asymmetric associa-tion measures are necessary to induce these asso-ciations. (Pecina and Schlesinger, 2006) and (Tan et al., 2004) propose exhaustive lists of as-sociation measures from which we present the asymmetric ones that will be used to measure the degree of attractiveness between two nouns, x and y, where f(.,.), P(.), P(.,.) and N are respec-tively the frequency function, the marginal prob-ability function, the joint probprob-ability function and the total of digrams.
( ) )) , ( ) , ( ), , ( ) , ( max( , Blanquet -Braun y x f y x f y x f y x f y x f + + = (1) + + = ) ( ) | ( log ) , ( ) ( ) | ( log ) , ( , ) ( ) | ( log ) , ( ) ( ) | ( log ) , ( max measure J x P y x P y x P x P y x P y x P y P x y P y x P y P x y P y x P (2) [ ( | ), ( | )] max
Confidence= Pxy P yx (3)
− − −
− =
) ( 1
) ( ) | ( , ) ( 1
) ( ) | ( max Factor Certainty
x P
x P y x P
y P
y P x y P
(6)
[ ( | ) ( ), ( | ) ( )]
max Value
Added = P yx−P y Pxy−Px (7) All seven definitions show their asymmetry by evaluating the maximum value between two hy-potheses i.e. by evaluating the attraction of x upon y but also the attraction of y upon x. As a consequence, the maximum value will decide the direction of the general-specific association i.e. (x → y) or (y → x).
3 TextRank Algorithm
Graph-based ranking algorithms are essential-ly a way of deciding the importance of a vertex within a graph, based on global information re-cursively drawn from the entire graph. The basic idea implemented by a graph-based ranking model is that of voting or recommendation. When one vertex links to another one, it is basi-cally casting a vote for that other vertex. The higher the number of votes that are cast for a ver-tex, the higher the importance of the vertex. Moreover, the importance of the vertex casting the vote determines how important the vote itself is, and this information is also taken into account by the ranking model. Hence, the score asso-ciated with a vertex is determined based on the votes that are cast for it, and the score of the ver-tices casting these votes.
Our intuition of using graph-based ranking algo-rithms is that more general words will be more likely to have incoming associations as they will be associated to many specific words. On the opposite, specific words will have few incoming associations as they will not attract general words (see Figure 1). As a consequence, the voting pa-radigm of graph-based ranking algorithms should give more strength to general words than specific ones, i.e. a higher voting score.
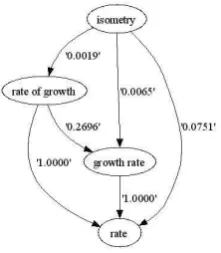
For that purpose, we first need to build a directed graph. Informally, if x attracts more y than y at-tracts x, we will draw an edge between x and y as follows (x → y) as we want to give more credits to general words. Formally, we can define a di-rected graph G = (V, E) with the set of vertices V (in our case, a set of words) and a set of edges E where E is a subset of V×V (in our case, defined by the asymmetric association measure value between two words). In Figure 1, we show the directed graph obtained by using the set of words
V = {isometry, rate of growth, growth rate, rate}
randomly extracted from WordNet where rate of
growth and growth rate are synonyms, isometry
an hyponym of the previous set and rate an hypernym of the same set. The weights asso-ciated to the edges have been evaluated by the confidence association measure (Equation 3) based on web search engine counts3.
[image:3.595.92.290.73.129.2]
Fig. 1. Directed Graph based on synset #13153496 (rate of
growth, growth rate) and its direct hypernym (rate) and
hyponym (isometry).
Figure 1 clearly shows our assumption of gene-rality of terms as the hypernym rate only has incoming edges whereas the hyponym isometry only has outgoing edges. As a consequence, by applying a graph-based ranking algorithm, we aim at producing an ordered list of words from the most general (with the highest value) to the most specific (with the lowest value). For that purpose, we present the TextRank algorithm pro-posed by (Mihalcea and Tarau, 2004) both for unweighted and weighted directed graphs.
3.1 Unweighted Directed Graph
For a given vertex Vi let In(Vi) be the set of vertices that point to it, and let Out(Vi) be the set of vertices that vertex Vi points to. The score of a vertex Vi is defined in Equation 8 where d is a damping factor that can be set between 0 and 1, which has the role of integrating into the model the probability of jumping from a given vertex to another random vertex in the graph4.
(8)
3.2 Weighted Directed Graph
In order to take into account the edge weights, a new formula is introduced in Equation 9.
3
We used counts returned by http://www.yahoo.com.
4
d is usually set to 0.85.
) ( )| ( |
1 )
1 (
)
(Vi j
In Vj
j
i S V
V Out d
d )
S(V = − + × ∑ ×
[image:3.595.359.470.160.287.2](9)
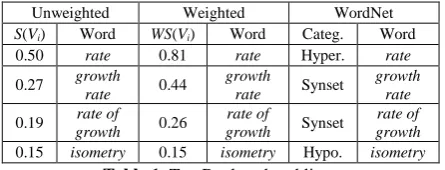
After running the algorithm in both cases, a score is associated to each vertex, which represents the “importance” of the vertex within the graph. No-tice that the final values obtained after TextRank runs to completion are not affected by the choice of the initial values randomly assigned to the ver-tices. Only the number of iterations needed for convergence may be different. As a consequence, after running the TextRank algorithm, in both its configurations, the output is an ordered list of words from the most general one to the most specific one. In table 1, we show both the lists with the weighted and unweighted versions of the TextRank based on the directed graph shown in Figure 1.
Unweighted Weighted WordNet
S(Vi) Word WS(Vi) Word Categ. Word 0.50 rate 0.81 rate Hyper. rate
0.27 growth
rate 0.44
growth
rate Synset
growth rate
0.19 rate of
growth 0.26
rate of
growth Synset
rate of growth
[image:4.595.71.294.315.400.2]0.15 isometry 0.15 isometry Hypo. isometry Table 1. TextRank ordered lists.
The results show that asymmetric measures combined with directed graphs and graph-based ranking algorithms such as the TextRank are likely to give a positive answer to our hypothesis about the degree of generality of terms. More-over, we propose an unsupervised methodology for acquiring general-specific noun relationships. However, it is clear that deep evaluation is needed.
4 Experiments and Results
Evaluation is classically a difficult task in Natural Language Processing. In fact, as human evaluation is time-consuming and generally sub-jective even when strict guidelines are provided, measures to automatically evaluate experiments must be proposed. In this section, we propose three evaluation measures and discuss the respec-tive results.
4.1 Constraints
WordNet can be defined as applying a set of constraints to words. Indeed, if word w is the hypernym of word x, we may represent this rela-tion by the following constraint y › x, where › is the order operator stating that y is more general than x. As a consequence, for each set of three
synsets (the hypernym synset, the seed synset and the hyponym synset), a list of constraints can be established i.e. all words of the hypernym synset must be more general than all the words of the seed synset and the hyponym synset, and all the words of the seed synset must be more gener-al than gener-all the words in the hyponym synset. So, if we take the synsets presented in Table 1, we can define the following set of constraints: {rate › growth rate, rate › rate of growth, growth rate ›
isometry, rate of growth › isometry}.
In order to evaluate our list of words ranked by the level of generality against the WordNet cate-gorization, we just need to measure the propor-tion of constraints which are respected as shown in Equation (10). We call, correctness this meas-ure.
(10)
For example, in Table 1, all the constraints are respected for both weighted and unweighted graphs, giving 100% correctness for the ordered lists compared to WordNet categorization.
4.2 Clustering
Another way to evaluate the quality of the or-dering of words is to apply hard clustering to the words weighted by their level of generality. By evidencing the quality of the mapping between three hard clusters generated automatically and the hypernym synset, the seed synset and the hy-ponym synset, we are able to measure the quality of our ranking. As a consequence, we propose to (1) perform 3-means clustering over the list of ranked words, (2) classify the clusters by level of generality and (3) measure the precision, recall and f-measure of each cluster sorted by level of generality with the hypernym synset, the seed synset and the hyponym synset.
For the first task, we use the implementation of the k-means algorithm of the NLTK toolkit5. In particular, we bootstrap the k-means by choosing the initial means as follows. For the first mean, we choose the weight (the score) of the first word in the TextRank generated list of words. For the second mean, we take the weight of the middle word in the list and for the third mean, the weight of the last word in the list.
For the second task the level of generality of each cluster is evaluated by the average level of
5
http://nltk.sourceforge.net/
) ( )
1 (
) (
) (
j i
V In Vj
j V Out Vk
jk ji
i WSV
w w d
d )
WS(V = − + × ∑ ×
∑
∈ ∈
constraint of
#
constraint common
of # =
generality of words inside the cluster (or said with other words by its mean).
For the third task, the most general cluster and the hypernym synset are compared in terms of-precision, recall and f-measure as shown in Equ-ation (11), (12) and (13)6. The same process is applied to the second most general cluster and the seed synset, and the third cluster and the hy-ponym synset.
(11)
(12)
(13)
4.3 Rank Coefficient Test
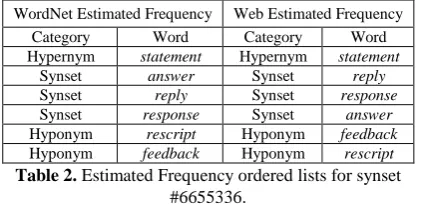
The evaluation can be seen as a rank test be-tween two ordered lists. Indeed, one way to eva-luate the results is to compare the list of general-specific relationships encountered by the Tex-tRank algorithm and the original list given by WordNet. However, we face one problem. WordNet does not give an order of generality inside synsets. In order to avoid this problem, we can order words in each synset by their estimated frequency given by WordNet7 as well as their frequency calculated by web search hits. An ex-ample of both ordered lists is given in Table 2 for the synset #6655336 and its immediate hyper-nyms and hypohyper-nyms.
WordNet Estimated Frequency Web Estimated Frequency Category Word Category Word Hypernym statement Hypernym statement
Synset answer Synset reply
Synset reply Synset response
Synset response Synset answer
Hyponym rescript Hyponym feedback
Hyponym feedback Hyponym rescript Table 2. Estimated Frequency ordered lists for synset
#6655336.
For that purpose, we propose to use the Spear-man’s rank correlation coefficient (Rho). The Spearman’s Rho is a statistical coefficient that shows how much two random variables are
6
[image:5.595.77.288.529.631.2]Where Cluster ∩ Synset means the number of words common to both Synset and Cluster, and |Synset| and |Cluster| respectively measure the number of words in the Synset and the Cluster.
7
We use WordNet 2.1.
related. It is defined in Equation (14) where d is the distance between every pair of words in the list ordered with TextRank and the reference list which is ordered according to WordNet or the Web and n is the number of pairs of ranked words.
(14)
In particular, the Spearman’s rank correlation coefficient is a number between -1 (no correla-tion at all) and 1 (very strong correlacorrela-tion).
4.4 Experiments
In order to evaluate our methodology, we ran-domly8 extracted 800 seed synsets for which we retrieved their hypernym and hyponym synsets. For each seed synset, we then built the associated directed weighted and unweighted graphs based on the asymmetric association measures referred to in section 29 and ran the TextRank algorithm to produce a general-specific ordered lists of terms.
4.4.1 Results by Constraints
In Table 3, we present the results of the cor-rectness for all seven asymmetric measures, both for the unweighted and weighted graphs.
Equation Type of Graph Correctness
Braun-Blanquet Unweighted 65.68% Weighted 65.52%
J measure Unweighted 60.00% Weighted 60.34%
Confidence Unweighted 65.69% Weighted 65.40%
Laplace Unweighted 65.69% Weighted 65.69%
Conviction Unweighted 61.81% Weighted 63.39%
Certainty Factor Unweighted 65.59% Weighted 63.76%
Added Value Unweighted 65.61% Weighted 64.90%
Baseline10 None 55.68%
Table 3. Results for the Evaluation by Constraints.
The best results are obtained by the Confidence and the Laplace measures reaching 65.69%
8
We guarantee 98% significance level for an error of 0.05 following the normal distribution.
9
The probability functions are estimated by the Maximum Likelihood Estimation (MLE).
10
The baseline is the list of words ordered by web hits fre-quency (without TextRank).
) 1 ( 6 1
2 2
− × −
=
∑
n n
di
ρ
recall precision
precision recall measure
f
+ × × =
− 2
| Cluster |
Synset Cluster ∩
=
precision
| Synset |
Synset Cluster ∩
=
rectness. However, the Braun-Blanquet, the Cer-tainty Factor and the Added Value give results near the best ones. Only the J measure and the Conviction metric seem to perform worst. It is also important to note that the difference between unweighted and weighted graphs is marginal which clearly points at the fact that the topology of the graph is more important than its weighting. This is also confirmed by the fact that most of the asymmetric measures perform alike.
4.4.2 Results by Clustering
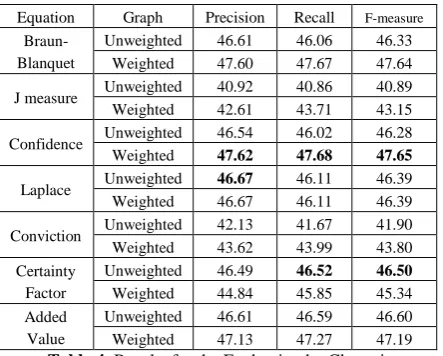
In Table 4, we present the results of precision, recall and f-measure for both weighted and un-weighted graphs for all the seven asymmetric measures. The best precision is obtained for the weighted graph with the Confidence measure evidencing 47.62% and the best recall is also obtained by the Confidence measure also for the weighted graph reaching 47.68%. Once again, the J measure and the Conviction metric perform worst showing worst f-measures. Contrarily, the Confidence measure shows the best performance in terms of f-measure for the weighted graph, i.e. 47.65% while the best result for the unweighted graphs is obtained by the Certainty factor with 46.50%.
These results also show that the weighting of the graph plays an important issue in our methodolo-gy. Indeed, most metrics perform better with weighted graphs in terms of f-measure.
Equation Graph Precision Recall F-measure
Braun-Blanquet
Unweighted 46.61 46.06 46.33 Weighted 47.60 47.67 47.64
J measure Unweighted 40.92 40.86 40.89 Weighted 42.61 43.71 43.15
Confidence Unweighted 46.54 46.02 46.28 Weighted 47.62 47.68 47.65
Laplace Unweighted 46.67 46.11 46.39 Weighted 46.67 46.11 46.39
Conviction Unweighted 42.13 41.67 41.90 Weighted 43.62 43.99 43.80 Certainty
Factor
Unweighted 46.49 46.52 46.50
Weighted 44.84 45.85 45.34 Added
Value
[image:6.595.303.525.121.677.2]Unweighted 46.61 46.59 46.60 Weighted 47.13 47.27 47.19
Table 4. Results for the Evaluation by Clustering.
In Table 5, 6 and 7, we present the same results as in Table 4 but at different levels of analysis i.e. precision, recall and f-measure at hypernym, seed and hyponym levels. Indeed, it is important to understand how the methodology performs at different levels of generality as we verified that
our approach performs better at higher levels of generality.
Equation Graph Precision Recall F-measure
Braun-Blanquet
Unweighted 59.38 37.38 45.88 Weighted 58.75 39.35 47.14
J measure Unweighted 46.49 37.00 41.20 Weighted 47.19 41.90 44.38
Confidence Unweighted 59.20 37.30 45.77 Weighted 58.71 39.22 47.03
Laplace Unweighted 59.50 37.78 45.96 Weighted 59.50 37.78 45.96
Conviction Unweighted 50.07 35.88 41.80 Weighted 52.72 40.74 45.96 Certainty
Factor
Unweighted 55.90 38.29 45.45 Weighted 51.64 42.93 46.88 Added
Value
Unweighted 56.26 37.90 45.29 Weighted 58.21 40.09 47.48
Table 5. Results at the hypernym level.
Equation Graph Precision Recall F-measure
Braun-Blanquet
Unweighted 43.05 37.86 40.29 Weighted 46.38 33.14 38.66
J measure Unweighted 40.82 43.72 42.22 Weighted 43.98 33.89 38.28
Confidence Unweighted 43.03 37.67 40.17 Weighted 46.36 33.02 38.57
Laplace Unweighted 43.10 37.78 40.27 Weighted 43.10 37.78 40.27
Conviction Unweighted 40.36 38.02 39.16 Weighted 42.60 26.39 32.59 Certainty
Factor
Unweighted 44.28 40.87 42.51
Weighted 44.14 40.70 42.35
Added Value
Unweighted 44.21 40.74 42.40 Weighted 45.78 32.90 38.29
Table 6. Results at the seed level.
Equation Graph Precision Recall F-measure
Braun-Blanquet
Unweighted 37.39 62.96 46.92 Weighted 37.68 70.50 49.12
J measure Unweighted 35.43 41.87 38.38 Weighted 36.69 55.33 44.12
Confidence Unweighted 37.38 63.09 46.95 Weighted 37.79 70.80 49.27
Laplace Unweighted 37.40 63.11 46.97 Weighted 37.40 63.11 46.97
Conviction Unweighted 35.97 50.94 42.16 Weighted 35.54 64.85 45.92 Certainty
Factor
Unweighted 39.28 60.40 47.60 Weighted 38.74 53.92 45.09 Added
Value
Unweighted 39.36 61.15 47.89
Weighted 37.39 68.81 48.45
Table 7. Results at the hyponym level.
[image:6.595.73.295.476.654.2]43.72% at the seed level and 70.80% at the hy-ponym level.
This situation can easily be understood as most of the clusters created by the k-means present the same characteristics i.e. the upper level cluster usually has fewer words than the middle level cluster which in turn has fewer words than the last level cluster. As a consequence, the recall is artificially high for the hyponym level. But on the opposite, the precision is high for higher le-vels of generality which is promising for the au-tomatic construction of hierarchical thesauri. In-deed, our approach can be computed recursively so that each level of analysis is evaluated as if it was at the hypernym level, thus taking advantage of the good performance of our approach at up-per levels of generality11.
4.4.3 Results by Rank Test
For each produced list, we calculated the Spearman’s Rho both with WordNet and Web Estimated Lists for weighted and unweighted graphs. Table 8 presents the average results for the 800 randomly selected synsets.
Equation Type of Graph
Rho with WNet Est.
list
Rho with Web Est.
list
Braun-Blanquet
Unweighted 0.38 0.30
Weighted 0.39 0.39
J measure Unweighted 0.23 0.19
Weighted 0.27 0.27
Confidence Unweighted 0.38 0.30
Weighted 0.39 0.39
Laplace Unweighted 0.38 0.30
Weighted 0.38 0.38
Conviction Unweighted 0.30 0.22
Weighted 0.33 0.33
Certainty Factor
Unweighted 0.38 0.29
Weighted 0.35 0.35
Added Value Unweighted 0.37 0.29
Weighted 0.38 0.38
[image:7.595.73.293.390.598.2]Baseline12 None 0.14 0.14
Table 8. Results for the Spearman’s rank correlation
coefficient.
Similarly to what we evidenced in section 4.4.1., the J measure and the Conviction metric are the measures which less seem to map the correct or-der by evidencing low correlation scores. On the other hand, the Confidence metric still gives the best results equally with the Laplace and Braun-Blanquet metrics.
11 This will be studied as future work. 12
The baseline is the list of words ordered by web hits fre-quency.
It is interesting to note that in the case of the web estimated list, the weighted graphs evidence much better results than the unweighted ones, although they do not show improved results compared to the WordNet list. On the one hand, these results show that our methodology is capa-ble to map to WordNet lists as easily as to Web lists even that it is based on web frequency counts. On the other hand, the fact that weighted graphs perform best, shows that the topology of the graph lacks in accuracy and needs the appli-cation of weights to counterpoint this lack.
4.5 Discussion
An important remark needs to be made at this point of our explanation. There is a large ambi-guity introduced in the methodology by just looking at web counts. Indeed, when counting the occurrences of a word like answer, we count all its occurrences for all its meanings and forms. For example, based on WordNet, the word
an-swer can be a verb with ten meanings and a noun
with five meanings. Moreover, words are more frequent than others although they are not so general, unconfirming our original hypothesis. Looking at Table 2, feedback is a clear example of this statement. As we are not dealing with a single domain within which one can expect to see the “one sense per discourse” paradigm, it is clear that the Rho coefficient would not be as good as expected as it is clearly biased by “incor-rect” counts. One direct implication of this com-ment is the use of web estimated lists to evaluate the methodology.
Also, there has been a great discussion over the last few months in the corpora list13 whether one should use web counts instead of corpus counts to estimate word frequencies. In our study, we clearly see that web counts show evident prob-lems, like the ones mentioned by (Kilgarriff, 2007). However, they cannot be discarded so easily. In particular, we aim at looking at web counts in web directories that would act as spe-cific domains and would reduce the space for ambiguity. Of course, experiments with well-known corpora will also have to be made to un-derstand better this phenomenon.
5 Conclusions and Future Work
In this paper, we proposed a new methodology based on directed weighted/unweighted graphs and the TextRank algorithm to automatically
13
duce general-specific noun relationships from web corpora frequency counts. To our know-ledge, such an unsupervised experiment has nev-er been attempted so far. In ordnev-er to evaluate our results, we proposed three different evaluation metrics. The results obtained by using seven asymmetric association measures based on web frequency counts showed promising results reaching levels of (1) constraint coherence of 65.69%, (2) clustering mapping of 59.50% in terms of precision for the hypernym level and 42.72% on average in terms of f-measure and (3) ranking similarity of 0.39 for the Spearman’s rank correlation coefficient.
As future work, we intend to take advantage of the good performance of our approach at the hypernym level to propose a recursive process to improve precision results over all levels of gene-rality.
Finally, it is important to notice that the evalua-tion by clustering evidences more than a simple evaluation of the word order, but shows how this approach is capable to automatically map clus-ters to WordNet classification.
References
Bollegala, D., Matsuo, Y. and Ishizuka, M. 2007.
Measuring Semantic Similarity between Words Us-ing WebSearch Engines. In ProceedUs-ings of
Interna-tional World Wide Web Conference (WWW 2007).
Caraballo, S.A. 1999. Automatic Construction of a
Hypernym-labeled Noun Hierarchy from Text. In
Proceedings of the Conference of the Association for Computational Linguistics (ACL 1999).
Dias, G., Santos, C., and Cleuziou, G. 2006.
Automat-ic Knowledge Representation using a Graph-based Algorithm for Language-Independent Lexical Chaining. In Proceedings of the Workshop on
In-formation Extraction Beyond the Document asso-ciated to the Joint Conference of the International Committee of Computational Linguistics and the Association for Computational Linguistics (COL-ING/ACL), pages. 36-47.
Grefenstette, G. 1994. Explorations in Automatic Thesaurus Discovery. Kluwer Academic Publish-ers, USA.
Hearst, M.H. 1992. Automatic Acquisition of
Hypo-nyms from Large Text Corpora. In Proceedings of
the Fourteenth International Conference on
Com-putational Linguistics (COLING 1992), pages 539-545.
Kilgarriff, A. 2007. Googleology is Bad Science.
Computational Linguistics 33 (1), pages: 147-151.
Michelbacher, L., Evert, S. and Schütze, H. 2007.
Asymmetric Association Measures. In Proceedings
of the Recent Advances in Natural Language Processing (RANLP 2007).
Mihalcea, R. and Tarau, P. 2004. TextRank: Bringing
Order into Texts. In Proceedings of the Conference
on Empirical Methods in Natural Language Processing (EMNLP 2004), pages 404-411.
Pecina, P. and Schlesinger, P. 2006. Combining
Asso-ciation Measures for Collocation Extraction. In
Proceedings of the International Committee of Computational Linguistics and the Association for Computational Linguistics (COLING/ACL 2006).
Riloff, E. 1993. Automatically Constructing a
Dictio-nary for Information Extraction Tasks. In
Proceed-ings of the Eleventh National Conference on Ar-tificial Intelligence (AAAI 1993), pages 811-816.
Sang, E.J.K. and Hofmann, K. 2007. Automatic
Ex-traction of Dutch Hypernym-Hyponym Pairs. In
Proceedings of Computational Linguistics in the Netherlands Conference (CLIN 2007).
Snow, R., Jurafsky, D. and Ng, A. Y. 2005. Learning
Syntactic Patterns for Automatic Hypernym Dis-covery. In Proceedings of the International
Com-mittee of Computational Linguistics and the Asso-ciation for Computational Linguistics (COL-ING/ACL 2006).
Snow, R., Jurafsky, D. and Ng, A. Y. 2005. Semantic Taxonomy Induction from Heterogenous Evidence. In Proceedings of the Neural Information Processing Systems Conference (NIPS 2005).
Stevenson, M., and Greenwood, M. 2006. Comparing Information Extraction Pattern Models. In Proceed-ings of the Workshop on Information Extraction Beyond the Document associated to the Joint Con-ference of the International Committee of Compu-tational Linguistics and the Association for Com-putational Linguistics (COLING/ACL 2006), pag-es. 29-35.