Development of a costing model for added product
components (APC) within the graphical industry
Author: Marita de Weerd University of Twente P.O. Box 217, 7500AE Enschede
The Netherlands
Added product components form an important part of the revenue for organizations. Adding product
components involves adding an activity to the regular activities (printing, cutting & folding). This
activity is added within the original production line and results in an additional charge for customers.
This research aims to develop a costing model to measure the cost of added product components, in order
to help managers in the decision making process to accept or decline a customers order. The analysis
will take place in the form of a case study, where the costing model will be applied within the
organization that operates in the graphical industry.
Supervisors:
Ir. Dr. Kroon v Dr. P.C. Schuur
Keywords
2
List of contents
Introduction ... 3
Literature review ... 4
Management accounting ... 4
Costing methods ... 5
Activity-based costing ... 5
Volume-based costing ... 6
Absorption costing ... 8
Cost estimation methods ... 8
Project Management Triangle ... 9
Methodology ... 10
Data collection & analysis ... 12
Framework analysis: (1) mapping out the process ... 12
Production process: mapping out the process flow of the organizations’ process ... 12
Production process within the post-process department 1: binding/stapling ... 13
Production process within the post-process department 2: sealing & banding ... 14
Production process within the post-process department 3: yarn less ... 14
Framework analysis: (2) analysis of choices ... 15
Conceptualizing added product components ... 15
Costing model within the general framework ... 16
Determination of personnel costs and machine hourly rate ... 18
Costing models within the specific framework ... 20
Department 1: binding/stapling ... 21
Department 2: sealing & banding ... 23
Department 3: yarn less ... 25
Framework analysis: (3) comparisons ... 26
The post-hoc analysis: a measure for reliability & validity ... 26
Results of the case study ... 27
Concluding discussion ... 28
Limitations ... 30
3
Introduction
The intense competition on price and quality has made the shift from standardized to customized product a central issue. In addition, the radical increase in online advertising results in a
changing market in the graphical industry. The demand of business customers for regular magazines is decreasing and is shifting to customization of products, instead of standardized
products. This paper will focus on customized products in the way of adding a separate product component to the original product. This additional product component results in a higher selling price and revenue, but in contrast more time is needed which results in a lower efficiency level. On top of that, several direct costs as labor and maintenance costs are increasing as well. As a consequence, the structure of the total costs is changing radically and is becoming much more complex. Because of this, managers require more detailed information that will assist them in effective cost control activities. More detailed information is needed to be able to make a trade-off between the three primary forces of the Project Management Triangle, namely time, cost and quality. Management accounting reports should assist managers for costs control, to aid planning, for valuing inventories, to ascertain the relative profitability of product and to aid the setting of selling price (Barry & Jarvis, 2011). However, there is a lack of exact knowledge of how the costs are build up when factors, like adding this product component to the original product, in the production would change. On top of that, cost accounting information about the increasing production time with regard to the increasing costs is also unknown. Saniuk et al. (2011) mention that traditional cost calculations calculate only the average manufacturing costs, and that ‘complicated products are understated and manufacturing costs of simple products which require fewer steps are overstated’ (p. 1). Several accounting costing methods have
already been developed, but are found to be obsolete and incomplete towards the costing
4
Research objective: This research aims to develop a costing method that is able to determine the total cost of added product components.
Research question: Since it is not clear how to measure the cost of added product components, the following research question is raised:
How to allocate separate costs to product components that are added to the original product?
Practical relevance: The developed costing method should be able to determine the total costs of different types of added product components. The costing method should be applicable to the organization to assist managers in cost control activities.
Literature Review
Management accounting
As mentioned, this research will focus on management accounting, rather than financial accounting which is about providing information to external users. In contrast, management accounting is about providing insiders of the organization with information to assist them in better decision making. It has its origins already in the early nineteenth century and its use is increasing ever since for several reasons (Johnson & Kaplan, 1987). For example, Jarvis & Barry (2011) state that managers need this information to ascertain the impact of not only their future actions, but also about their past decisions, evaluate alternative ways of deploying the resources of the enterprise, make decisions about future investments and evaluate the outcomes. The objective is to provide reports that will assist internal users with decision making in the field of problem solving, effective control of costs, and plan and fundraising (Barry & Jarvis, 2011).
Hansen et al. (2009) argue that cost management systems generally consist of a cost accounting system and an operational control system. The cost accounting system is concerned with assigning costs to individual products. The operational control systems Is about evaluating the performance of managers with regard to control activities. This research specifically focuses on cost accounting system, by assigning cost to specific product components within the production
5
Costing methods
Several costing methods have already been developed. Costing methods can be seen as accounting techniques that are used to value the input and its outputs in a production process. Some of the cost methods will be described shortly.
Activity-based costing
Activity-based costing was introduced in the 1980s. Following Kaplan & Anderson (2007) activity based costing is the enhanced version of the traditional standard-cost system, which only includes three cost categories: labor, materials and overhead. The main difference between traditional cost account and activity-based cost accounting can be explained as follows: traditional cost accounting assumes that goods and services is what causes the costs, while activity-based costing assumes that activities cause the costs (Olotu & Adamu, 2009). Activity-based costing is about improving the quality, content, relevance, and timing of cost information (Hansen et al., 2009). It is a way to link indirect costs to the cost drivers of products and services that come along in the production process. Events and transactions that cause costs are recognized as ‘activities’, and a specific cost driver is prepared for each activity (Cao et al.,
2006, p. 213). Cao et al. (2006) argue that the activity-based costing method proves more accurate results than volume-based costing, which will be discussed later.
The disadvantages as mentioned by Kaplan & Anderson (2007) are that ABC systems are expensive to build, complex to sustain, and difficult to modify. In addition, several other problems were summed up:
- ‘The interviewing and surveying process was time-consuming and costly.
- The data for ABC model were subjective and difficult to validate
- The data were expensive to store, process, and report
- Most ABC models were local and did not provide an integrated view of enterprise wide
profitability opportunities
- The ABC model could not be easily updated to accommodate changing circumstances.
- The model was theoretically incorrect when it ignored the potential for unused capacity.’(Kaplan & Anderson, 2007, p. 7)
6
Volume-based costing
Berry & Jarvis define the cost-volume-profit analysis as ‘a tool used by organizations to help them make decisions by examining the interrelationship between cost, volume and profits’(p.
357). The basic equation of the CVP analysis is as follows:
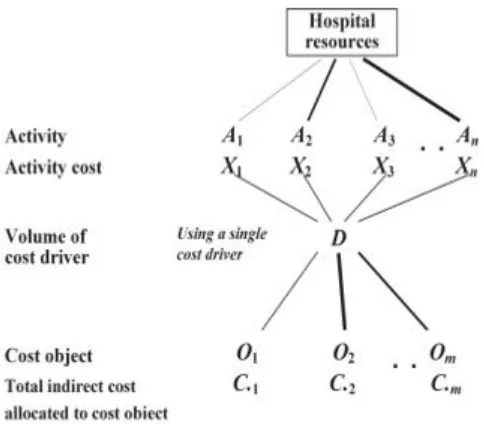
Cao et al. (2006) state that this method is the most popular cost accounting method, where indirect costs are separately allocated to different cost object with a single cost driver. The cost object reflects the unit where the costs are build up, whereas the cost driver reflects the source of the costs. Due to the simplicity of this method, results from this cost accounting methods result often in inaccurate and incomplete resultse. Another disadvantage of this method is the linearity assumption of this equation, which results in the assumption is that the selling price remains constant (Barry & Jarvis, 2011). This assumption often does not hold true, whereas in reality the selling price will often decrease when the volume increases.
Cao et al. (2006) introduced the following models (see figure 1 & figure 2) which reflects the ACB costing method and the VBC method in an accurate way. The main difference can be found in the number of cost drivers.
7 Figure 1. Schematic model of ABC-costing (retrieved from Cao et al., 2006)
8
Absorption costing
In the absorption costing method, indirect services used to support the manufacture of products is been taken into account. Overhead costs in this method are spread out to products and services (Barry & Jarvis, 2011). Barry & Jarvis (2011) developed a three stage model of the absorption costing method. The first stage contains the identification and collection of the overhead costs
that are associated with both production and service cost centers. The second stage is about charging the overhead costs established for service cost centers to the production cost centers.
In stage three, the absorption rate is determined and this proportion of the overhead is added, or absorbed, into the project. One of the limitations of absorption costing is that the absorption rates are estimates. The difference in the estimates and the actual cost cannot be absorbed into the project anymore on a later time. This costs will be classified as period cost. (Barry & Jarvis, 2011)
It can be concluded that every of the above mentioned costing methods have its advantages and limitations. It is therefore important, that while developing the costing methods, these different costing methods should be kept in mind. The costing method that will be developed will focus on the impact factor on speed of every cost driver, which will be discussed later in more detail.
Cost estimation methods
In addition to these costing methods, also a cost function can be very helpful for the determination of a cost analysis for the future. A cost function describes the cost behavior patterns and its cost drivers in a mathematical function (Bhimani et al., 2008). To be able to come up which a cost function, one should first make cost estimations. Following Bhimani et al. (2008), there are four approaches to cost estimation: (1) industrial engineering methods, (2)
the conference method, (3) account analysis method and (4) quantitative analysis of current or past cost relationships. The industrial engineering method analyses the relationship between
9 Usual costing methods that were discussed before aim to accurate the costs of the total
production. The limitation of former costing methods is that they are not able to determine the costs of only a part of the production process. As also some components of the product will be invoiced separately, this research aims to develop a method that will be able to separate components from the total product to measure the costs. This method involves combining former methods and adapt it according to the case study.
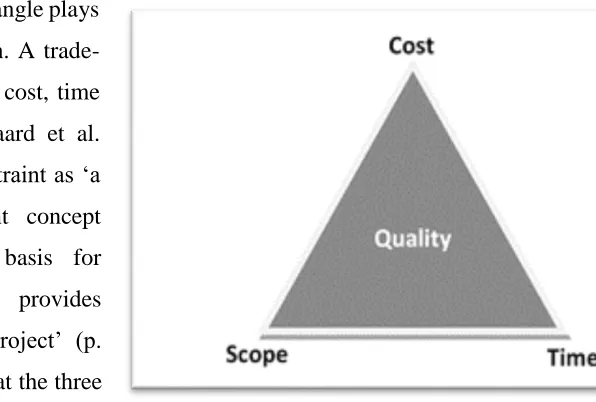
Project Management Triangle
The Project Management Triangle plays a major role in this research. A trade-off should be made between cost, time and its scope. Van Wyngaard et al. (2012) define the triple constraint as ‘a
critical project management concept that originates from the basis for
undertaking a project and provides direction for framing the project’ (p.
1991). The triangle shows that the three forces are interdependent and therefore
one of the forces cannot be changed without changes the other forces. This is the fundamental reason that a trade-off needs to be made. Adding a product component to the original product will lead to a higher production time but will also have more value or quality for its customers. In this research the fundamental question is whether the increase in time and quality are worth considering the increase in costs.
Methodology
[image:9.612.255.553.274.475.2]One of the largest organizations within the graphical industry in West-Europe was selected as the source for this case study. This research will be conducted in the form of a case study, where the developed cost accounting method will be used for its practical application. The type of
10 study associated with this paper is an empirical study based on observations of the production process and several surveys with employees.
Figuur 4. Framework analysis
The research follows a general path towards the end result. This path that is followed can be found in the figure above.
11 drivers will be detected. ‘To understand how costs behave, it is first necessary to understand
the nature of cost ’(Berry & Jarvis, 2011, p. 346). At first, within the general framework, the
processes within an organization are mapped out to grasp the main goal and tasks of the organization. While these are analyzed, one can start mapping out the specific processes where the product component is added. While analyzing the processes within departments, one can easily identify the factors that have effect on the process, and in addition which factors result in additional costs. These factors can then in turn form the input for the second step within the above model.
The second step defines the added product components, to determine which product components are considered to be APC, and which do not fit the definition. The aim of the definition is to frame which APC will be included in the research. Within the general framework, the factors of the cost drivers, and the cost drivers itself will be identified. The factors of the cost drivers are the characteristics of APC that have a direct effect on the cost drivers. The consequences of the cost drivers will be described according to the practical relevance on the costing model. For example, in practice an increase in the number of employees needed, might result in the fact
12 In addition to the model above, this research is based on some boundary conditions. One of the boundary conditions contains the fact that the input should be based on equal personal justification. This means that personal bias is minimized, by using similar steps to determine the levels of the input, for each part of the input. In addition, the organization should own predetermined values about the speed and stationaries of the production process. Without predetermined values, the model cannot be applied to the organization, as there are no standards that can be used for comparisons.
Data collection & analysis
The input of this research will consist of the last five editions of each of the monthly magazines, the last five editions of each of the weekly magazines and the last five editions of special orders. Special orders contain orders that are different from the regular orders. For this case study, the special orders contain magazines that are not printed within the organization, but magazines that are printed externally. The only activity within the organization of this case study is to add the APC. Since therefore, no production of the magazine would have taken place within the organization of the case study, the costs are build up differently.
The information about the order will be distracted from two order management systems. This information includes the specific order number, the type of machine on which the production takes place, the amount of stations, the order influence, the size of the edition and the time of production. This data forms the input for the developed costing model, as will be explained later in steps. The developed costing model will be converted into excel sheets, and the data distracted from the systems named above will run through the specific excel sheets. The results from the model will be shortly explained in the analysis, and per title summarized into a table. The full
analysis can be found in the Appendix.
Framework analysis: (1) Mapping out the process
Production process: mapping out the process flow of the organizations’ process
Figure 1 visualizes the production process of magazines in broad process lines. Data processing
13 customers. This data should be conform guidelines, to make sure that in the next stage the least waste will be produced. After verifying the data, the cylinder is engraved. This cylinder will then be placed into the right position and the printing process starts. After the printing process, the large papers will be cut and folded in the proposed format. The folded and cut quires will be placed on a big coil, and will be transported to the post-process department. The separate product component is added in only the last stage of the production process, the post-process. To conclude, this research narrows down only to step 6 of the total process within the organization.
Figure 5. Process flow of magazine
This study will only focus on step 6 of figure 1, the post-process. To be able to develop a costing method, first the production of the magazine including a APC should be mapped. An
understanding of the production where the APC is added is of crucial importance to be able to map the cost drivers. Therefore, the analysis starts with following the production where the APC was added to the original magazine. For every project, information about the production is extracted from observing and enquiring employees.
Production process within the post-process department 1: binding/ stapling
Figure 5 maps the process flow within the post-process department. At first, the quires that are transported from the printing department to the post-process department are de-coiled. De-coiling is an automatic process, where the quires that are de-coiled form the input of the process. The machine places the quires on top of each, and at the top of these quires, the cover page is placed. The cover page is not places mechanically, and therefore an employee is needed to insert the cover page into the production line. The amount of the quires is dependent on the size of the magazine. On the Staple Department, the quires with the cover page are stapled. Then all the magazines are placed on top of each other and are bounded. The APC can be combined with the
1. Data
processing 2. Engrave cylinder 3. Printing
4. Cut & dolding
5. Pile & coil the
quires
14 original magazine between step 1 and 5. After the activity of bounding to magazines together, the magazines are mechanically put onto a pallet.
[image:14.612.115.582.167.240.2]
Figure 6. Process flow – stapled
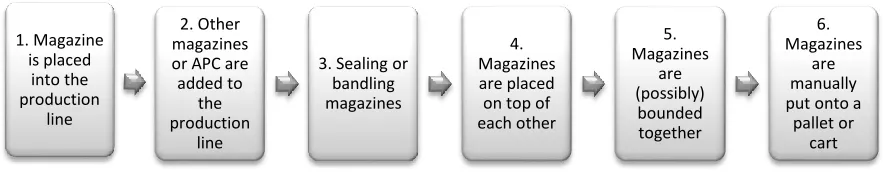
Production process within the post-process department 2: sealing & banding
Figure 6 maps the process flow within the post-process department. The input for the department is formed by magazines, whereas in step two several magazines can be placed onto each other.
In addition, APC can in step 2 be added. Afterwards, the package is sealed or banded and are placed on top of each other. The magazines are possibly bounded together and manually put
[image:14.612.117.563.454.545.2]onto a pallet or cart.
Figure 7. Process flow sealing & banding
Production process within the post-process department 3: yarn less
Figure 7 maps the process flow within the post-process department yarn less. As can be observed, the process is quiet similar to the process from the post-process department binding. The main difference is the bounding activities, whereas on the department yarn less, magazines are bounded with a specific technique without using any yarn or band. After the process is completed, the magazines are bounded together and put mechanically onto a pallet.
1. De-coil of quires
2. Quires are placed on top of each other
3. Cover is added manually, at
the top of the quires 4. Stapling magazines 5. Magazines are placed on top of each other 6. Magazines are bounded together 7. Magazines are mechanicall y put onto a
pallet. 1. Magazine is placed into the production line 2. Other magazines or APC are added to
the production
line
3. Sealing or bandling magazines
4. Magazines are placed on top of each other 5. Magazines are (possibly) bounded together 6. Magazines are manually put onto a
15 Figure 8. Process flow yarn less
It can be concluded that the most employees, considering the content of the magazines being equal, are needed on the department sealing & banding. The reasoning behind lies in the fact that the input magazines, as well as the output, needs to be placed manually.
Based on the above process flows, it becomes clear that the source of raising costs, e.g. technical failure, cannot be easily identified. Additional costs might be due to APC, but they might also arise due to failure in the normal production. Because of this, the costing model will at first be developed according to the standard book. In the standards book, the standards percentages of reduction are determined beforehand.
Framework analysis: (2) Analysis of choices
Conceptualizing added product components (APC)
For this research, added product components (APC) is defined as ‘products or components that are supplied by an external party and are combined with the original product’. In general, APC
can be explained within this research as specials and gimmicks. It is emphasized that only products that are supplied externally, which means not supplied by the company itself or another subsidiary of the company, are considered to be APC. Cover pages are not included as APC, however cover pages are in most of the cases externally supplied. The reason for excluding cover pages from this research, is that the price of the magazine includes the cover page, whereas APC’s are invoiced separately. Since the price for cover pages can therefore not be easily
identified, the added value of it cannot be measures. For APC simply stands; the costs that are detected based on the model will be deducted from the revenue to come up with the added value. One of the important differences to calculate the costs of APC are the lack of raw materials. As the added product components are provided by an external party, direct material costs as well
1. De-coil of quires
2. Quires are placed
on top of each other
16 as raw materials are not included. The added product components by itself forms already an end product, instead of an input for the production line.
Costing model within the general framework
This study applies the developed costing model, which will be discussed now, to determine the total cost that arise because of APC. Several costing models have been discussed already, but are found to be unable to determine only the costs of parts of the production process, instead of the whole production process. This research aims to distinguish the costs from APC from the costs of normal production and therefore, while developing the costing model, it needs to be considered that the costs that belong to APC are separated from the costs that arise during the normal production. The normal production can be defined as the production process of magazines when there is no APC added. The costing model that will be applied at the case study can be considered as a modification of two costing methods, namely activity-based costing and
volume-based costing. From the perspective of activity-based costing, a part of the indirect and support costs are calculated within the cost factor ‘machine costs’. In addition, the costs of APC
arise because of the activity of ‘adding the separate product components’. As was mentioned
earlier, activity-based costing assumes that activities cause the costs (Olutu & Adamu, 2009). In broad sense, it can therefore be understand that this research focuses on measuring the cost of the activity of actual adding the product components. On the other hand, from the perspective of volume-based costing, this research tries to reduces the number of cost drivers, by linking the characteristics either to a reduction of speed or to a whole additional production line needed as a result of the APC. Above that, this perspective also includes the relation between costs, volume and profit, which will be taken into account while analyzing the results.
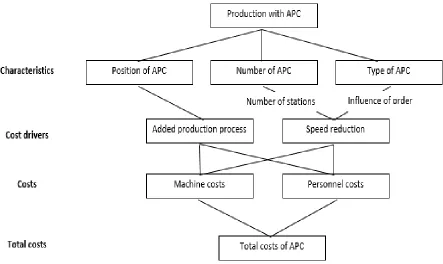
17 APC that influence a specific cost driver are ‘position of APC’, ‘amount of APC’, and ‘type of
BPO’. The two cost drivers are (1) the reduction in speed and (2) an additional production line.
When a whole additional production line is needed because the product components is added, all costs can be assigned to the APC. The reason behind this is because this production line would not have been needed when the APC was not added. Since this research aims to measure only the costs of APC, the model tries to find the difference in production speed with and without
[image:17.612.123.566.282.546.2]APC. This production speed will then be compared and based on that a speed reduction is determined. As has already mentioned earlier, the total costs are based on two cost factors, namely machine costs and personnel costs.
Figure 9. Costing model ABC/VBC within the general framework
The costing model, which can be found in figure 8, contains the model within the general
18
Note: Install and construct time will not be taken into account in the costing model based on the predetermined values in the standard book. It has become clear that the values for install and construct time established in the standard book differ too much from reality. This noise will affect the results if we compare the standards with the reality, since the source of the difference cannot be found. Since the practical applications of the costing model above differ per department, the assumptions and its practical use will be explained per department as well.
Determination of personnel costs and machine hourly rate
This research is based on the conference method to estimate the average personnel and machine costs. Cost estimates are based on opinions about costs and their drivers, which information is gathered from various departments of the organization (Bhimani et al., 2008).. Employees from the manufacturing, employee relations and support function are interviewed and based on the analysis the costs are estimated. By using the cost estimates, the cost functions are developed, which can then be used as the formula within the developed costing model.
As mentioned above, this research is based on the facts that there are two costs factors, namely
machine costs and personnel costs. To make sure that the costs for the APC are distinguished from the cost that arise due to normal production, the machine costs and personnel costs should be separated from each other. The machine costs and personnel costs that can be assigned to APC are calculated differently, and even the calculation differs per department which will be explained in the following section. Personnel costs that are assigned to APC are calculated on the bases of the delay of the production time, but next to that also about the amount of extra employees needed during the total production, due to the APC. Machine costs are mainly based on the delay that results from adding the product components. Therefore, since the calculation for these costs factors differs, machine costs and personnel costs should be calculated separately, and in the end be summed up to get the total costs.
Personnel costs
19 chosen carefully. Therefore, to determine the personnel costs this research applies three averages of surcharges. As the difference between the surcharge for weekdays and weekend its large, but in many cases the production will run in both weekend and weekdays, there has been chosen to apply a third surcharge for partial weekend/ partial weekdays. Therefore, the surcharges are averages of the percentage surcharges for weekdays, weekends and partial weekend/ partial weekdays.
Machine costs
The machine hourly rate that is known within the organization of this case study, is the hourly rate including personnel costs. As explained above, it is crucial to separate these two cost factors first, since the calculated to assign it to APC is different. To ensure that the two cost factors are separated, the personnel hourly rate that is included in the machine hourly rate should be removed.
Costing models within the specific framework
Generally, business customers do not want the edition to exist out of the exact same parts. This
means that for part of the edition customers might want to add more than one added product, whereas for the other parts they might not want to include any ACP. Therefore, as a starting point it is first of all important to divide the order into partial orders, which have then in turn the exact same content.
20
Department 1: binding/stapling
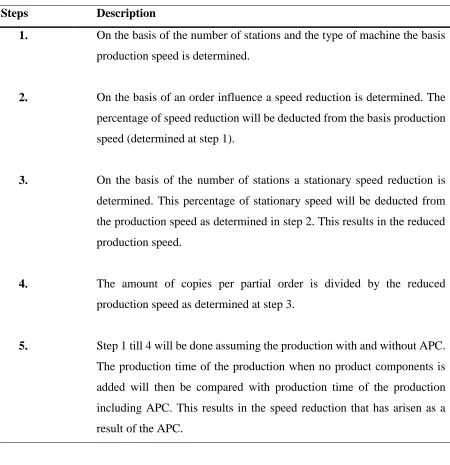
[image:20.612.118.568.204.669.2]The calculation of the speed reduction as a result of adding the product components at the department ‘binding or stapling’ takes place as follows:
Table 1. Determination of speed reduction within department 1
Steps Description
1. On the basis of the number of stations and the type of machine the basis production speed is determined.
2. On the basis of an order influence a speed reduction is determined. The percentage of speed reduction will be deducted from the basis production speed (determined at step 1).
3. On the basis of the number of stations a stationary speed reduction is determined. This percentage of stationary speed will be deducted from the production speed as determined in step 2. This results in the reduced
production speed.
4. The amount of copies per partial order is divided by the reduced production speed as determined at step 3.
5. Step 1 till 4 will be done assuming the production with and without APC. The production time of the production when no product components is added will then be compared with production time of the production including APC. This results in the speed reduction that has arisen as a result of the APC.
21 It should be considered that by adding an APC, the actual reduction is higher than the
reduction due to the order influence. The order influence is the percentage of reduction that is chosen to reflect the estimated difficultness of the APC. In practice the actual reduction of the basis speed is higher, due to a higher amount of stations. An example is illustrated below.
After the determination of the speed reduction the machine costs and personnel costs will be calculated. To ensure that exclusively the personnel costs that result from the APC are calculated this research makes use of the following formula:
P-ordernumber X1 has a total of 4 APC’s (called: Inst1 Libelle werf, Plk Libelle Zomer, Inst1
Olymp Broch, Ins2 Het Vinkje). This p-number is assigned with an order influence of 4. This order
influence results in 15% speed reduction.
Reduced speed after total decrease: 11388,15
P-ordernumber X2 has a total of 3 APC’s (Plk Libelle Zomer, Inst1 Olymp Brock, Ins2 Het Vinkje).
This p-number is assigned with an order influence of 6 This order influence results in 10 % speed
reduction.
Reduced speed after total decrease: 12638,77
Based on this example it can be observed that the APC Inst1 Libelle werf results in a 5%
(15%-10%) additional order influence reduction. The total speed reduction per hour as a
result of this APC is 1250,55 (12638,77-11388,15). If we transfer this back to a percentage
of reduction, we get a reduction of 9,89%
The reasoning behind lies in the increased speed reduction due to a higher amount of stations.
22 𝑃𝑒𝑟𝑠𝑜𝑛𝑛𝑒𝑙 𝑐𝑜𝑠𝑡𝑠 𝑜𝑓 𝐴𝑃𝐶
= (𝑑𝑖𝑓𝑓𝑒𝑟𝑒𝑛𝑐𝑒 𝑖𝑛 𝑛𝑒𝑒𝑑𝑒𝑑 𝑒𝑚𝑝𝑙𝑜𝑦𝑒𝑒𝑠 𝑎𝑠 𝑟𝑒𝑠𝑢𝑙𝑡 𝑜𝑓 𝐴𝑃𝐶 𝑥 𝑝𝑟𝑜𝑑𝑢𝑐𝑡𝑖𝑜𝑛 𝑡𝑖𝑚𝑒 𝑤ℎ𝑒𝑛 𝑛𝑜 𝐴𝑃𝐶 𝑖𝑠 𝑎𝑑𝑑𝑒𝑑)
+ (𝑎𝑚𝑜𝑢𝑛𝑡 𝑜𝑓 𝑒𝑚𝑝𝑙𝑦𝑒𝑒𝑠 𝑛𝑒𝑒𝑑𝑒𝑑 𝑓𝑜𝑟 𝑝𝑟𝑜𝑑𝑢𝑐𝑡𝑖𝑜𝑛 𝑤𝑖𝑡ℎ 𝐴𝑃𝐶 𝑥 𝑑𝑒𝑙𝑎𝑦 𝑎𝑠 𝑟𝑒𝑠𝑢𝑙𝑡 𝑜𝑓 𝐴𝑃𝐶)𝑥 (1
+ 𝑝𝑒𝑟𝑠𝑜𝑛𝑛𝑒𝑙 𝑐𝑜𝑠𝑡𝑠 𝑠𝑢𝑟𝑐ℎ𝑎𝑟𝑔𝑒)
The machine costs that will be assigned to APC can be calculated as follows: 𝑀𝑎𝑐ℎ𝑖𝑛𝑒𝑐𝑜𝑠𝑡𝑠 𝑜𝑓 𝐴𝑃𝐶
= (𝑐𝑜𝑠𝑡𝑠 𝑜𝑓 𝑎𝑑𝑑𝑖𝑡𝑖𝑜𝑛𝑎𝑙 𝑠𝑡𝑎𝑡𝑖𝑜𝑛 𝑛𝑒𝑒𝑑𝑒𝑑 𝑥 𝑝𝑟𝑜𝑑𝑢𝑐𝑡𝑖𝑜𝑛 𝑡𝑖𝑚𝑒 𝑤ℎ𝑒𝑛 𝑛𝑜 𝐴𝑃𝐶 𝑖𝑠 𝑎𝑑𝑑𝑒𝑑)
+ (ℎ𝑜𝑢𝑟𝑙𝑦 𝑚𝑎𝑐ℎ𝑖𝑛𝑒 𝑟𝑎𝑡𝑒 𝑥 𝑑𝑒𝑙𝑎𝑦 𝑎𝑠 𝑟𝑒𝑠𝑢𝑙𝑡 𝑜𝑓 𝐴𝑃𝐶)
Within the department ‘binding’ the machine costs are based on an hourly machine rate plus an
surcharge per additional station. Because sometimes APC are not added in the whole order, the average amount of station during the production should be chosen. This means that when only in a small part of the order an APC is added, the costs of an additional station should not be calculated. For this, one needs to leek first at the total number of copies that is included in the order.
Next to the delay in the production, another cost factor might occur. A whole additional production line might be needed because of adding the product components. This is due to the specific position of the APC. As these production was not needed when the product components were not added, all the costs can be assigned to the APC. To calculate the total costs, one can follow step 1 till 4 from the above. The total production time is then calculated, and can be multiplied by its personnel hourly rate and its machine hourly rate.
Department 2: sealing & banding
Within the department sealing & banding it is first of all important to determine if the production would have taken place within this department if no APC was added. In some cases, it might occur that the production could be finished on the department ‘binding’ when there was no APC
23
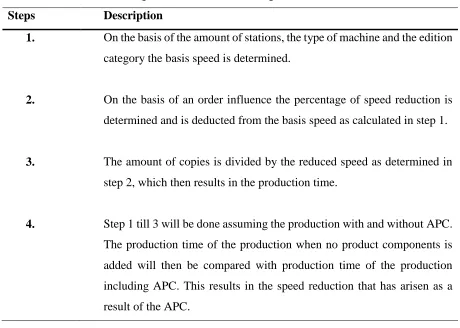
Table 2. Determination of speed reduction within department 2
Steps Description
1. The basis speed is determined based on the type of machine.
2. On the basis of an order influence a percentage of speed reduction is determined. This percentage is then be deducted from the basis speed, which in turn results to the reduced speed.
3. The amount of copies is divided by the reduced speed as determined in step 2, which then results in the production time.
4. Step 1 till 3 will be followed assuming the production with and without APC. The production time of the production when no product
components is added will then be compared with production time of the production including APC. This results in the speed reduction that has
arisen as a result of the APC.
After the determination of the total delay, the personnel costs and machine costs are calculated. The personnel costs can be calculated in the way that has been mentioned in the last section.
The machine costs that can be assigned to APC can be calculated by multiplying the time of delay by the machine hourly rate. The machine costs within the department sealing & banding are not dependent on the amount of stations, which because of this leads to lower machine costs.
24 From the above, it becomes clear that there is one important difference between the department binding and sealing & banding. This important difference lies in the determination of the basis speed. For the department binding, the basis speed is determined based on the type of machine and the amount of stations. In contrast, the basis speed within the department sealing & banding is determined based on only the type of machine. This means that the delay in production time within the department sealing & banding is only based on a higher order influence. In the case that production with and without order influence gains the same order influence, there will be no speed reduction and therefore no delay. As the machine costs and personnel costs are only based on the delay of production time, this results in costs of zero.
Department 3: Yarn less
The determination of the delay as a result of APC within the department ‘yarn less’ takes place
[image:24.612.111.571.388.716.2]on the following manner:
Table 3. Determination of speed reduction within department 3
Steps Description
1. On the basis of the amount of stations, the type of machine and the edition category the basis speed is determined.
2. On the basis of an order influence the percentage of speed reduction is determined and is deducted from the basis speed as calculated in step 1.
3. The amount of copies is divided by the reduced speed as determined in step 2, which then results in the production time.
25 Within the department ‘yarn less’ the basis speed is, next to the type of machine and the amount
of stations, determined on the basis of an edition category. The edition category should be chosen based on the total amount of copies, so not the amount of the partial orders. Therefore, adding a APC does not influence the edition category. In contrast, it does influence the basis speed because of the increase in the amount of stations.
[image:25.612.114.577.352.539.2]After the determination of the total delay in production time as a result of the APC, the personnel costs and machine costs are calculated. This personnel costs can be calculated in the same way as mentioned in the section of the department binding. The machine costs can be calculated by multiplying the hourly rate by the delay in production time, since the machine costs are not dependent on the amount of stations.
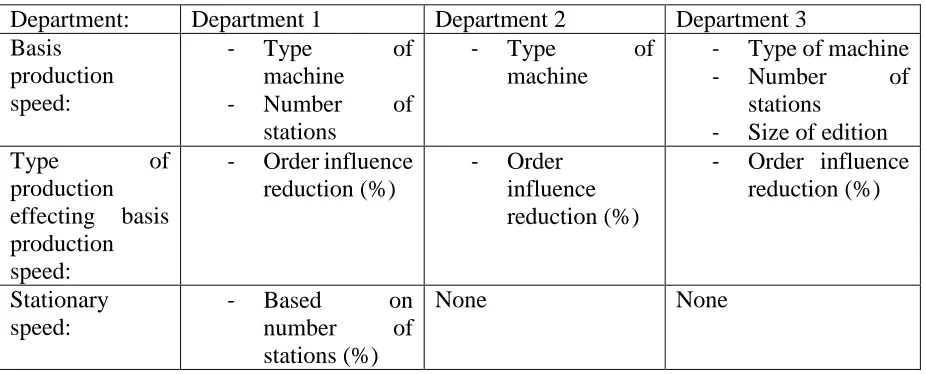
Table 4. Summarizing table of factors determining the production speed
Department: Department 1 Department 2 Department 3 Basis
production speed:
- Type of
machine
- Number of stations
- Type of
machine
- Type of machine - Number of
stations - Size of edition
Type of
production effecting basis production speed:
- Order influence reduction (%)
- Order influence reduction (%)
- Order influence reduction (%)
Stationary speed:
- Based on
number of stations (%)
None None
26
Framework analysis: (3) Comparisons
The post-hoc analysis: a measure for reliability & validity
Since the input for the costing model for this research is based on predetermined value which
are stated within the organization, one can perform an post-hoc analysis. Within this research, the post-hoc analysis involves looking at the data, or production time based on the model, after
the proposed costing model has been applied, and compare the production time following the model with the real production time. By doing this, one might be able to find a pattern within the spread of variety of APC. In addition, comparing the production times as derived from the analysis with the real production times gives a level of indication about the reliability of the predetermined values which are familiar within the company. Despite the fact that the post-hoc analysis gives some added value to the research, it also faces an important limitation. The difference between the production time based on the analysis and the real production time cannot be explained with certainty by the APC. It cannot be concluded if the differences in production times are caused by the APC, or if this difference is maybe caused by factors and disruptions in the normal production. However, one can look whether the results show a certain pattern, and whether there are certain characteristics of APC that have significant different results than the production time based on the predetermined values.
To ensure validity, it is important that the production times based on the analysis are compared with the correct values. Testing the validity ensures that the model measures what it actually intends to measure. Therefore, the factors that are taken into account in calculating the production time for the analysis, should also be taken into account to make sure that the correct production time is taken. The factors that have been taken into account within the analysis are
27 The post-hoc analysis shows the deviation from the production time based on the analysis. Since the quantity of the edition has a large influence on the deviation, the deviation should also be stated in terms of percentages. Representing the pro rate deviation gives the ability to make an accurate comparison.
Results of the case study
The aim of the developed costing model within the company where the case study is conducted, is to evaluate whether APC are profitable. The analysis and the results of the case study can be found in the appendix. The tables within the analysis summarizes the results of the analysis, and conclude the added value of the APC per edition of each title. Since the analysis contains competition-sensitive information, the appendix can only by obtained by contacting the author. This research, therefore, only summarizes the main finding:
Based on the results, it can be concluded that the largest part of APC are profitable. But, the results also show for some APC negative results, which means that the costs of adding the product components are higher than the income. In addition, it can be questioned whether in some cases the low profits are high enough to cover the costs when in reality the production process has taken longer than the production time based on the predetermined values. Since the post ad-hoc analysis gives no insight into the true production times of only APC, this research cannot conclude the profitability with the real production values. The results of the case study show a positive relation between the size of the edition and the profitability of APC.
Discussion
28 addition to be able to determine the information necessary for the costing model. Within the second step of the model, several specific choices have been made towards the inclusion of information in the model. A detailed consideration of the factors is necessary to keep the model orderly, as well as accurate. As the factors are detected, one can search for their effect on the production line. These factors, called cost drivers, will then i n turn result in extra costs, which can be assigned to added product components.
The proposed costing model shows that for APC the two main costs drivers are speed reduction, and a new production line. These two costs drivers results in two costs, namely personnel costs and machine costs. As the model only aims to measure the costs of APC, the study has shown support why it is crucial to separate the personnel costs and machine costs. In addition, this research shows that for different departments, one should have a close look towards the type of analysis that is performed. This is due to the fact that different production methods perform different activities, which result in different factors that have influence on the cost drivers. Following the proposed general and specific framework helps to frame the departments and the activities within this department.
The third part of the framework consists of the post-hoc analysis, where the production time following the model and the real production time are compared. As mentioned before, this comparisons is only able to provide little information about the added value of APC. In contrast, the post-hoc analysis gives insight into the reliability of the results of the model, and the validity about the proposed values that this research aims to measure. It forms also an important insight for future research opportunities. Namely, an interesting field would be to know whether in reality the profitability of APC still holds. More research is needed to develop a model that is able to measure the costs based on real production values.
Based on the case study, the following relations can be stated:
• The chance that the production is completed in less time than the production time based
on the analysis is higher when the size of the edition increases:
29 • There is a positive relation between the size of the edition and the profitability of added
product components:
An implication for this relation would be as follows: The positive relation between the size of the edition and the profitability of APC might be explained by the level of experience. The longer time a production takes, the more experience the employees have. Because of more experience with the APC, less stationaries occur which has a positive effect on the production time.
• The chance that the production is completed in less time than the production time based
on the analysis is higher when the production takes place on department 1: ‘binding’: An implication for this relation would be as follows: The calculation of the basis speed of the production within this department is based on the type of machine and the amount of stations. In contrast, the basis speed within department 2 is only based on the type of machine. In reality, it might be the case that the calculation of the basis speed within department 2 is not realistic, since logically a higher amount of stations have a higher probability of getting a default. Therefore, since within department 1 the number of stations is calculated within the basis speed, the production time based on predetermined values
might be more realistic.
One of the main conclusion of the case study is that the results show a high variation level. This high variation level means that the results do not show a significant pattern for types of APC. Within the results, there is no specific characteristics of an APC for which have found significant different results than for other characteristics. Therefore, also no strong evidence can be found for which type of APC gives a high profitability, and which APC gives in many cases a significant loss. Only partial evidence is found for the following relation:
• The profitability is higher for the type ‘placard’.
30
Conclusion
This research aims to answer the question: ‘how to allocate separate costs to product
components that are added to the original product?’, by developing a costing method. This study shows that, when a company aims to measure the cost of added product components,
it should mainly focus on the factors that make up the differences in cost between the regular production and the production including the added product components. These specific factors can be identified by mapping out the process. The general and specific framework can help with this, to be able to determine the different steps in the production process and to identify several factors. At first, one should identify which factors or characteristics of APC influence the production process and indirectly the costs. Secondly, the cost drivers should be identified. The third step is to focus on the costs. This research only aims to measure the cost of APC, and therefore the formulas for calculating machine costs and personnel costs should be determined carefully to ensure that only the costs of APC will be measured.
Limitations
One of the limitations of the developed costing model lies in the form of input. Since the input is based on personal judgement, it might be the case that the input is biased and contains input errors. In practice, this means that the same type of APC gains, incorrectly, different levels of order influences, which result in a different speed reduction. This research assumes that the input from the department OrderManager is correct, and therefore does not take this error into account.
Another limitations can be found in the fact that the development of the costing method is based on several assumptions. Since the cost estimations are made using the conference method (Bhimani, 2008), the accuracy of the cost estimates largely depends on the care and detail taken by the people providing the input. This means that the input and the
31 subjective. In contract, the conference method allows cost estimates to be developed quickly, which forms an advantage for this research. The use of subjective information i n the proposed model allows alterations in the model to be performed more easily. This research acknowledges the disadvantages of subjective information as an input, but due to the advantage for this research the conference method is found to be useful and appropriate.
Another limitations might be found in the use of averages for costs. Personnel costs are based on averages, which might be over-generalized since the variation in the surcharges are large. This research acknowledges the disadvantages of using benefits, but for this research the advantages outline with the disadvantages. As the goal of this model is to be easily applicable in practice, a more complex model would be too time-consuming. The decrease to only two cost drivers makes the model more accessible. In addition, a more complex model would only be accessible for individuals that have lots of insight knowledge about the company. The proposed model in this research only asks only for limited knowledge about the factors influencing the production process. In addition, former and more complex costing models would aim to measure for example activity, or would aim to
32
References:
1. Berry, A., Jarvis, R. (2011) Accounting in a Business Context
2. Bhimani, A., Horngren, C.T., Datar, S.M., Foster, F. (2008) Management and cost accounting
3. Cao, P., Toyabe, S., Akazawa, K. (2006) Development of a Practical Costing method
for Hospitals. Tohoku J. Exp. Med, 208(3), 2113-224
4. Hansen, D.R., Mowen, M.M., Guan, L. (2009) Cost Management: Accounting and
Control (6rd ed.).
5. Johnson, H.T., Kaplan, R.S. (1987) Relevance Lost: The Rise and Fall of Management
Accounting
6. Kaplan, R, Anderson, S.R. (2007) Time-Driven Activity-based costing: a simpler and
more powerful path to higher profits.
7. Olotu, I.A., Adamu, A. (2009) The Practicability of Activity – Based Costing System in
Hospitality Industry. A Journal of the Department of Accounting, p. 36-49.
8. Saniuk, A. Saniuk, S., Witkowski, K. (2011) Using activity based costing in the metal working processes. Metal 2011: Anniversary International Conference on Metallurgy and Materials, p. 1328-1333
9. Wegmann, G. (2008). The activity-based costing method: development and applications.
The IUP Journal of Accounting Research and Audit Practices, 5(1), p. 7-22