University of Twente
Faculty of Behavioural, Management and Social Sciences
Department Technology Management and Supply
Prof. Dr. Holger Schiele
Dr. N.J. Pulles
Master Thesis MSc. Business Administration
Topic:
Via a cost estimation model for volatility towards a
more efficient supply chain: a case study at Case
company.
Submitted by: Kirsten van der Reest
s0162302
Contact E-mail: [email protected]
Number of pages/words: 69/22.439
Bibliography program used: Mendeley
Management Summary
Nowadays many organisations have to operate in an uncertain and fast changing environment, which is highly turbulent and volatile. This brings constraints and limitations and therefore requires a high amount of flexibility within organisations. This research has a focus on demand side uncertainty, the frequent and unpredictable changes in demand. The research has been carried out at a case company, a producer of fast moving consumer goods (FMCG) in the personal care industry. The problem statement analysed was “How should FMCG organisations deal with volatility of customers’ demand and its related costs within their supply chain?”. The goal of this research was to provide a better understanding of the impact of volatility on costs and to provide the case company with hands-on recommendations to become less dependent on the volatility of their customers’ demand.
To carry out this research the design science methodology has been used. This methodology focusses on whether a particular design is suitable in a given setting. The design science methodology is recognised for its ability to bridge the relevance gap between theory and practice. During the relevance cycle the case has been analysed extensively, to identify the relevance of the problem statement. During the rigor cycle a literature research has been carried out in order to identify the origins, consequences and costs of volatility and their applicability on the FMCG business. This general knowledge has been applied on the specific case, resulting in a volatility cost model which did not exist in academic literature yet. The model shows that both process related costs as well as overhead costs are subject to volatility. During the design cycle a redesign for the process analysed within the case company has been developed. By moving the decoupling point upstream in the process and by eliminating additional process steps as much as possible the organisation will obtain a more flexible and less expensive supply chain. If customisation on products is only done after the customer demand, the order, is fully known the organisation will become less vulnerable to volatility in their customers’ demand, because the demand of the customer will penetrate less far into the process.
Content
Management Summary ... III Index of figures and Tables ... VIII List of abbreviations ... IX 1 Introduction: volatility in demand leads to high costs and either excess stock or out of
stock situations – The relevance cycle ... 10
1.1 Introduction to volatility and its implications ... 10
1.2 Description of Case company Amsterdam: a subsidiary of an international producer of innovative skin care products ... 10
1.3 Case description: the volatile demand curve and the repack process for Customer A lead to inflexibility, high transport costs and storage of two variants per article ... 11
1.4 Problem statement: “How should FMCG organisations deal with volatility of customers’ demand and its related costs within their supply chain?” ... 13
1.5 Thesis structure: a cost estimation model as a basis to be less dependent on volatility ... 15
2 Research methodology ... 15
2.1 Goal of this research: to provide a better understanding of the impact of volatility on costs and to provide Case company with recommendations to become less dependent on the volatility of their customers’ demand ... 15
2.2 Design science research: interaction between the environment, the knowledge base and a new design ... 16
2.3 The relevance cycle: identifying the relevance of the problem ... 17
2.4 The rigor cycle: a literature review to find applicable knowledge ... 18
2.5 The design cycle: towards a cost calculation model and a new process design ... 19
2.6 Collection of data ... 19
3 The origins of volatility and their implications for business – The rigor cycle ... 20
3.2 The history of volatility: findings in the financial sector have triggered volatility related research in the domain of supply chain management, resulting in the bullwhip
effect as most often researched phenomenon ... 23
3.3 The origins of the highly volatile environment require a high amount of flexibility within the supply chain ... 25
3.3.1. Short product life cycles contribute to a volatile environment... 25
3.3.2. Delivery time uncertainty leads to volatility in supply ... 26
3.3.3. Frequent and unpredictable changes in demand are called demand volatility ... 26
3.3.3.1. Client behavior causes significant sales fluctuations ... 26
3.3.3.2. Seasonality causes high peaks in customer demand ... 27
3.3.3.3. Changes in consumer preferences lead to volatility in demand ... 27
3.3.4. Competitor behavior ... 28
3.4 Consequences of volatility for the supply chain: influence on inventory levels, production plans and a company’s product offerings lead to increasing costs and an ineffective coordination of the supply chain ... 29
3.5 Costs of volatility: a general cost model for the calculation of volatility costs ... 30
3.6 Conclusion: volatility is costly and requires a high amount of flexibility within the supply chain ... 38
4 A flexible supply chain design is required to handle volatility – The rigor cycle ... 40
4.1 Technical solutions ... 40
4.1.1 Supply chain flexibility to handle volatility: three drivers of flexibility to mitigate the risks related to demand volatility ... 40
4.1.2 Lean versus agile supply chains: differences and similarities ... 42
4.1.3 The leagile supply chain: a best of both worlds strategy with the decoupling point as key characteristic to compete in volatile markets ... 44
4.1.4 Form postponement is the leagile approach to obtain maximum flexibility to meet the customers’ volatile demand ... 45
4.2 Commercial solutions ... 47
4.2.2 Sourcing flexibility ... 48 5 Current situation and options for change: demand volatility and the current repack process cause inflexibility and high costs ... 49
5.1 Current situation – The relevance cycle ... 49 5.1.1 Design of the current repack process: it takes on average 19 days to get the product from the warehouse via the subcontractor to the customer ... 49 5.1.2 Costs of the current repack process: additional transport costs, subcontractor costs and higher storage costs ... 50 5.2 Change proposals – The design cycle ... 52 5.2.1 Technical solution: three scenarios to create a more robust repack process ... 52 5.2.2 New process: Implement the three scenarios one after another to make the process more robust and shorter, to have a more flexible supply chain and to obtain a cost saving of at least €77.906,17 ... 55 5.2.3 Short term: implement the repacking process at the warehouse, long term: move towards a vendor managed inventory process to further minimise the risk on obsolete stock or out of stock situations ... 56 6 Conclusions and recommendations – The design cycle ... 57
Index of figures and Tables
Figure 1: Sell out quantity (all ADR products) in 2012 ... 13
Figure 2: Research model, based on Hevner et al., 2004; Hevner, 2007 ... 17
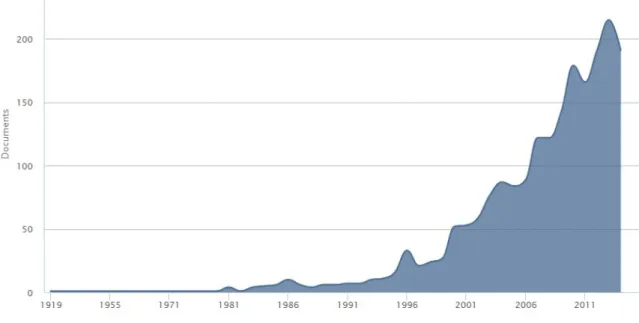
Figure 3: Publications on Scopus search query ‘volatility’ (October 19, 2014) ... 20
Figure 4: Publications on Scopus search query ‘volatility AND business’ (October 19, 2014) ... 21
Figure 5: Publications on Scopus search query ‘volatility AND costs’ (October 19, 2014) ... 21
Figure 6: Publications on Scopus search query ‘demand volatility’ (October 19, 2014) .... 22
Figure 7: Volatility cost model ... 31
Figure 8: Sell-out data 2012, Brand A Deodorant at Retailer A ... 31
Figure 9: Sell out data 2012, Brand A Deodorant at Retailer B ... 31
Table 1: Structured overview of problem statement and research questions ... 15
Table 2: Influence of the repack process on the cost model ... 34
Table 3: Volatility costs excluding overhead costs ... 35
Table 4: Volatility costs including overhead costs ... 38
Table 5: Key characteristics of lean and agile supply chain strategies ... 43
Table 6: Shortest path description of the current repack process... 50
Table 7: Number of repacked products for Customer A ... 51
Table 8: Comparison of scenarios resulting in a more robust supply chain ... 53
List of abbreviations
ADR ‘Accord européen relatif au transport international de marchandises Dangereuses par Route’ – classification for flammable products DCS Delivery to customer and storage
FMCG Fast moving consumer goods
LAS Logistics added service – repacking is done after picking the goods MRP Material requirements planning
OOS Out of stock PS Problem statement RQ Research question SC Subcontractor SKU Stock keeping unit
1 Introduction: volatility in demand leads to high costs and either excess stock or out of stock situations – The relevance cycle
1.1 Introduction to volatility and its implications
Today, many companies face an uncertain environment which is highly turbulent and volatile1. In general, four sources of uncertainty can be identified; supply side uncertainty,
process side uncertainty, control side uncertainty and demand side uncertainty2. This
research will focus on demand side uncertainty, the frequent and unpredictable changes in demand. However, different types of volatility will be addressed during the literature review. Volatility is a phenomenon that describes frequent, rapid and unpredictable changes3. The research will be carried out at a case company, a producer of fast moving
consumer goods (FMCG) in the personal care industry. The impact of volatility in demand for their business will be researched. Demand volatility is defined as inconsistent, highly variable demand for a company’s goods and/or services4.
Volatility has an influence across organisations, both on the process and the control side of an organisation. Volatility can have an impact on prices, demand, security of supply, planning, sourcing, and so on. This means that the whole supply chain will be influenced by volatility on a daily basis. Unsecure upstream and downstream prices directly affect the profit margins of organisations5. Unsecure demand and supply directly affect stock levels,
production planning schedules and sourcing decisions. In a broader perspective volatility can even influence make or buy decisions, investment decisions, the amount of labour needed and the use of subcontractors. Volatility obviously results in additional costs for an organisation. A mismatch in demand and supply results in either excess stock or out of stock situations6. Furthermore, volatility can result in adjusted or extra process steps and
necessary investments in people and processes.
1.2 Description of Case company Amsterdam: a subsidiary of an international producer of innovative skin care products
This research will be carried out within Case company Amsterdam, an independent subsidiary of Case company head quarter. The company produces innovative skin care
1 See Tachizawa/Thomsen (2007), p.1115 2 See Yang/Burns (2003), p.2082
3 See Oxord Dictionary, via http://www.oxforddictionaries.com/definition/english/volatile 4 See Saldanha et al. (2013), p.314
products and is responsible for the supply of A-listed brands like Brand A, Brand B and Brand C. Case company head quarter was founded in 1882, Case company was established in 1932. Globally, the company focuses on fast growing markets in Asia and South-America, to stay competitive in the fast moving market. The company consists of more than 150 affiliates and has more than 16.500 employees. Around 80 people in different disciplines are working at the office of Case company in Amsterdam, to supply the Dutch market. Case company does not have a production facility in the Netherlands, the products for the Dutch market are mainly produced in Germany and Poland.
1.3 Case description: the volatile demand curve and the repack process for Customer A lead to inflexibility, high transport costs and storage of two variants per article This research wascarried out at the supply chain department of Case company, which especially has to deal with the sometimes highly volatile demand of Case company’s customers. The research will focus on so called value added services (VAS) articles that fall under ADR legislation and are delivered to Customer A (Retailer B and Retailer A). Articles fall under ADR legislation when they are flammable. ADR is an abbreviation for
‘Accord européen relatif au transport international de marchandises Dangereuses par Route’, which states that all flammable products must be classified, in order to decide how they should be treated, transported and stored7. The decision to focus on these ADR
products was made because they are costly to transport and store, as precautions for fire prevention have to be taken. Furthermore, some very good selling articles, like Brand A deodorants and hair sprays, are amongst this group of products which makes this a relevant research for Case company.
An article becomes a VAS article when it is cultivated and therefore differs from a standard product. For Customer A, Case company has to repack all their standard products. Standard products, shower gels, deodorants, shampoos etc., are packed with twelve in a carton and shrinked (packed together in plastic) per six products. Customer A however, wants to receive these products in cartons that contain only six pieces of an article. These requirements from Customer A have to do with the storage of flammable products in their warehouses and shops and the number of items that can stay on the shelf.
7 See Rijksinstituut voor Volksgezondheid en Milieu, Risico’s van stoffen – ADR (n.d.). Downloaded July
After production the products for the Dutch market are shipped and stored at a warehouse in ‘s Heerenberg, which is not owned by Case company. Case company has to repack all their standard products for Customer A due to above mentioned requirements made by the customer. In the current situation all products that are to be delivered to Retailer B or Retailer A need to be transferred from the warehouse in ‘s Heerenberg (Gelderland) to the subcontractor in Stadskanaal (Groningen), and vice versa. Furthermore, this means that the warehouse in ‘s Heerenberg has two types of storage for every article, the standard variant and the repacked Customer A variant. This repack process results in high transport costs (around €75.000,- a year only for Customer A articles) and inflexibility due to storage of two variants of the same article. Case company establishes a rolling promotion planning with all their customers to get visibility on peaks in demand, since these peaks in demand are almost always caused by promotions as figures 7 and 8 will show. However this still does not give Case company full visibility on demand, since Customer A can change the place where products will be placed in stores during promotions within days. It makes a difference if products appear on their regular spot on the shelf, or that they are displayed at the front end of the shelf. Since volatility is a phenomenon that describes frequent, rapid and unpredictable changes the demand of Customer A will be considered volatile8. As
figures 7 and 8 show promotions placed at the front end of the shelf can result in twice as high sales and therefore demand as promotions placed at the regular spot on the shelf.
Because of the high volumes (repack quantity around 4.1 million pieces a year), the volatility of Customer A’s demand and the fact that Customer A is the second biggest customer of Case company (see figure 1), it is worthwhile to investigate whether a change in the process of repacking ADR products for Customer A could lead to more flexibility in the supply chain and a cost saving for Case company.
Figure 1: Sell out quantity (all ADR products) in 2012
1.4 Problem statement: “How should FMCG organisations deal with volatility of customers’ demand and its related costs within their supply chain?”
Based on the available information regarding demand volatility, and the case description provided, the problem statement for this research is:
“How should FMCG organisations deal with volatility of customers’ demand and its related costs within their supply chain?”
The problem statement should be answered through several research questions, which are outlined below.
This research will focus on volatility in demand. The goal is to provide organisations with an opportunity to deal in a more efficient way with demand volatility. To examine how a company can deal best with this volatility, it is important to identify the origins of volatility. Therefore, the first research question will be:
“What are the origins of volatility?”
After the origins of volatility have been identified it is important to get a clear view on their consequences for the business. By examining the consequences the impact of volatility on supply chain management will become clear. This results in the second research question:
“What are the consequences of volatility for the business?” 40%
14% 17% 12%
5%
Sell-out quantity 2012
Unipharma A.S. Watson Group EtosAlbert Heijn Superunie
Detail Result Group C1000
A company needs to make profit in order to survive in the market. Since competition in the FMCG sector is heavy nowadays, it is important to produce, sell and deliver the products as (cost) efficient as possible. To make the (repack) process more cost efficient, it is important to identify the costs of volatility within the process. The third research question will be:
“Which costs in the supply chain can be related to volatility?”
This research will be carried out within a case company, Case company. To provide them with a solution feasible for their case as described in section 1.3, it is necessary to identify which of the origins of volatility are applicable on their case. The fourth research question is:
“Which of the origins of volatility are applicable on the FMCG business?”
To design a new (repack) process which will make Case company less dependent on the volatility of Customer A’s demand, the current process need to be described in detail. The influence of volatility on this process needs to be highlighted, in order to provide a feasible solution. Therefore, the fifth research question will be:
“How is the current repack process for Customer A influenced by volatility?”
As could be derived from the problem statement, it is important to redesign the process so that it becomes more efficient and less costly. In particular it is important that the new process should make Beierdorf NV less influenced by volatility. In order to know how this redesign should be done, it is important to analyse existing literature on supply chain process (re)design. Therefore, the last research question is:
“What are successful (re)designs for upstream supply chain processes within FMCG, to be as little as possible influenced by volatility?”
PS. How should FMCG organisations deal with volatility and its related costs within their supply chain?
RQ.1 What are the origins of volatility?
RQ.2 What are the consequences of volatility for the business? RQ.3 Which costs in the supply chain can be related to volatility?
RQ.4 Which of the origins of volatility are applicable on the FMCG business? RQ.5 How is the current repack process for Customer A influenced by volatility? RQ.6 What are successful (re)designs for upstream supply chain processes within
FMCG, to be as little as possible influenced by volatility?
Table 1: Structured overview of problem statement and research questions
1.5 Thesis structure: a cost estimation model as a basis to be less dependent on volatility
So far, an introduction to volatility has been provided. Furthermore, the case has been outlined and the problem statement and research questions have been presented. In the remainder of this thesis, answers to the research questions will be provided by an in-depth analysis of volatility and its related costs.
In the next section the chosen research methodology, design science research, will be outlined and discussed. The section thereafter will be a literature research about the origins of volatility, their consequences and related costs. This section will result in a cost estimation model for volatility. The fourth section will elaborate on supply chain designs that enable an organisation to handle volatility as efficient as possible. The thesis will end with conclusions and managerial implications. Furthermore, the relevance and limitations of this research will be presented.
2 Research methodology
2.1 Goal of this research: to provide a better understanding of the impact of volatility on costs and to provide Case company with recommendations to become less
dependent on the volatility of their customers’ demand
hands-on recommendations to become less dependent on the volatility of their customers’ demand.
Research can be carried out within three categories of scientific disciplines. The first one is the formal sciences, whose mission is to build systems of propositions that test their internal logical consistency. The second one is the explanatory science, which describes, explains and possibly predicts observable phenomena within a certain field. The third category is design science, whose mission is to develop knowledge for instrumental use. This means using the research results to act in a specific and direct way, for designing solutions in a specific field of research. Design science research supports the design of interventions, to solve improvement problems9.
2.2 Design science research: interaction between the environment, the knowledge base and a new design
This research will adopt a design research methodology for various reasons. First of all, design science is successfully used beforehand to research engineering issues. Improvement problems, designing a new process or structure according to specifications as performance and cost, are typical engineering problems that can be solved with design research10. The redesign of the repack process for Case company is an example of an
improvement problem. The key question in design research is whether a particular design is suitable in a given setting, whether it will work or not11. Second, the design science
research approach states that general knowledge must be translated to a specific case or issue12. General knowledge will be obtained by examining the origins, consequences and
costs of volatility. The specific case where the knowledge will be applied to is designing a more (cost) efficient repack process that ensures the case company is as little as possible influenced by demand volatility of its customers. Last but not least, the design research methodology tries to bridge the relevance gap between theory and practice, the weakness organization and management theory is often criticised for13. This research will contribute
to bridge the relevance gap by designing a solution for an improvement problem brought up by the business, based on findings in academic literature.
9 See van Aken (2004), p.223/224 10 See van Aken (2005), p.24 11 See Romme (2003), p.564
Design science is not concerned with the action itself, but with the knowledge that will be used in designing solutions. This will be followed by design-based actions to solve a specific case14. By adopting a design research methodology, which is often done in case
studies, the focus will lay on establishing the right specifications. Understanding the needs of the client is a key concern15.
The outcome of design research is a set of design propositions, providing recommendations for the best possible solution16. These propositions are often
prescriptions with a heuristic nature, “if you want to achieve Y in situation Z, then something like action X will help”17. These propositions will be developed using three cycles, the relevance cycle, the rigor cycle and the design cycle18. The use of these three
cycles leads to the research model below.
Figure 2: Research model, based on Hevner et al., 2004; Hevner, 2007
2.3 The relevance cycle: identifying the relevance of the problem
During the relevance cycle, the goal is to identify the problem in an actual application environment19. Case company perceives the current repack process as too costly and
14 See van Aken (2004), p.226 15 See van Aken (2007), p.69/70
16 See Romme (2003), p.569; See van Aken (2004), p.228 17 See van Aken (2004), p.227
inflexible. Because of this inflexibility, Case company cannot always handle the volatility in demand of their customers, resulting in either excess stock or out of stock situations. This means that they have either high storage costs, or they are not able to deliver the demanded products to the customer which results in lost sales. The relevance cycle addresses the opportunity or problem to be solved and defines the acceptance criteria for the evaluation and acceptance of the research results (the solution)20. To discover what the
problem exactly is, an investigation of the current repack process will be made. Demanded and sold volumes, lead times and costs of repacking, transport and warehousing will be detected. Furthermore, the current decoupling point and order scheme have to be analysed in order to identify if certain patterns exist. This will be done by analysing quantitative data available from SAP, the Nielsen database (customer order information), (financial) administration of transport and warehousing and contracts signed with third parties (warehouse, repack partner, transportation company). The outcome of the relevance cycle should be a clear problem definition, grounded with data. As a result, a detailed description of the current process must be given, including all process steps, lead times and costs. Last but not least, requirements for the ideal problem solution should be presented. Chapter 1 and section 5.1 will be the outcome of the relevance cycle.
2.4 The rigor cycle: a literature review to find applicable knowledge
Within the rigor cycle, the existing knowledge base regarding the exact problem found during the relevance cycle will be analysed. State-of-the-art knowledge about the application domain of the research and the existing artefacts and processes found in the domain of application need to be identified21. For this research a literature study will be
carried out to get the required understanding of the current knowledge base. The origins of volatility and their influence on business, especially on the supply chain, will be analysed. Furthermore, a state of the art overview of literature about the influence of volatility on costs is needed in order to establish a cost estimation model for volatility. A thorough understanding of supply chain process (re)design is needed in order to provide Case company with suitable recommendations for their process redesign. Insisting the idea that all design research should be grounded on descriptive theories is unrealistic. The goal of
the rigor cycle is to find core theories on which to base the activities of design research22.
Chapter 3 and 4 will be the outcome of the rigor cycle.
2.5 The design cycle: towards a cost calculation model and a new process design During the design cycle, the real work of design research is done. The requirements for this cycle are input from the relevance and the rigor cycle. The relevance cycle should make clear what the actual problem is. The rigor cycle will result in a thorough understanding of the origins, consequences and costs of volatility, resulting in a general cost estimation model for volatility. Within the design cycle, design alternatives are generated. Furthermore, these alternatives will be evaluated against requirements from the relevance cycle, until a satisfactory improvement design is achieved23. The outcome of this cycle in
the research will be design propositions that will result in recommendations to improve Case company’s repack process. Section 5.2 and chapter 6 will be the outcome of the design cycle.
2.6 Collection of data
At this time, a cost estimation model for volatility does not exist within academic literature. To create such a model, the influence of volatility on costs needs to be identified. In order to identify this influence, the costs of diverse Case company products will be calculated. Thereafter, normal sales and sales during times of promotions will be analysed for deodorants. By examining the differences in volumes and costs between stable and volatile sales, the so called volatility costs can be identified. These costs have to be expressed in a percentage, in order to create a general cost estimation model for volatility. The costs will be obtained via the financial department of Case company. For costs that can or will not be provided an estimation needs to be made. As can be concluded from the previous information, this research will be a quantitative research.
3 The origins of volatility and their implications for business – The rigor cycle 3.1 Relevance: business should learn to gain from disorder, by clearly identifying the influence of volatility on the business, especially on costs
Almost every company, especially within the FMCG industry, is impacted by volatility on a daily basis. Volatility can have an impact on the processes side and the control side of an organisation, and on the supply and demand a company faces24. Continuously changing
demand influences the production planning, stock levels, costs and profit margins25.
The volatility phenomenon is investigated since the late 1800’s. The first studies focused on the volatility of different chemicals. From 1980 onwards the influence of volatility on doing business is extensively researched, as the below figures show. Especially in Finance related studies volatility became a popular research topic26. Section 3.2 will elaborate more
on the development of volatility related research.
Figure 3: Publications on Scopus search query ‘volatility’ (October 19, 2014)
24 See Yang/Burns (2003), p.2082
Figure 4: Publications on Scopus search query ‘volatility AND business’ (October 19, 2014)
Although volatility is often researched in finance related studies, relatively little research is done about the impact of volatility on (production) costs, as figure 5 shows.
Figure 5: Publications on Scopus search query ‘volatility AND costs’ (October 19, 2014)
Demand volatility in particular has become a popular research topic from 2000 onwards, as figure 6 shows. Research about demand volatility is frequently done in the touristic and fashion industries and more recently in the (sustainable) energy sector27. In academic
papers, demand volatility is in the majority of studies taken for granted. In these publications, the adaptor role as described by Gupta and Maranas (2003) is adopted.
Therefore, much research about volatility in demand is focused on coping with volatility, and designing the supply chain as robust as possible given the volatile demand.
Figure 6: Publications on Scopus search query ‘demand volatility’ (October 19, 2014)
To cope with uncertainty in the supply chain, often caused by volatility and fragility, the robust supply chain design is extensively researched28. However, there are indications, for
example in medicine studies, that it is possible to go even beyond robustness. Recent literature focusses on a state even beyond robustness. Taleb (2012) wrote a book called ‘Antifragile’, in which he states that there are things that gain from disorder. This book addresses the relevance of fragility and volatility and states that academics and business should not protect themselves from volatility; they should learn to gain from volatility. Academics and business should go beyond robustness, they need to become antifragile. Antifragile is the state that goes beyond robustness or resilience. The robust can resist shocks and stays the same, where the antifragile gets even better29. The key to handle
volatility is to accept it, to embrace it and to understand the influence of turbulence on the business30.
By combining existing academic findings regarding volatility and data collected at Case company, this thesis will describe the influence of volatility on costs in the FMCG industry. The resulting cost model will provide opportunities to attain a more robust state and maybe even a state with some antifragile elements.
28 See Baghalian et al. (2013), p.200; Pishvaee et al. (2011), p.637/648 29 See Taleb (2012), p. 12-13
3.2 The history of volatility: findings in the financial sector have triggered volatility related research in the domain of supply chain management, resulting in the bullwhip effect as most often researched phenomenon
The first scientific contributions regarding volatility can be found in the late 1800’s, in the Journal of the American Chemical Society and The Analyst. These studies focused on the volatility of different chemicals31. Almost a century later, from the 1980’s onwards,
volatility became a research topic of interest in finance related studies. Exchange rate volatility, stock return volatility, price volatility and interest rate volatility became popular research topics. Many of these financial studies are risk related. They investigate the link between the level of market uncertainty and the associated (stock) price volatility. The higher the uncertainty is, the more volatile the prices will be32. Furthermore, volatility
became very relevant for asset pricing models and dynamic hedging strategies33.
In the second half of the 1990’s volatility got the attention of management science. Theories of market behaviour were linked to volatility and the influence of volatility on future markets got more and more attention. From 2000 onwards the influence of volatility on the supply chain is investigated extensively. In this supply chain related academic research, different types of volatility are distinguished. An often researched type of volatility is production volatility, uncertainty in the supply chain, also called output volatility. A reduction in this uncertainty will help to improve the performance in the supply chain and to increase value34. Commodity price volatility, especially related to oil
and energy prices, is extensively researched in academic literature. Price volatility for commodities that serve as an input for production will have a negative impact on the macro economy. Price changes that have an influence on the optimal allocation of labour and capital will be costly, even as the delaying of investments when there is uncertainty about future prices and value of inputs and outputs35. The demand volatility related research
within the domain of supply chain management focuses mainly on the bullwhip effect. This bullwhip effect is the phenomenon where the variability in demand increases more and more in the upstream part of the supply chain36. The order signals of end customers are
amplified, resulting in upstream replenishment demand exceeding the original order
31 See Hehner (1887); Waldbott (1894)
32 See Kurz/Motolese (2001), p.499; Lazopoulos (2013), p.403 33 See Bollerslev et al. (1992), p.46
34 See Ewing/Thompson (2008), p.553 35 See Regnier (2007), p.408
quantity37. For this research, it is important to realise that the bullwhip effect is a result of a
lack of information about actual customer demand in the upstream supply chain. The variability in orders placed by a retailer at a manufacturer will be higher than the variability in demand from end consumers which the retailer experiences. The variability in orders which the manufacturer places at its suppliers will be even higher than the variability in the orders which the retailer places at the manufacturer38. Lee,
Padmanabhang and Whang (1997) identified four causes for the bullwhip effect which are considered as the main causes for the bullwhip effect within research:
- Demand signal processing is the first cause identified. All players in the supply chain base their forecasting on orders they receive from the succeeding player in the chain. Increasing orders will lead to higher forecasts, which will lead to increased order quantities at the proceeding link in the supply chain. It works the other way around when demand decreases39.
- The second cause of the bullwhip effect is the rationing game. In periods of shortage, a manufacturer will ration their products to the retailers in proportion of their orders. When this is known, retailers will order more than they actually need, to ensure they can cover the demand of their customers40.
- Order batching is identified as the third cause of the bullwhip effect. A retailer faces ongoing demand from its customers. However, it is unlikely that the retailer will also place continuous orders at a manufacturer, often due to fixed order costs, agreed lead times or distribution efficiency. This results in higher variability in the orders the retailer places than in the demand the retailer experiences41.
- The fourth cause of the bullwhip effect is a fluctuation in price. Promotions or trade deals lead to price fluctuations, which will increase the variability in demand. When the price of a product is low, for example during a promotion, customers will buy more than they actually need. During times of high prices a customer will buy less and use the available stock42.
37 See Mc Cullen/Towill (2002), p.165 38 See Fransoo/Wouters (2000), p.79
There are studies that have shown that the intensity of the bullwhip effect varies per industry, or even per product family within the same industry or company43. In the
personal care industry, where the case company for this research belongs to, the bullwhip effect is often very significant. Recent research investigated that the variability in the upstream supply chain is up to four times higher than the variability in the downstream supply chain44. Within the personal care sector the bullwhip effect is larger for products
with a relatively stable retailer demand, due to sales targets which are very important in this industry. Due to these targets, manufacturers have an incentive to sell at the end of the month, while at the same time retailers benefit from forward buying products with a stable demand45. Even for different products in the same product family, for example shampoos,
the intensity of the bullwhip effect can differ46.
3.3 The origins of the highly volatile environment require a high amount of flexibility within the supply chain
3.3.1. Short product life cycles contribute to a volatile environment
Short product life cycles are addressed as one of the origins of volatility, caused by advanced current technology, increased competition and the development of the internet47.
Characteristics of these products with shorter and shorter life cycles are rapid product substitution, rapid price decrease and an uncertain demand from the market48. Because of
these shorter life cycles forecasting became more and more important, since non-availability of a product often means that an opportunity of sales is lost forever49. These
shorter and shorter product life cycles result in volatility because it is never clear when the life cycle will end, how short it will actually be. This volatility caused by short product life cycles can be found especially in the retail and fashion industries. Companies acting in the FMCG industry have to cope with this type of volatility while optimizing their supply chain.
43 See Cachon et al. (2007), p.476; Zotteri (2013), p.492 44 See Zotteri (2013), p.493
45 See Zotteri (2013), p.496 46 See Zotteri (2013), p.494
47 See Tachizawa/Thomsen (2007), p.1115; Balakrishnan/Cheng (2007), p.305; Higuchi/Troutt (2004),
p.1097
3.3.2. Delivery time uncertainty leads to volatility in supply
Material requirements planning (MRP) provides a framework to manage production. Demands for the end product are forecasted, demand for the components or raw materials of the end product can be calculated by using the bill of material or recipe and planned lead time. The lead time equals the elapsed time from the release of an order until the delivery of the ordered item. Lead time is also called delivery time in literature. The quantity that is ordered is called lot size or batch size50. Lead time uncertainty has various causes,
including scheduling issues at the supplier, uncertain material supply, capacity constraints, unstable production processes and quality issues51. The risk related to this lead time uncertainty is that the supplier is not able to deliver at the requested date, which will result in lost sales for the buyer. The buyer can cope with the lead time uncertainty by changing the safety stock, which will lead to increased inventory costs and decreasing working capital.
3.3.3. Frequent and unpredictable changes in demand are called demand volatility 3.3.3.1. Client behavior causes significant sales fluctuations
Demand volatility is mentioned as the origin of volatility with the biggest negative impact for the supply chain on both costs and customer service level52. The first source of demand
volatility discovered in literature is client behaviour. The customers of manufacturers in the FMCG sector are retailers, not the end consumers of the products. Fluctuations in demand are most of the time not caused by changes in the demand of the end consumer, but generated within the supply chain as also discussed in section 3.253. Volatility in
demand caused by client behavior is called volume uncertainty, because the actual volume that will be demanded is not clear54. Volatility in demand is largely caused by cancelled or
rushed orders. This can lead to either excess stock or out of stock situations. Pricing policies from retailers cause significant sales fluctuations and often lead to rushed orders. Fluctuations in pricing behaviour lead to volatility in the demand for the manufacturers’ goods. Periodic price discounting for example encourages the end consumer to purchase more than needed in times of discount, they consume their excess over time and purchase
50 See Dolgui/Ould-Louly (2002), p.145 51 See Weng/Mc.Clurg (2003), p.13 52 See Acar et al. (2009), p.3265 53 See Zotteri (2013), p.489
again in another round of discount prices55. This volatile demand of retailers can make the
bullwhip effect even stronger, when a company purchases more variably than it sells to customers, and can lead to a mismatch in supply and demand56. A possible solution to
reduce the influence of client behaviour can be to make data on (end) consumer behaviour directly available for organisations further upstream in the supply chain57.
3.3.3.2. Seasonality causes high peaks in customer demand
Seasonal fluctuations are the second source of demand volatility58. Depending on the
season, the demand for products can fluctuate. The demand on special ski wear will be highest during the ski season. Sun care products will most likely show a peak in demand during the summer holidays. Seasonality has an extensive influence on supply chain management within an organisation. When supply reliability is low, often caused by poor forecasting management and long lead times, and production capacity is limited during the peak seasons, retailers place early and large orders to avoid out of stock situations at their shops. These early and large orders often create unnecessary extra seasonality, which moves the peak demand forward59. Seasonality is not always predictable, during a good
summer a lot more sun care products will be sold than during a rainy summer. The influence of seasonality can be reduced by designing a coordinated responsive supply chain. Coordinated responsiveness requires knowledge and capabilities for quick and accurate response, as well as knowledge about providing incentives to change current ordering and risk taking behaviour within the supply chain. For a supply chain that is both volatile and seasonal the strategy should be to coordinate both pre-season orders, and replenishment during the season adequately60. Coordination of order behaviour, relocating
large orders from large clients and shorter lead times can make a supply chain more coordinated responsive61.
3.3.3.3. Changes in consumer preferences lead to volatility in demand
Although the end consumer is not the direct client of an FMCG company, the behaviour of end consumers is the third source of demand volatility identified in literature. In dynamic
environments, as FMCG is, customers’ shopping behaviour, buying criteria and segments change often62. These changes in preferences can lead to fluctuations in demand and
therefore cause demand uncertainty63. Volatility in demand caused by changing customer
preferences is called mix uncertainty, because it is not clear which specification of the product will be demanded64. Related to this research this means that it is more or less clear
what the demand for deodorant will be, however the demand for the various types of deodorant can differ a lot. Product preferences can be influenced by several factors. Changes in the financial situation can force consumers to buy other products or brands than they normally do65. Branding, creating a unique name and image for a product in the consumers’ mind, is an opportunity the manufacturer has to influence customers’ product preferences. The awareness of brand names and information on products highly influences consumers’ buying behaviour66. Numerous other factors that influence consumer
preferences have been found in psychological and marketing related studies; among others loyalty programs, previous experience with a product or brand, promotions and (electronic) worth-of-mouth influence consumer preferences67.
3.3.4. Competitor behavior
The fourth source of volatility found in literature is the continuously changing behavior of competitors. Intense competition and short product life cycles resulting in an ever increasing change in products make the environment more and more volatile68. In order to
attract as much customers as possible, manufacturers have to continuously benchmark their competitors, in order to find a demand vacuum to gain competitive advantage. To supply the customer with higher valued products than those of the competitors, all departments within a demand driven organisation should be better and more efficient than those of competitors69. Notable differences between market leaders and market followers have been
found. A market leader rarely practices a price fighting strategy to stay competitive, whereas this is the most common used strategy among market followers. Market leaders tend to follow a more complex and hybrid competitive strategy. Complex means that they
62 See Yang/Burns (2003), p.2083 63 See Huang et al. (2008), p.3237
64 See Tachizawa/Thomsen (2007), p.1118 65 See Chan et al. (2005), p.459
66 See Philiastides/Ratcliff (2013), p.1213
67 See Lewis (2004), p.281/p.292; Wang et al. (2012), p.204/205; Kim/Chung (2011), p.42 68 See Huang et al. (2008), p.3223
focus on a different market variable like price or product differentiation than their competitors. In a hybrid competitive strategy more than one marketing variable is involved70.
3.4 Consequences of volatility for the supply chain: influence on inventory levels, production plans and a company’s product offerings lead to increasing costs and an ineffective coordination of the supply chain
Volatility affects forecast accuracy, inventory levels, production plans and output, a company’s product offerings (service level) and even product prices71. This results in an ineffective coordination of the supply chain and high supply chain costs. Downstream supply chain members spread their volatility upstream, resulting in high capacity and inventory costs72. Volatility directly affects the marginal value of storage. When demand
becomes more volatile, there will be a greater demand for inventory to have a buffer available that enables a manufacturer to deliver the requested products at all times. If demand would be stable a smaller safety stock would be sufficient. Therefore, an increase in volatility can lead to inventory build-ups73. The increasing inventory will result in higher
costs. Physical costs, the so called storage or inventory costs, are higher when there are more products on stock. Next to that, the financial costs like insurance, taxes and interest will also be higher when inventory levels rise74. Nowadays many supply chains are
forecast driven, this means that manufacturers periodically revise their supply chain plans based on a forecast of future demand over a specified planning horizon75. Volatility in
demand has an influence on forecasting. When demand is highly volatile it is hard to forecast sales and market trends, resulting in a poor forecast which leads to an inefficient operations schedule76. The inefficient operations planning can lead to an ineffective
coordination of the supply chain. A continuously changing operations planning has an influence on the raw material planning and replenishment decision77. Usually, the
manufacturer signs contracts with suppliers for the purchase of raw materials in a certain period. If the manufacturer faces a volatile environment he does not have clarity on the
70 See Shankar (2006), p.277, 290 71 See Germain et al. (2008), p.560 72 See Balakrishnan et al. (2004), p.163 73 See Pindyck (2004), p.1030
74 See Hendricks/Singhal (2009), p.511 75 See Schoenmeyr/Graves (2009), p.657
amount and time of raw materials needed and might therefore contract a sub-optimal quantity of raw materials at a sub-optimal time. A too high contracted quantity might force the supplier to buy material that is not needed in production, a too low contracted volume might lead to a shortage in supply which forces a manufacturer to buy on the spot market against an often higher price. The poor forecast and related inefficient operations schedule can result in either excess stock (too much stock) or out of stock situations, both indicators of a demand-supply mismatch78. Excess stock results in high inventory costs, squeezed
profit margins due to selling at bargain prices, and even scrapping or write-off costs. Out of stock situations can be costly because they influence the service level if a manufacturer is not able to deliver the requested products. Volatility and the related poor forecasts make it necessary to consider the contribution margin to support decisions related to investments in lead time reduction and/or excess stock buffers when (re)designing the supply chain79.
3.5 Costs of volatility: a general cost model for the calculation of volatility costs Information about the history, the origins and the consequences of volatility can be found in literature as described in the previous sections. Academic literature provides a lot of models that are related to volatility. Like the volatility related literature, these models are mainly finance related. They address stochastic volatility, often related to return on assets, pricing derivatives, calculating measures of risk, and hedging80. From 2000 onwards
volatility models in supply chain related literature where developed. These models focus on the positioning of the order penetration point, the predictability of volatility and forecast optimisation81. Chen and Samroengraja (2004) address the influence of order volatility on
costs by showing that a reduction in the volatility of orders received by a manufacturer will not necessarily lead to a cost reduction82. However, a model that shows the influence of
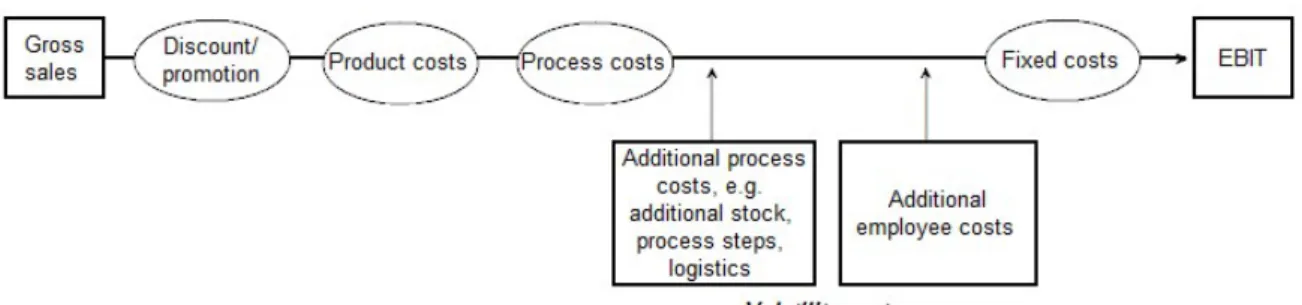
volatility on (supply chain) costs cannot be found yet. In order to assess the influence of volatility on costs and to establish the cost estimation model for volatility, sell-out data, promotion pressure, stock coverage, supply chain costs and VAS costs of the case company are analysed. Figure 7 illustrates the volatility cost model and shows the influence of the various cost types related to volatility. The remainder of this section will provide more details on the analysis.
78 See Hendricks/Singhal (2009), p.509 79 See Wong et al. (2006), p.712 80 See Hansen/Lunde (2005), p.873
Figure 7: Volatility cost model
The sale of Brand A Deodorant is stable over the year, as figure 8 shows. The peaks are caused by promotions at the retailer. A small lift in base sales is visible during the summer weeks due to the warm and sweaty weather, all other peaks are fully caused by promotions at the retailer. The promotion pressure at Retailer A, the percentage of articles sold during promotions, was 61% in 2012.
Figure 8: Sell-out data 2012, Brand A Deodorant at Retailer A
The sell-out data for Brand A Deodorant at Retailer B displayed in figure 9 show a similar pattern. However the base line is less flat, most likely caused by the high amount of promotions at this retailer. The promotion pressure at Retailer B was 73% in 2012.
Figure 9: Sell out data 2012, Brand A Deodorant at Retailer B
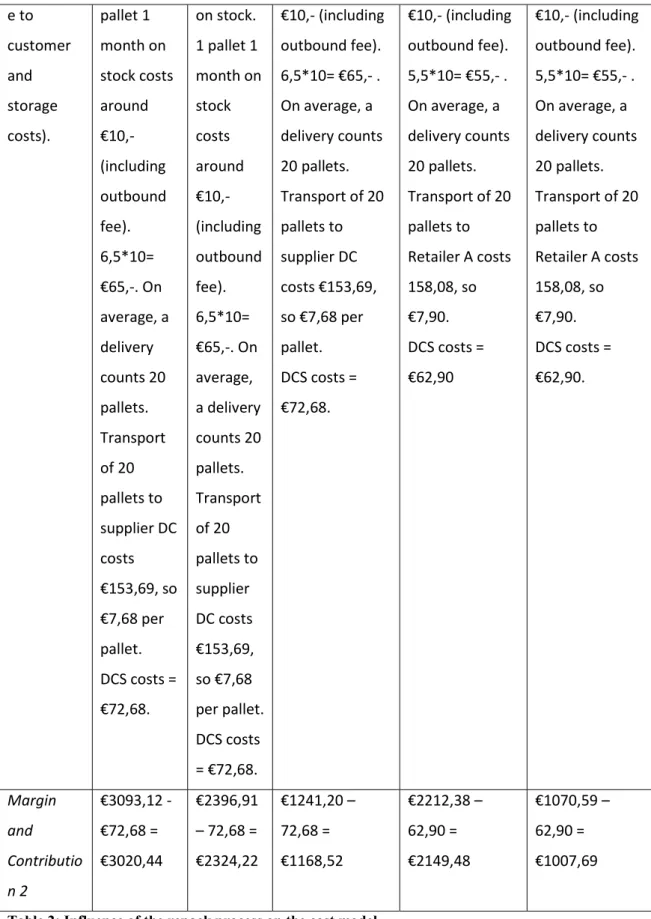
In 2013 four million repacked VAS articles were sold to Customer A, resulting in subcontractor repack costs of €339.736,98. To get a clear view on the influence of volatility on costs some calculations with data obtained from the case company have been done. Sales of one pallet of a specific type of deodorant to two customers, one buying standard products and one buying products made with the VAS process, are analysed. Table 2shows the influence of the repack process on the cost model of the case company. The standard process is compared to the VAS process for Customer A, for the standard situation and a situation where products are sold during a promotion. Next to that a minimal process is added. This process shows an analysis of the absolute minimum of process steps and related costs Case company has to deal with. This minimum process is applicable for retailers in the so-called budget channel.
Minimal process
Standard product
Product in promo (2+1), no VAS
AH, no promo, VAS process
AH, promo (2+1) and VAS process
Gross sales List price: €2,37
List price: €2,37
List price: €2,37 List price: €2,37 List price: €2,37
Price promotion
N/A N/A 33% N/A 33%
Product sales €2,37*1728 = €4095,36 €2,37*17 28 = €4095,36 (€2,37*1728)*0, 66= €2702,94 €2,37*1728 = €4095,36 (€2,37*1728)*0 ,66= €2702,94
Conditions N/A The discount for the supplier is 17% of net sales
The discount for the supplier is 17% of net sales.
The discount for Retailer A is 18% of net sales.
The discount for Retailer A is 18% of net sales.
Net sales €2,37*1728
€1002,24 VAS cost (Repack is €7,07 per 100 pieces. Transport is €353,25 for a full truck (33 pallets). No VAS costs involved. No VAS costs involved.
No VAS costs involved. 17,28*7,07 = 122,17. Transport is €353,25/33= €10,70. 10.7*2= €21,41 per pallet. Normally, only full trucks are sent to and from
subcontractor. However in case of high
volatility, trucks might not be full (and therefore more
expensive). VAS costs = 122,17 +21,41 = €143,58. 17,28*7,07 = 122,17. Transport is €353,25/33= €10,70. 10.7*2= €21,41 per pallet. Normally, only full trucks are sent to and from
subcontractor. However in case of high volatility, trucks might not be full (and therefore more expensive). VAS costs = 122,17 +21,41 = €143,58. Margin and Contributio n 1 €4095,36 - €1002,24,-= €3093,12 €3399,15 - €1002,24, -= €2396,91 €2243,44 – 1002,24 = €1241,20 €3358,20 – 1002,24 – 143,58 = €2212,38 €2216,41 – 1002,24 – 143,58 = €1070,59 DCS (includes transport from Case company Warehous This product is (on average) 6,5 months on stock. 1
This product is (on average) 6,5 months
This product is (on average) 6,5 months on stock. 1 pallet 1 month on stock costs around
This product is (on average) 5,5 months on stock. 1 pallet 1 month on stock costs around
e to customer and storage costs). pallet 1 month on stock costs around €10,- (including outbound fee). 6,5*10= €65,-. On average, a delivery counts 20 pallets. Transport of 20 pallets to supplier DC costs €153,69, so €7,68 per pallet. DCS costs = €72,68.
on stock. 1 pallet 1 month on stock costs around €10,- (including outbound fee). 6,5*10= €65,-. On average, a delivery counts 20 pallets. Transport of 20 pallets to supplier DC costs €153,69, so €7,68 per pallet. DCS costs = €72,68. €10,- (including outbound fee). 6,5*10= €65,- . On average, a delivery counts 20 pallets. Transport of 20 pallets to supplier DC costs €153,69, so €7,68 per pallet. DCS costs = €72,68.
€10,- (including outbound fee). 5,5*10= €55,- . On average, a delivery counts 20 pallets. Transport of 20 pallets to Retailer A costs 158,08, so €7,90. DCS costs = €62,90
€10,- (including outbound fee). 5,5*10= €55,- . On average, a delivery counts 20 pallets. Transport of 20 pallets to Retailer A costs 158,08, so €7,90. DCS costs = €62,90. Margin and Contributio n 2 €3093,12 - €72,68 = €3020,44 €2396,91 – 72,68 = €2324,22 €1241,20 – 72,68 = €1168,52 €2212,38 – 62,90 = €2149,48 €1070,59 – 62,90 = €1007,69
Table 2: Influence of the repack process on the cost model
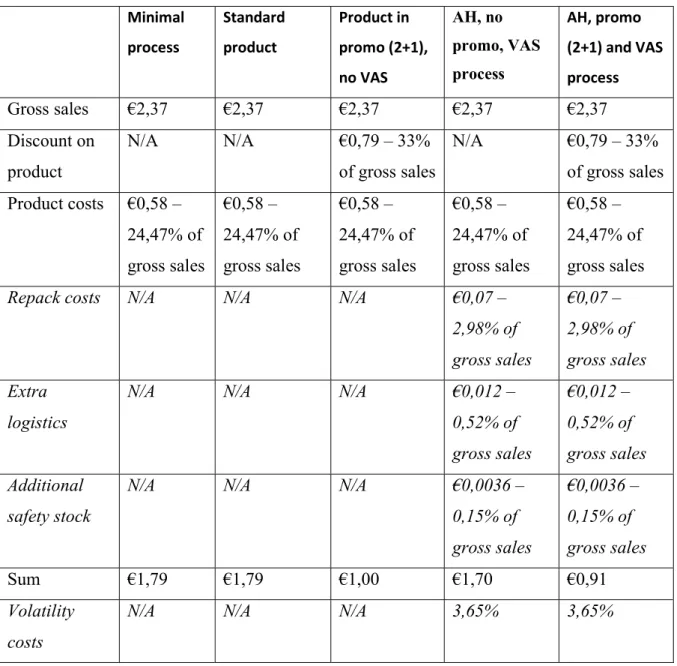
DCS costs can be assigned to that process, because all storage that is hold for repacked products would not have been there when the products where sold as a standard product. On average one time the lead time of the repack process will be held as safety stock. As will be explained in detail in section 5.2 the average lead time of the repack process is nineteen days. This means there will always be around three weeks of stock for every pallet that would have not been there when the product was sold as standard product. Monthly storage costs are €10,- per pallet. A month has on average 30,5 days. This results in €6,23 of additional safety stock storage costs for every pallet of repacked products. This results in the following volatility costs table:
Minimal process Standard product Product in promo (2+1), no VAS AH, no promo, VAS process AH, promo (2+1) and VAS process
Gross sales €2,37 €2,37 €2,37 €2,37 €2,37
Discount on product
N/A N/A €0,79 – 33%
of gross sales
N/A €0,79 – 33%
of gross sales Product costs €0,58 –
24,47% of gross sales €0,58 – 24,47% of gross sales €0,58 – 24,47% of gross sales €0,58 – 24,47% of gross sales €0,58 – 24,47% of gross sales
Repack costs N/A N/A N/A €0,07 –
2,98% of gross sales €0,07 – 2,98% of gross sales Extra logistics
N/A N/A N/A €0,012 –
0,52% of gross sales €0,012 – 0,52% of gross sales Additional safety stock
N/A N/A N/A €0,0036 –
0,15% of gross sales
€0,0036 – 0,15% of gross sales
Sum €1,79 €1,79 €1,00 €1,70 €0,91
Volatility costs
N/A N/A N/A 3,65% 3,65%
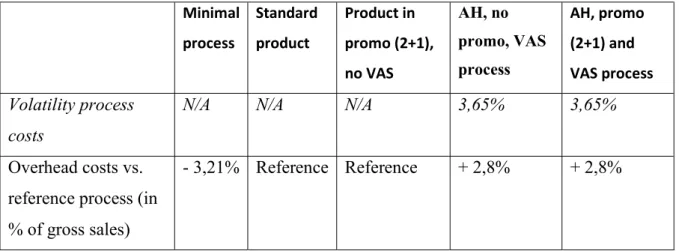
After Margin and Contribution 2 in table 2 the fixed costs need to be allocated to be able to calculate the income before interest and taxes (EBIT). Fixed costs consist mainly of office rent and employee wages. Office rent is considered as a real fixed cost, because these costs are not influenced by the production process being standard or a VAS process. For employee wages the calculation provided above becomes complicated, since information about the total overhead costs and employee wages is not provided by the case company. Therefore an estimation has to be made. It is known that overhead costs are around 10 percent of gross sales. It is likely that the overhead costs for the minimal process are the lowest, since the lowest amount of employees will be involved. Furthermore it is expeted that the adjusted VAS process involves more overhead costs than standard products, since more people spend their time on the VAS products.
5,56 percent of customer service FTE is managing seventeen percent of sales, which is 11,44 percent lower than expected. Within the supply chain department 1 FTE of two supply planners is fully dedicated to manage the availability of repacked products for Customer A. This means that 50 percent of supply planning time is spend to manage one third of sales. Given the expectation that one third of available planning FTE should manage one third of sales in a normal process the normal process will result in a saving of seventeen percent, which is the difference between half of the available time spend on Customer A or one third of available time spend on Customer A. Just 0,1 FTE of the two FTE available for supply planning is allocated to the customers in the budget channel. This means that five percent of available planning FTE is managing seventeen percent of sales, which is twelve percent lower than expected. Since Case company does not plan specific availability of products for this channel the supply planner mainly spends his time on allocating products that are not sold to regular customers.
done for the overhead costs as well. Since overhead costs are ten percent of gross sales this results in the comparison shown by figure 4.
Minimal process
Standard product
Product in promo (2+1), no VAS
AH, no promo, VAS process
AH, promo (2+1) and VAS process Volatility process
costs
N/A N/A N/A 3,65% 3,65%
Overhead costs vs. reference process (in % of gross sales)
- 3,21% Reference Reference + 2,8% + 2,8%
Table 4: Volatility costs including overhead costs
3.6 Conclusion: volatility is costly and requires a high amount of flexibility within the supply chain
Based on the literature review that describes the origins and the consequences of volatility the first two research questions can be answered. The first research question is: What are the origins of volatility? In the beginning of this chapter four origins of volatility that are relevant for the FMCG business are discussed. Volatility can have its origin in the upstream as well as the downstream part of the supply chain and can influence both the demand and supply a specific organisation faces83. Short product lifecycles contribute to a
volatile environment, because the rapid product substitution, rapid price decrease and an uncertain demand from the market result in an environment where it is never clear how short a lifecycle will actually be and when it will end84. Delivery or lead time uncertainty is
an upstream origin of volatility. This origin of volatility can be caused by scheduling issues at the supplier, uncertain material supply, capacity constraints, unstable production processes or quality issues85. The third origin of volatility discussed in this chapter is the
intense competition in the market86. In order to attract as many customers as possible,
manufacturers have to continuously benchmark their competitors, in order to find a demand vacuum to gain competitive advantage. The most extensively discussed origin of volatility is demand volatility. Continuously changing demand influences the production
planning, stock levels, costs and profit margins87. Client behaviour, seasonality, changing
customer preferences and competitor behaviour are the four sources of demand volatility identified. Academic research about volatility in the domain of supply chain management mainly focuses on the bullwhip effect. The bullwhip effect is the phenomenon where variability in demand increases more and more in the upstream part of the supply chain88.
To cope with volatility that cause turbulence in the supply chain organisations have to design their supply chains in a flexible way89. The next chapter will describe in detail how
this should be done.
The second research question is: What are the consequences of volatility for the business?
Volatility results in an ineffective coordination of the supply chain and high supply chain costs. Volatility has an influence on forecast accuracy, inventory levels, production plans and output, service level and even on prices90. The more volatile demand is, the higher the
influence on inventory will be. Not only inventory costs rise when stocks are build-up, financial costs like insurance, taxes and interest will also be higher when inventory levels rise91. A highly volatile demand makes it difficult to forecast sales and market trends,
which leads to an inefficient operations schedule and in the end an ineffective coordination of the supply chain92. The inefficient operations schedule can result in either excess stock
(too much stock) or out of stock situations, both indicators of a demand-supply mismatch93. Volatility and its consequences make it necessary to consider the contribution
margin when (re)designing an efficient and profitable supply chain94.
By building the volatility cost model the third research question, “Which costs in the supply chain can be related to volatility?”, can be answered. This chapter has shown that volatility does increase costs. Volatility has an influence on among others inventory costs, raw material costs and working capital. The examples provided in this chapter, in which a normal process and an adjusted process within Case company are compared, show that the adjusted process is subject to volatility because it involves more different handlings than the standard process. Next to that the adjusted process has a longer lead time due to the extra process steps, which results in higher inventory levels. These costs linked to the
87 See Kim/Springer (2008), p.173; Springer/Kim (2010), p.380; Kulp et al. (2004), p.435 88 See Lee et al. (1997), p.546; Chen et al. (2000), p.436; Fransoo/Wouters (2000), p.78 89 See Christopher/Holweg (2011); Mason-Jones et al. (2000);
90 See Germain et al. (2008), p.560 91 See Hendricks/Singhal (2009), p.511
92 See Germain et al. (2008), p.560; Huang et al. (2008), p.3324 93 See Hendricks/Singhal (2009), p.509