Aron H. Steenwoerd BSc.
Master’s thesis
3 Document type: Master thesis
Date: 8/22/2015
Version: 1.0
Author: Aron H. Steenwoerd BSc.
Student no.: s1015516
E-mail: [email protected]
Study program: Industrial Engineering and Management Specialization track: Financial Engineering and Management
University: University of Twente
Drienerlolaan 5
5722 NB Enschede, the Netherlands
Internship provider: Deloitte Consulting B.V. | Strategy & Operations | C.F.O. Services Gustav Mahlerlaan 2970
1081 LA Amsterdam, the Netherlands
Exam Committee
First supervisor: Ir. H. Kroon
Faculty of Behavioural, Management and Social Sciences University of Twente
Second supervisor: Dr. P. C. Schuur
Faculty of Behavioural, Management and Social Sciences University of Twente
External supervisor: Drs. O.M. Van Thuijl RA Senior manager
5 Integrated Reporting <IR> is a promising new standard for external corporate reporting that provides shareholders a better explanation of how a company creates value. An integrated report is “a concise communication about how an organization’s strategy, governance, performance and prospects, in the context of its external environment, lead to the creation of value in the short, medium and long term” (The IIRC, 2013). An organization benefits from <IR> by getting an improved holistic view of the organization and a better understanding of how the company creates value. Currently, <IR> is in the ‘breakthrough’ phase of adoption of the International <IR> Framework. This thesis contributes to the adoption of <IR>, by studying how business performance leads to value creation. Yearly research on the progress of Integrated Reporting in the Netherlands shows that Dutch companies have real difficulties with operationalizing <IR> and that especially reporting about non-financial performance in challenging (Deloitte, 2014). Therefore, the research question of the graduation project is:
How can companies show in an integrated report how their performance leads to value creation in terms of natural capital and social & relationship capital?
The research shows that reporting about business performance is not just putting a standardized list of performance indicators in the report. An integrated report should contain qualitative and
quantitative reporting about how their performance leads to value creation. The quantitative part mainly consists of performance indicators and the qualitative part should contain an explanation about the performance indicators, the measurement methods and their relevancy for the
organization. Performance indicators have to be presented for multiple consecutive years, against peer groups, and it should be linked to previously reported targets and future targets. This enables benchmarking, comparability and showing trends. Literature research has yielded specific guidelines about individual KPIs and about structuring them. Performance indicators have to be measurable and controllable by the company. Moreover, they have to be consistent, reliable, relevant and in line with the strategy of the company. This last aspect is important because the strategy determines how the company aims to create value.
The International <IR> framework does not provide any specific measurement methods or
performance indicators though. Nowadays, annual reports or sustainability reports often show a quite standardized list of performance indicators, and the question is if these are actually related to value creation in their business. A statistical analysis was performed during this project, on historical performance data of Dutch listed companies, that are related to social & relationship capital and natural capital. This analysis is based on the value creation figure from the International <IR> Framework, that shows that a company owns six types of capital: financial, manufactured,
intellectual, human, social & relationship and natural capital. The analysis showed that there are no KPIs that are in general significantly explanatory for value creation. This means that organizations should not all report the same standardized list of KPIs, but they have to select individually what KPIs are relevant for their value creation process and strategy. To accomplish that, an organization should align their internal performance management with what they want to report externally, and structure the KPIs by the six capitals.
6
Contents
FOREWORD ... 8
1 COMPANY PROFILE OF DELOITTE CONSULTING ... 9
2 INTRODUCTION TO THE STUDY ... 10
2.1 CURRENT SITUATION OF INTEGRATED REPORTING ... 10
2.2 RESEARCH GOAL... 15
2.3 PROBLEM STATEMENT ... 16
2.4 RESEARCH QUESTIONS ... 16
2.5 METHODOLOGY ... 17
2.6 RESEARCH PLANNING ... 19
3 VALUE CREATION ... 20
3.1 VALUE CREATION IN CONTEXT OF ACADEMIC LITERATURE ... 20
3.2 THE ROLE OF VALUE CREATION IN THE INTERNATIONAL <IR> FRAMEWORK ... 21
3.3 MEASURING VALUE CREATION VIA STAKEHOLDER VALUE ... 23
3.4 VALUE CREATION IN THE SHORT, MEDIUM AND LONG TERM ... 24
3.5 CONCLUSION ... 26
4 PERFORMANCE MEASUREMENT OF NATURAL AND SOCIAL & RELATIONSHIP CAPITAL ... 27
4.1 THE ROLE OF THE CAPITALS IN <IR> ... 27
4.2 SOCIAL & RELATIONSHIP CAPITAL... 28
4.3 NATURAL CAPITAL ... 29
4.4 PERFORMANCE REPORTING ABOUT NATURAL AND SOCIAL & RELATIONSHIP CAPITAL ... 31
4.5 PROPERTIES OF GOOD PERFORMANCE MEASURES ... 32
4.6 STRUCTURING OF PERFORMANCE MANAGEMENT ... 34
4.7 CONCLUSION ... 35
5 CONNECTION BETWEEN BUSINESS PERFORMANCE AND VALUE CREATION OF SOCIAL & RELATIONSHIP CAPITAL AND NATURAL CAPITAL ... 36
5.1 UNDERLYING MODEL OF VALUE CREATION ... 36
5.2 DATASET FOR STATISTICAL ANALYSIS ... 37
5.3 STATISTICAL METHOD FOR PANEL DATA ... 39
5.4 ANALYSIS PERFORMED IN STATA ... 41
5.5 CONCLUSION:APPLICATIONS FOR INTEGRATED REPORTING ... 44
6 CONCLUSION ... 46
7 DISCUSSION ... 48
7.1 LIMITATIONS ... 48
7.2 FUTURE RESEARCH... 48
BIBLIOGRAPHY ... 50
ABBREVIATIONS ... 52
LIST OF FIGURES ... 53
APPENDIX A: RESEARCH PLANNING ... 54
APPENDIX B: BALANCED SCORECARD ... 55
APPENDIX C: DELOITTE’S ENTERPRISE VALUE MAP (IMPRESSION) ... 56
APPENDIX D: ASSET4 ESG DATATYPES OF THOMSON REUTERS DATASTREAM ... 57
APPENDIX E: SAMPLE OF DUTCH LISTED COMPANIES FOR STATISTICAL ANALYSIS ... 58
APPENDIX F: .DO-FILE STATA ... 59
8
This thesis is written as completion to the master Industrial Engineering and Management, at the University of Twente. I followed the specialization track Financial Engineering and Management, which is focused on valuing financial products, corporate finance and financial risk management. The focus on value creation of an organization was an interesting part of Integrated Reporting for my field of knowledge. I have chosen to approach Integrated Reporting from the perspective of the company to contribute to operationalizing of the new reporting standard.
I am grateful for the graduation internship that Deloitte Consulting offered me within the service line of C.F.O. services. During a period of 5 months, I had the opportunity to work in a specialized
Integrated Reporting team that shared valuable knowledge and insights with me. They really helped me with this research project and with writing this thesis. Special thanks go to Olivier van Thuijl who offered me helpful guidance during the project and was always willing to think along with me when I was struggling. He and my other colleagues, made me feel very welcome within the services line and contributed to the nice time I had during the internship.
I would also like to thank my first and second supervisor from university, Henk Kroon and Peter Schuur respectively. The feedback sessions during this project were always interesting and helpful. Henk’s eternal willingness to discuss project related issues really contributed to making this graduation project successful.
9 This master’s thesis is written during an internship at the Strategy & Operations department of Deloitte Consulting Netherlands. The service line C.F.O. Services, which is part of Strategy & Operations, has a team that is specialized in Integrated Reporting and performance management. They accommodate this research because they want to keep expanding their knowledge about Integrated Reporting to offer the best services to their clients. This company profile gives insight in the service line and its position within the organization.
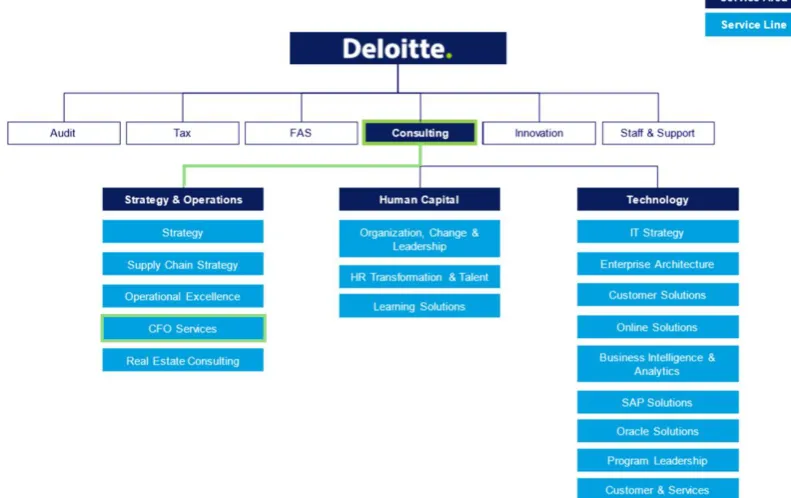
Deloitte is a collective brand name for a group of separate firms that offer professional services in the fields of accounting, consulting, financial advisory, risk management, tax advice and other related services (Deloitte, 2015). These specialized firms are part of the Deloitte Touche Tohmatsu Limited (DTTL) group, which was founded in 1845 as an accounting company in London. Today, Deloitte employs over 200.000 people, spread over 150 countries. Deloitte Consulting in the Netherlands, which employs over 800 consultants, supports this Master’s graduation study. Figure 1-1 shows a detailed structure of Deloitte consulting and highlights the service area and service line where the internship takes place. The consulting department of Deloitte contains three service areas: Strategy & Operations, Human Capital and Technology. CFO Services is the largest service line of Strategy and Operations and supports this graduation project.
[image:9.595.69.465.492.741.2]CFO services can be roughly divided by finance strategy and finance operations. Finance strategy is dedicated to strategic questions within both private and public sector, and helps improving the finance function of organizations. They benchmark the quality of the finance function in an organization and support them by making the financial department more effective to improve decision-making on managerial level. Financial operations focuses more on improving efficiency and effectiveness of financial processes.
10
The central subject of this thesis is Integrated Reporting (from now on referred to as <IR>), which is a new global reporting standard. An international committee, which is called the International
Integrated Reporting Council (IIRC), published a report in 2013, in which they proposed a new corporate reporting standard. The new type of reporting claims to improve the external
communication of a company about how they plan to create value for their stakeholders in the short, medium and long term. The release of the International Integrated Reporting Framework in 2013 had an impact on the awareness of businesses about the importance of their stakeholders and
environment. <IR> is based on the principle that creating value for stakeholders is the only way to accomplish a sustainable shareholder value for the organization itself.
The purpose of this thesis is to contribute to the operationalization of the new concept of Integrated Reporting from a C.F.O. perspective. Where most academic literature is written about the external reporting and assurance, there is a lack of knowledge about embedding the <IR> principles in the organization.
This section describes the research design of this study, which results in a central research goal. The guidelines of Verschuren & Doorewaard (2005) will structure the design of this study (figure 2-1). The first step is to fully understand the concept of Integrated Reporting and in what context it is
introduced. Therefore, Section 2.1 describes the main ideas behind <IR>, the committee behind <IR>, the benefits of the new reporting standard and finally the progress of implementation at companies in The Netherlands. This leads to a research goal in Section 2.2 and in Section 2.3 the scope of the study will be narrowed towards a central problem statement. The research questions of Section 2.4 show the structure of how this central problem statement will be approached. This will also be the structure of this thesis. For all sub research question there is described a methodology, in Section 2.5, on how these questions will be answered.
2.1 Current situation of Integrated Reporting
[image:10.595.82.430.502.626.2]11
2.1.1 The introduction of <IR>
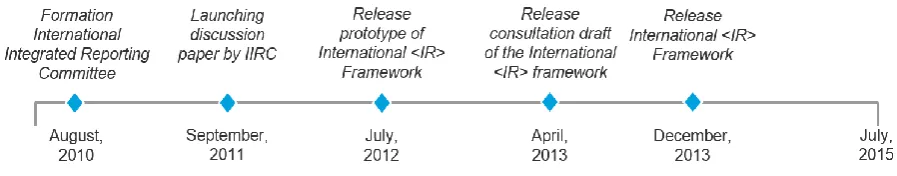
In December 2013 the International Integrated Reporting Council (IIRC) published a proposal for improvement of corporate
reporting, which is called Integrated Reporting. The main goal of <IR> is that organizations can better explain to providers of financial capital how they will create value over time (The IIRC, 2013). The IIRC is a global committee that brought together regulators, investors, companies, NGOs and other key representatives, to develop an internationally accepted <IR> framework (figure 2-2). The committee is convinced that corporate reporting should shift towards a value creation focus and therefore they designed the International <IR> framework during a four-year process (figure 2-3). The framework guides the preparation of
integrated reports and is based on the principles of integrated thinking, which is aiming to create awareness that organizations own financial and non-financial capital that both contribute to value creation. The IIRC defines an integrated report as “a concise communication about how an
organization’s strategy, governance, performance and prospects, in the context of its external environment, lead to the creation of value in the short, medium and long term” (The IIRC, 2013).
A report should inform an organization’s stakeholders about how their business model, strategy, governance, performance and prospects, lead to value creation in the short, medium and long term. The IIRC believes that companies can not only create a sustained shareholder value when it does not create value for employees, customers, suppliers, business partners, local communities, legislators, regulators, and policy-makers. Integrated Reporting is based on the principle that companies create value through a broad range of capitals (financial, manufactured, intellectual, human, social and relationship, and natural) and not only by financial capital. These capitals can be interpreted as a set of resources and relationships. The awareness of relationships between the capitals is important to understand an organization’s value creation process and should become important in future decision-making.
2.1.2 The International <IR> Framework
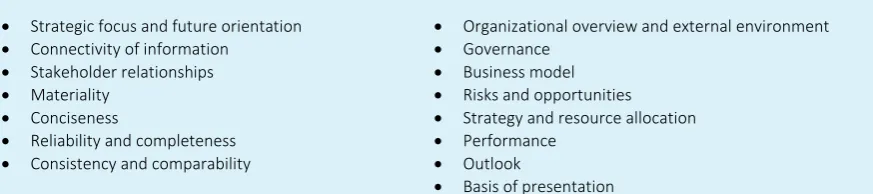
To achieve these improvements in corporate reporting, an International <IR> Framework was designed around the key process of value creation. To create a certain level of comparability a set of content elements and guiding principles are formulated (figure 2-4), that are required to follow when creating an integrated report (The IIRC, 2013). The Guiding Principles show how the information of
NGOs Regulators Investors The Accounting profession Companies Standard setters
[image:11.595.70.519.370.458.2]Figure 2-2: Backgrounds of the members of the IIRC
12
[image:12.595.78.515.153.250.2]the report should be presented. The content elements give a practical overview of the fundamental information that has to be reported. These elements together influence an organization’s ability to create value and are fundamentally linked to each other. The challenging part is to describe them, report relevant information, and show their connection with value creation.
[image:12.595.73.499.389.600.2]Figure 2-4: Guiding principles and Content elements of the International <IR> Framework
Figure 2-5 shows a graphical representation of the value creation process, designed by the IIRC. It includes all the above-mentioned content elements that are required to assess a company’s ability to create value. The input of the framework consists of the six capitals and the middle compartment shows how its business activities convert these input capitals into output capitals. Notice that the value creation process is a cycle, where created value becomes new input capital for the cycle. The strategy, risks and opportunities, performance and outlook determine the conversion of the input in the output
The framework offers a set of guidelines and content elements, but is still quite abstract and does not offer an explicit format for the reports. Although it tries to accomplish a certain degree of
comparability, it does not prescribe specific performance indicators, measurement instruments, strategy benchmarks or timeframes. The framework intends to keep being flexible and useful for a broad range of organization. It does not prescribe anything that is company specific and it should be applicable for every company in the private sector.
Guiding Principles
Strategic focus and future orientation
Connectivity of information
Stakeholder relationships
Materiality
Conciseness
Reliability and completeness
Consistency and comparability
Content elements
Organizational overview and external environment
Governance
Business model
Risks and opportunities
Strategy and resource allocation
Performance
Outlook
Basis of presentation
13
2.1.3 Benefits of Integrated Reporting
The implementation of <IR> should result in more cohesive, qualitative, and concise reporting. Conciseness is an urgent topic since the average number of pages in annual reports is exponentially increasing over the last decade (Investis Research, 2008). The quality and cohesiveness should be accomplished by reporting not only about financial capital, but also by showing value-added through non-monetized capitals and their interconnectivity. It breaks with the traditional silo thinking and
integrates different types of capitals within an organization and extends its timeframe in terms of short, medium and long term. The importance of non-monetized capital in the <IR> framework fits
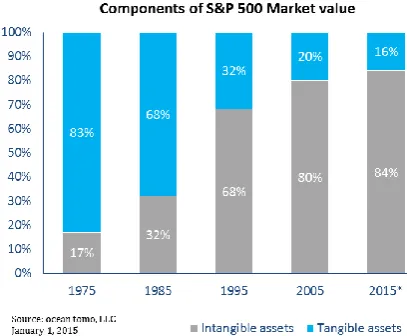
well with the trend that intangible assets increasingly determine the market value of a company (Ocean Tomo, 2015). Since the goal is to offer stakeholders more relevant information about the company, the role of intangible capital cannot be withhold anymore (Figure 2-6).
The importance of <IR> for external stakeholders can be directly deducted from the guideline principles in the framework, but the awareness of importance for the internal stakeholders is also growing (Deloitte, 2014). An integrated view on the current status of the organization is really helpful for decision making, data analytics and management control.
Because of the novelty of the <IR> concept there still is little empirical research published about the (positive) results of <IR>, at companies that aligned their reports to the new standards. The IIRC itself has performed a case study, in collaboration with communications consultancy Black Sun, on 66 listed companies that took a lead on changing their corporate reporting and participated in a three-year pilot program (The IIRC & Black Sun Plc, 2014). The most convincing results were about the
improvement of engagement with internal stakeholders, and were published in a report that is called “Realizing the benefits: The impact of Integrated Reporting” (2014). For example, 92% of the
participants experienced an increased understanding of value creation and 84% saw an improvement of data quality. In addition, the management information, decision-making and the connectivity between departments of the organizations was drastically improved.
Although a bit less convincing, the study also showed new proof that relations with external
[image:13.595.318.522.90.258.2]stakeholders improved. The survey showed that a better understanding of the strategy at providers of financial capital was created and in about half of the collaborating companies the relationships with institutional investors and analysts actually improved. The same aspects are also tested in a control group of organizations that still have not published an integrated report yet, which resulted in a significant lower score on internal understanding of value creation, quality of performance information and decision-making processes.
14
2.1.4 Progress with implementation of <IR> in The Netherlands
According to the planning of the IIRC, the global adoption of the International <IR> Framework is in the breakthrough phase. Because in this phase the majority of the companies still have not published an integrated report, there is a lack of empirical research publications about the effects of publishing an integrated report. The IIRC is convinced though, that <IR> becomes the global standard in
corporate reporting and therefore it becomes important for companies to understand the principles of integrated thinking and gather the required skills to create such a report. Over the last years, an increasing number of firms enclosed a stand-alone sustainability report to their traditional financial report, but the step towards one integrated report still has to be taken by many companies. In the Netherlands there is no regulation about <IR>, but in other countries there are slowly taken some initiatives. In 2010 South Africa was the first country that added some regulations for listed companies towards <IR> (King III, 2009). Although the International <IR> Framework was not published yet, the concept was introduced and companies were required to explain to what extent they already complied their report with the <IR> principles. South Africa was followed by France who made it mandatory for 2016 (Grenelle II article 225, 2012). Besides that, there are also a few
countries that did not regulate by law, but made some softer regulations at the stock exchanges. In countries like Denmark, Malaysia, Brazil and Singapore, an environmental, social or governance report is required (EY, 2012).
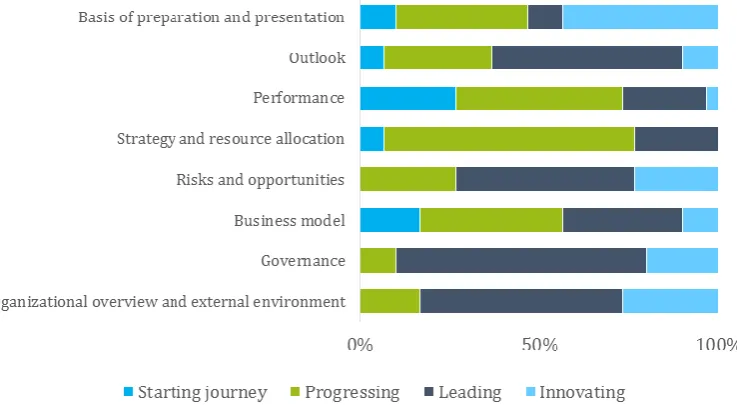
To observe the implementation progress of <IR> in The Netherlands, Deloitte performs a yearly study on the status of <IR> in the Netherlands. The purpose of this publication is to show in what stage the implementation of <IR> is in Dutch companies. Therefore, they defined the following four stages:
Starting journey, Progressing, Leading, or Innovating. These stages represent the maturity of reporting on a both Guiding principles (Figure 2-7) and Content Elements (Figure 2-8) of the International <IR> Framework.
There is an observable trend where companies prefer combined or integrated reporting over two separate financial and sustainability reports. Companies seem to have most difficulties with
[image:14.595.203.534.470.648.2]conciseness and comparability. Apparently, firms are not capable of reducing pages and cutting irrelevant information. Reports in general, also lacked strategic targets, and trends overtime, which
15
makes it impossible to evaluate performances against benchmarks and competitors. Reliability and completeness appeared to be the best-applied guiding principle at Dutch companies. As showed in Figure 2-6, the great majority of the companies scored a ‘leading’ or ‘innovating’ level on these principle aspects. On the other hand is conciseness the most difficult guideline to follow for companies.
The fact that companies in general scored better on the content elements also has something to do with the inability to meet the guiding principles. Adding some content element to the report obviously conflicts with the conciseness guideline. Companies simply add more content to meet the content requirements for <IR>. The most poorly reported content elements are Strategy and resource allocation and Performance. It appears to be difficult to show how these elements will affect the value of the capitals in the future.
2.2 Research goal
All in all, <IR> is a promising concept that will revolutionize annual reports, but because of the novelty of the framework companies have real difficulties with applying the <IR> principles. <IR> is becoming a global standard of reporting, so companies have to be prepared and gather the required knowledge and skills. Currently, companies start to use the <IR> framework without understanding integrated thinking.
[image:15.595.150.519.75.281.2]This study aims to contribute to the understanding of integrated thinking and operationalizing Integrated Reporting. This fits with the third category of future research opportunities that Cheng et al. (2014) proposed in their paper about the key issues with <IR>. To enter this challenge, the actual scope of this thesis has to be narrowed to a manageable scale for this graduation research. The Deloitte report about <IR> in the Netherlands that was mentioned in section 2.1.4 designated the guideline principles and content elements of the <IR> framework that have most room for
16
improvement. Reporting on performance and its influence on value creation is difficult for companies and therefore the relationship between those two aspects is an interesting subject.
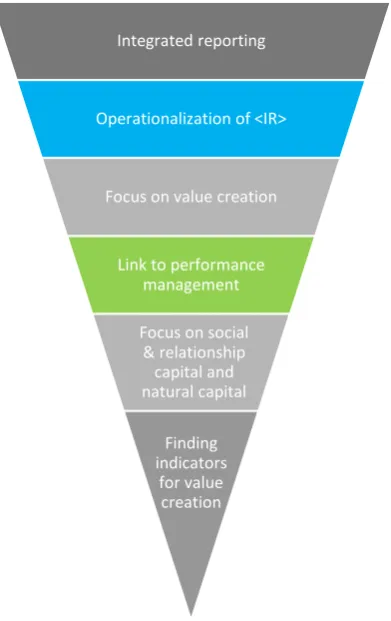
The main goal of the research is to improve
performance reporting and showing the relationship with value creation of a business. Ultimately, this leads to improvement of an integrated report. This study is about the essence of <IR>, which is the process of value creation via the six capitals. The research will be reduced to only natural capital and social & relationship capital (Figure 2-9). These capitals are difficult to measure, but are still often important for a company’s strategy. This study will give insights in the characteristics of social & relationship capital and natural capital and their relationships with stakeholders. An additional goal is to prove statistically if there are performance indicators that are relevant for value creation and therefore should be included in an integrated report.
2.3 Problem statement
To reach this research goal, a central problem statement has to be solved. The first aspect of the research goal is about understanding the role of the six capitals in the value creation process, according to the International <IR> framework. The focus of the research is on social & relationship capital and natural capital, so the goal is to find out how these capitals contribute to value creation and how these performances can be reported. Therefore, the problem statement of this thesis is: How can companies show in an integrated report how their performance leads to value creation in terms of natural capital and social & relationship capital?
2.4 Research questions
The purpose of the research design is to solve this problem in a structured way. Therefore, a set of research (sub) questions form the structure towards solving the main problem statement. The key aspects of the problem statement are value creation, performance and natural capital & social and relationship capital. The research questions will be structured in a way that these three aspects will be treated in the first two questions and finally be integrated with each other. The following research questions will guide this process:
1. What is value creation and what is the role of value creation according to the International <IR> Framework?
- What is value creation of an organization?
- What is the position of value creation in the <IR> framework? - What is the role of different time horizons of value creation?
Integrated reporting
Operationalization of <IR>
Focus on value creation
Link to performance management
[image:16.595.325.521.71.382.2]Focus on social & relationship capital and natural capital Finding indicators for value creation
17 According to the IIRC, <IR> should lead to better reporting about how a company will create value in the short, medium and long term. The purpose of the first question is to get an understanding of the value creation process of a company. Defining value creation contributes to creating a starting point for further research on this subject. Important aspects are the relationship with stakeholders and the role of the different time horizons (short, medium and long term).
2. What are social & relationship capital and natural capital and how can related performance be measured?
- What is social & relationship capital and how is it related to value creation? - What is natural capital and how is it related to value creation?
- In what way is the performance with respect to social & relationship capital and natural capital currently reported?
- What are the properties of good Key Performance Indicators?
The second question brings focus to just social & relationship capital and natural capital. Answering the research question should result in an extensive definition of the two capitals and their characteristics. In addition, the second section will treat how these capitals can be used to create value. It is also interesting to see in what way these capitals are already represented in annual reports. The IIRC has established guidelines to report on business performance, and these will be completed with academic literature about this topic.
3. What Key Performance Indicators that are related to natural capital and social & relationship capital are explanatory for value creation of a company?
The last research question is focused on the additional quantitative analysis, which purpose is to find performance indicators that are statistically relevant for value creation. By answering this research question, the concepts of the first two questions will be brought together. The goal is to find performance indicators that have explanatory properties with respect to value creation, based on historical performance data of listed companies.
2.5 Methodology
18
attempt of modelling the value creation process. This enables further quantitative research in the remaining section of the study.
Answering the second research question starts with describing natural capital and social & relationship capital and how they are related to different stakeholders. Therefore again, a broad spectrum of scientific literature is used to come to the final definitions. The section will show how the view of the IIRC matches with earlier academic literature and studies of other specialized institutes. Subsequently, the section will give insight in performance reporting with respect to social &
relationship capital and natural capital. This starts with the guidelines that the International <IR> framework provides about how performance should be reported. That results in an overview of what aspects are defined by the IIRC, and what aspects still have to be interpreted by the companies. A literature research will be used to fill the gaps of the <IR> framework. Properties of good performance indicators and structuring methods of performance management will be key issues in this section. The third question is an attempt to connect value creation and performance management with a quantitative method. The ultimate goal to find the KPIs that are relevant to measure as input and output for natural and social & relationship capital. Therefore, performance data of listed companies will be collected and the KPIs will be ranked on the frequency of occurrence in reports. The KPIs that are often reported can be used for statistical tests to find what KPIs show the most accurate
indication of value creation.
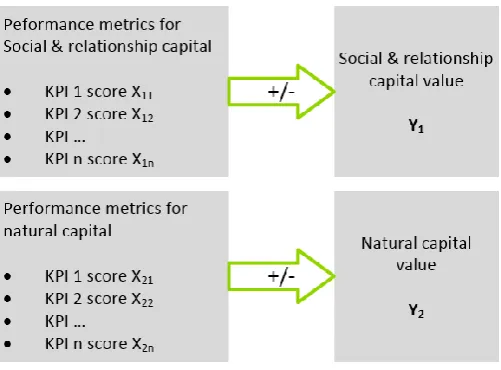
For this quantitative analysis Environmental, Social and Governance (ESG) data will be used. This requires a big database with historical performance numbers of different companies. A statistical regression analysis will be used for finding what performance scores have the most explaining ability for company value creation. This can contribute to improvement of performance reporting in an integrated report. Regression analysis is a method for finding single or multiple explanatory variables of the response variable (Y). The response variable is the dependent variable, which in this case should be “value creation”. Because value creation is not that easy to determine, a representative indicator needs to be chosen for natural and social value creation. The independent variables Xi will
[image:18.595.77.328.547.732.2]be formed by company performance scores on natural and social KPIs. Figure 2-10 shows an illustration of the theoretical model of the statistical analysis.
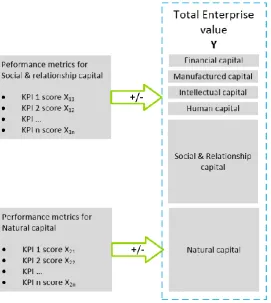
19 Along the research process, it appeared to be difficult to find a representative indicator for social & relationship capital and natural capital. Measuring social & relationship capital and natural capital is no exact math discipline and is definitely not reported in annual reports. Therefore, the total enterprise market value is chosen as an alternative dependent variable. Social & relationship capital and natural capital represent a certain fraction of the total market value of a company. Figure 2-11 shows how the conceptual model for the statistical analysis is changed compared to the initial model in figure 2-10. The challenges, restrictions and execution of this quantitative research are discussed further in Section 5.
Figure 2-11: Revised conceptual model for quantitative analysis, due to difficulties of valuating social & relationship capital and natural capital
2.6 Research planning
20
This section will answer the first research question: What is value creation and what is the role of value creation in the International <IR> Framework? The International <IR> Framework and a
literature study will contribute to defining value creation. Value creation is different for many types of stakeholders and can be explained in a qualitative and a quantitative way. The purpose of this section is to understand the meaning of value creation. Section 3.1 introduces the value creation concept by giving some literature background and the historical development of theories about the concept. Section 3.2 describes the specific role of value creation in Integrated Reporting as argued by the IIRC. The purpose of Section 3.3 is to create an understanding of the role of value creation in the
International <IR> Framework by showing a graphical representation of the value creation process. This process can also be modelled to a certain extent, which is an essential step towards quantitative research. The remainder of this thesis is all built on the assumptions made in that model. The
modelling process is showed stepwise, by first showing a static model and by adding a time dimension in Section 3.4. Finally, Section 3.5 sums up the most important findings with respect to value creation. It will also give a preview on how this can be used for performance reporting in the next sections of this thesis.
3.1 Value creation in context of academic literature
To understand what value creation is and what its role is in the <IR> framework, this section gives some context about the concept by summarizing what is written about it in academic literature. It is interesting to see how versatile the term value creation is and how the interpretation has changed over time. The literal meaning of value creation is the increase or decrease of value, but this term is often used in many contexts. The main purpose of a company is delivering value to customers, for which they are willing to pay, and to convert those payments to profit (Teece, 2010). A business model describes the way that a company wants to accomplish that. The business model closely relates to a company’s strategy. A strategy describes the long-term direction and is aimed to acquire a sustainable competitive advantage by setting objectives and goals. A business model is more generic and describes how it will achieve those goals by creating value.
21 Organizations often report on their contributions to society, relationships with suppliers,
philanthropy, arrangements with governments, customer satisfaction and collective employment contracts. This is either put in an additional chapter in the annual report or published in a separate sustainability report. Integrated Reporting is based on the principle that companies can only create sustained shareholder value by creating value for other stakeholders, so companies should
additionally explain how these stakeholder relationships contribute to value creation.
3.2 The role of value creation in the International <IR> framework
<IR> elaborates on this increasing importance stakeholder engagement. This section shows how the IIRC defined value creation in their <IR> framework and what striking aspects that definition contains. The members of the IIRC have reached consensus about the definition (Figure 3-1), but also keeps things quite abstract.
Value creation
Value created by an organization over time manifests itself in increases, decreases or transformations of the capitals caused by the
organization’s business activities and outputs. That value has two interrelated aspects – value created for:
The organization itself, which enables financial returns to the providers of financial capital
Others (i.e., stakeholders and society at large)
Source: International <IR> Framework Section 2.4
What immediately stands out in this definition is the distinguishing of internal and external value creation. Integrated thinking is built on the belief that shareholder value can only be sustained by creating value to other stakeholders. Providers of financial capital are interested in the value of the organization itself, which is expressed by the share price on the stock exchange. They also become interested in the value that is created for others, when it influences the value of the organization. Figure 3-1 illustrates how the IIRC sees the relationships between value creation for the own organization and for others. What is striking, is the importance of relationships and interactions like for example customer satisfaction, supplier relationships or brand value. This confirms the
[image:21.595.83.522.281.441.2]importance of social & relationship capital in the <IR> framework, but also shows the complexity of the capital type. It implicates that the value creation for the company itself comes from the business activities that are directed to increasing own value, but also a fraction of the value that flows to other stakeholders indirectly increases the company value. The question however is how big that fraction is and to what capital the value flows. Another important property of value creation is that it is relative and it should be compared to the period before. For example, earnings per share in one year is just a number, but if it is higher the next year, then there is value created. This is directly expressed by an increasing stock price when the company performs better than a period before.
22
[image:22.595.69.522.231.450.2]That relativity of value creation comes back in the six capitals of the <IR> framework. The framework is built on the process of value creation by transforming the six capitals into output capitals. The six capitals are financial, manufactured, intellectual, human, social & relationship and natural capital. The challenge for a business is to increase the value of the capitals over time and use their capitals in the most effective way. The capitals can also be interpreted as a company’s resources and relationships. The scope of this study is restricted to the value streams of natural and social & relationships capital (Figure 3-2). The value creation via the six capitals means that there is interdependency between the capitals. This means that for example financial capital maximization can be at the expense of one of the other capitals.
23 3.3 Measuring value creation via stakeholder value
Integrated reporting is based on the belief that companies can only create sustained value by serving all stakeholders instead of only the shareholders. It is remarkable that this splitting between
shareholders and other stakeholders is not included in the main figure of the value creation process (Figure 3-2). For better understanding of the dynamics of value creation via stakeholders, it is interesting to add this in a value creation figure (Figure 3-3). The figure shows that an organization has six input capitals that are used to execute their business activities. Instead of the value flowing directly to the output capitals, there should also be a value stream via other stakeholders. Those other stakeholder also indirectly contribute to creating value in the six capitals. In principle, the value creation process for the shareholders and other stakeholders could look like presented in Figure 3-3.
[image:23.595.81.513.249.482.2]In principle, a company is financially valued by the shareholder and the value is expressed by the share price at the stock exchange. The number of outstanding stocks multiplied by the share price is the total market value of the company. Therefore, in theory, the total value has to be equal to the sum of the financial, manufactured, intellectual, human, social & relationship, and natural capital. Value creation for the organization means that the sum of value of the capitals increases. These different capitals are re-used as input of the business activities to make it worth more. This six capitals-principle can also be the basis of a value creation model. Figure 4-3 shows the basis of a model that describes the abovementioned value creation process.
24
Static function of company value at time T.
𝑌𝑇 = 𝑚𝑇∗ 𝑆𝑇 = ∑6𝑖=1𝐶𝑖,𝑇 Parameters
mT = total number of outstanding shares of the company, at time T
YT = Total company value, at time T.
ST = Stock price, at time T.
CiT, = value of capital i at time T, with i = 1. Financial, 2. Manufactured, 3.
Intellectual, 4. Human, 5. Social & Relationship, 6. Natural.
Constraints
YT, ST, mT, t > 0
T, t, CiT ≥ 0
[image:24.595.69.525.91.263.2]0 ≤ s ≤ m ≤ l
Figure 3-4: Time-static model of value creation
This is still a static model of the value of a company, but the value creation process in the <IR> framework is a dynamic process, so the model also has to be extended with a time dimension.
3.4 Value creation in the short, medium and long term
The <IR> framework is not clear about what the concrete periods are, with respect to short, medium and long term. What is known is, that in general <IR> will typically be longer term oriented than regular reporting, but the exact time lengths are dependent of the organization’s investment cycles, strategy and its key stakeholders’ legitimate needs and interests (Section 4.57 of the <IR> framework). For example, the technology sector has much shorter product cycles than pharmaceuticals, so it is evident that the reporting time horizon is adjusted to that. The length of the reporting timeframe also influences the character of the report. Long-term information is probably more affected by
uncertainty, which results in reporting of more qualitative nature, while short term reporting can be better expressed quantitatively.
When an organization’s objective is to increase its value over time, according to the <IR> framework this is done by all the business activities together that affect the input capitals. Let us say that these business activities that are determined by the business model, together form a black box. However, after a short, medium or long period, they affect the six capitals separately. This will be added to the model by an extra variable vi that is a multiplier of the capital that is called value creation coefficient.
Therefore, when the organization performs well in a certain period, capital Ci will be multiplied with a
25 Optimization function of company value in the short, medium and long term
Max 𝑌𝑇+𝑡 = 𝑚𝑇+𝑡∗ 𝑆𝑇+𝑡= ∑6𝑖=1𝑣𝑖𝑇+𝑡∗ 𝐶𝑖𝑇
Parameters:
mT = Total number of outstanding shares of the company, at time T
YT+t = Total company value, at time T.
ST+t = Stock price after period t, with starting time point year T, and t = s:
Short term, m: medium term, l: long term*
viT+t = influencing coefficient of capital i on after period t, with i = 1.
Financial, 2. Manufactured, 3. Intellectual, 4. Human, 5. Social & Relationship, 6. Natural.
CiT, = value of capital i, with i = 1. Financial, 2. Manufactured, 3. Intellectual,
4. Human, 5. Social & Relationship, 6. Natural.
*t = s, m, or l and these terms are company specific.
Contraints : YT, ST, mT, t > 0
T, t, CjT ≥ 0
[image:25.595.75.522.89.359.2]0 ≤ s ≤ m ≤ l
Figure 3-5: Time-dynamic model of value creation
The value creation process of an organization can never be completely modelled, because there are infinitely many factors that influence the exact increase/decrease of the company value. This model is the base of this research though, and is helpful for understanding and quantifying the value creation principle. Since the problem statement is about how value is created by social & relationship capital and natural capital, so there has to be found a way to estimate the value creation coefficients v5 and
v6. v5 and v6 are the value creating coefficients in the model, and the research scope is to find out how
performance influences those coefficients. In Section 5, this will be investigated further by finding performance indicators that have the best predictive properties for estimating value creation coefficients v5 and v6.
[image:25.595.72.312.517.721.2]26
3.5 Conclusion
The purpose of this section was to create an understanding of the most important aspect of <IR>, which is value creation. Therefore, the following research question had to be answered: What is value creation and what is the role of value creation according to the International <IR> Framework? There is chosen for a pragmatic way of interpreting the value creation process to build the further research on. Value creation or value destroying is the increase or decrease of the total company value. This company value is divided by six capitals in the framework; namely financial capital, manufactured capital, intellectual capital, human capital, social & relationship capital and natural capital. Those six capitals should cover all possible company value, but in reality, companies do not always own all capitals. The concept of the <IR> framework is that all business activities that are determined by the business model affect the value of the six capitals separately. Therefore, the starting point is a certain amount of capital and after a period the capitals are increased or decreased separately and the sum of those capital values determine the total company value creation.
The IIRC believes that an organization can only create sustained value by serving all their
stakeholders. A stakeholder is a group or individual who can affect or is affected by the achievement of the organization's objectives. Examples of stakeholders of a company are customers, employees, suppliers, shareholders, governments, or unions. The IIRC only makes a distinction of importance between providers of financial capital and other stakeholders.
It is remarkable that the IIRC report puts emphasis on the importance of the stakeholders, but did not include them in the central figure of the value creation process. Figure 3-3 shows a conceptual value stream of how this value creation process via stakeholders also could look. For a better understanding of the value creation process, it was also interesting to attempt to model the process. Figure 3-4 and 3-5 show a simplified static and dynamic model with respect to time. The framework does not define the exact times for short, medium and long term, because this is company specific. The model shows that the value of the six separate capitals are multiplied by a value creation coefficient vi,T+t after
27 Section 3 explained the concept of value creation and showed a simplified value creation model that will be the basis for the remainder of this study. The purpose of this section is to explain the concept of social & relationship capital and natural capital. In addition, this section will pay attention to how these capitals relate to business performance. This should enable that in Section 5, the relationship between company performance and value creation can be studied. The central question for this section is: What are social & relationship capital and natural capital and how can related performance be measured?
In my opinion, external reporting is the last step in the business chain. A company starts with a mission and vision, and then defines a strategy and business model to create value for the customers and convert that into shareholder value. All the business activities should be aimed to execute the business model, which results in a certain company performance. Providers of financial capital and other parties are interested in those performances and therefore, an annual report is provided to them.
This section describes how company performance relates to the capitals of the <IR> framework and in particular social & relationship capital and natural capital, which are in the scope of this thesis. The general principles of <IR> are described in Section 2, but Section 4.1 will focus especially on the position of the capitals in <IR>. Subsequently, Sections 4.2 and 4.3 address the definitions of both selected capitals and how they can create value for a company and how stakeholders can be involved. This forms the basis for Section 4.4, which is focused on exploring how companies currently measure these performances and in what kind of format they are displayed. As a preparation for finding good performance measurements for social and natural capital (Section 5), Section 4.5 describes what good properties are for performance measurements and how that relates to social & relationship capital and natural capital. The purpose of the research is to find out how performance can be reported for in an integrated way. Section 4.6 explains that internal performance management must be aligned with external reporting and shows some well-known examples of structuring methods performance management. Section 4.7 concludes what social & relationship capital and natural capital are, and how this relates to value creation. In addition, the findings on the role of performance management in <IR> will be presented. Afterwards, Section 5 will link these findings to the value creation concept, and finally find a good way to report about company performance in an integrated report.
4.1 The role of the capitals in <IR>
The six capitals are included in the <IR> framework to attribute companies to describe all the capital that they use to execute their business activities. In reality, not all companies use all six capitals of the framework, but they should cover only the capitals that a company can possibly use or affect to describe their strategy. The definition of capital is “a stock that yields a flow of valuable goods or series into the future” (Costanza, 1997). The key role for the capitals is to explain the value increase or decrease of the company value in more detail. All the content elements (table 2-1) should be
28
capital and social & relationship capital. The IIRC did not want to make the framework unnecessarily complicated by combining them to one capital, so the proposed way to interpret them is from the point of view of the “carrier”. So for human capital is that the individual person, for social & relationship capital it is the intra/extra-organizational networks and for intellectual capital it is the organization itself.
4.2 Social & relationship capital
The fifth capital type in the framework is social & relationship capital. What immediately stands out is that the IIRC chose for combining social capital and capital in form of relationships. Especially social capital is a widely used concept in academic literature for many years, whereby many different definitions are made. This section contributes to gathering some context from academic literature and will describe the role of social & relationship capital in the International <IR> framework and how it relates to different stakeholders.
4.2.1 Social & relationship capital definition
There are many articles written about social capital and other social science. The <IR> framework positions social capital next to for example financial capital, which has very different characteristics. Financial capital is a given amount of money that a company can spend or not. This is different for social capital, which is in the first place difficult to monetize and secondly it cannot really be spent. The concept of social capital is not invented by the IIRC, but is introduced in earlier literature. Pierre Bourdieu already did an attempt in 1985 to distinguish economic capital, cultural capital and social capital, which he defined as: “the aggregate of the actual or potential resources which are linked to a possession of a durable network of more or less institutionalized relationships of mutual acquaintance or recognition”. The distinguishing of social capital came from the idea that powerful and wealthy people have more advantages with their relationships, which maintains inequality between social groups in society. Despite the different focus of social capital in <IR>, it does mention the advantages a company can have from a social network. Putnam (1995) and Pennar (1997) brought the concept of social capital a step further by linking it to value creation by determining the following definitons respectively: “features of social organization such as networks, norms and social trust that facilitate coordination and cooperation for mutual benefit” and “the web of social relationships that influences individual behavior and there affects economic growth”.
29 Social & relationship capital
The institutions and the relationships within and between communities, groups of stakeholders and other networks, and the ability to share information to enhance individual and collective well-being. Social and relationship capital includes:
Shared norms, and common values and behaviours.
Key stakeholder relationships, and the trust and willingness to engage that an organization has developed and strives to build and protect with external stakeholders.
Intangibles associated with the brand and reputation that an organization has developed an organization’s social license to operate.
Figure 4-1 IIRC definition of social & Relationship capital (source: Section 2.15 of the International <IR> Framework)
4.2.2 The relationship between social and relationship capital and stakeholders
Many stakeholders do influence the value creation of social and relationship capital. An organization needs to manage their relationships with stakeholders to create trust and loyalty, which at the end can be converted into profit. For example, relationships with suppliers are important for companies in many ways. Especially for manufacturing companies that rely on quality of supplied materials to offer good products to their customers. In addition, appointments with respect to supply time, payment periods, and product development can be essential for the value creation ability of an organization. However, other stakeholders like the end customers, employees and society can also influence social & relationship capital. Obviously, the relationships with customers are important for value creation. Loyalty of customers towards a brand or a product is essential for generating sustained revenues, so the relationship and trust that a company creates at their customer base is part of the social and relationship capital. Especially the customer relationship capital of companies has changed over the last decade because of the increasing importance of digital relationship management. Profiling on social media can help creating brand value and reputation as well as destroying it. The appearance towards a local community and society at large are part of the social & relationship capital too. The reputation and identity of a firm can be an important asset, but can also destroy many social & relationship value because of reputational damage
4.3 Natural capital
The definitions of natural capital in academic literature are not as diverse as the definitions of social & relationship capital. This section will start with the definitions of natural capital in both literature and the <IR> framework, and will be followed by the connection with different stakeholders.
4.3.1 Definition of Natural capital
Natural capital is “the spectrum of physical assets within the natural environment that deliver
30
Nevertheless, there is still no standard method for calculating the natural capital of a company that can be used for reporting. The definition that the IIRC has come to is shown in Figure 4-2.
Figure 4-2: IIRC definition of natural capital (Source: Section 2.15 of the International <IR> Framework
The IIRC has made an explicit distinction between renewable and non-renewable environmental resources. The availability of non-renewable resources can have a big negative impact on sustained success of a company. Non-renewable resources have more risk of becoming scarce in the future, which can form operational risk. Natural resources can be accounted for as company assets. Figure 4-3 shows some examples of those natural assets.
Trucost performed an interesting study on natural capital risk. Trucost is an organization of experts that identifies environmental risk and opportunities across company operations, supply chains and investment portfolios (Trucost, 2015). They tried to monetize the dependence of natural capital and the impact on their revenues. Companies often only take into account the resources that they have to pay for, but due to the scarcity of resources valuing unpriced natural capital consumption becomes increasingly important. The global natural business demand for natural capital conflicts with the environmental degradation and can result in failing supply, so this can really affect business results and the value creation. A set of six environmental performance indicators are used to measure: land use, water consumption, greenhouse gases, air pollution, land/water pollution, and waste.
4.3.2 The relationship between natural capital and stakeholders
Several stakeholders, like suppliers, customers, and governments, also affect value creation of natural capital. Especially at manufacturing firms, suppliers need to source materials and are dependent of the availability of the materials. When the materials become scarce, the more expensive they will be which negatively influences the value creating ability of the company. In addition, customers have an influence on the value creation of natural capital. Currently, there is an ongoing trend of customer awareness about the environment and resources that are harmful for the environment, so customers can consciously choose not to buy those environment-damaging products anymore. In that case, the resource can still be available for the company, but it becomes useless and the value declines. Those damaging materials or processes can also be prohibited by regulation. In that situation, resources can become useless for companies have to search for alternatives that can be more expensive. Purchasing
Natural capital
All renewable and non-renewable environmental resources and processes that provide goods or services that support the past, current or future prosperity of an organization. It includes:
Air, water, land, minerals and forests
Biodiversity and eco-system health.
Two categories in natural capital assets
Natural assets, which are non-renewable and traded, such as fossil fuel and mineral “commodities”;
Natural assets, which provide finite renewable goods and services for which no price typically exists, such as clean air, groundwater and biodiversity
31 non-environmental friendly materials can be charged with higher tax rates, which can negatively influence value creation.
4.4 Performance Reporting about natural and social & relationship capital
According to the value creation framework of <IR>, the capitals that a company owns at a certain point in time have some value. These capitals are used as resources for executing the business model of the company, which is aimed to create new value. Now organizations have to comply with the new standards of <IR>, they have to communicate how they use their capital and what the final yield is. In other words, how did the company perform in perspective of the six capitals? This section shows what the <IR> framework prescribes for performance reporting.
4.4.1 External reporting about performance
The International <IR> Framework distinguishes eight content elements, of which ‘performance’ is the most important for this thesis. The IIRC describes this as: “To what extend has the organization achieved its strategic objectives for the period and what are its outcomes in terms of effects on the capitals?” (The IIRC, 2013).
According to the <IR> principles, performance of a company should be explained in an annual report by both qualitative and quantitative information. This is not entirely new, because many ‘traditional’ reports and sustainability reports do that this way already. The qualitative aspect is often a textual explanation of the initiatives the firm took over the last year and what results that has given. In other words, it is mostly about explaining of strategic and management choices. In an integrated report, those explanations have to be more focused on how the strategic choices and business activities relate to value creation of the capitals.
The quantitative aspect of external reporting is more focused on performance reporting. Quantitative performance information is often presented by a table of key figures. Those important quantitative performance measures are called Key Performance Indicators (KPIs). An organization can choose what KPIs they want to report and what they think is important performance information. To comply with the <IR> principles, the KPI framework that a firm reports probably has to be categorized by capital to show an integrated view. Choosing KPIs on separate capital performance is a challenge, because indicators generally reflect organization-wide performance and overlap with more than one capital (Association of Chartered Certified Accountants (ACCA), 2013).
4.4.2 Lack of specific quantitative guidelines.
32
framework does not clarify how to quantify or monetize the value of the capitals or the total value of the company. The same goes for the creation of more value per capital per period.
In fact, the IIRC demands that organizations report both qualitative and quantitative information about performance and about value creation in the short, medium and long term, but they do not describe how this quantification should be performed. The framework stays abstract and does not provide solutions to companies for these difficult requirements.
4.5 Properties of good Performance measures
This section shows an overview of what requirements good performance measures should meet, to bring quantitative performance reporting a step further for <IR> purposes. Therefore, the guidelines from the <IR> framework will be completed with academic literature and knowledge of Deloitte Consulting.
4.5.1 Guidelines for KPIs from the international <IR> Framework
Although the <IR> framework does not provide clear and specific KPIs, it does contain a list of
characteristics for suitable KPIs (Figure 4-4). What is known is that an integrated report should contain a combination of qualitative and quantitative information. This information should include targets, past and current performance, the state of key stakeholder relationships and the effect on the capitals of the organization (The IIRC, 2013). Presenting targets against past and current performance increases comparability and are inevitably quantitative.
Common characteristics of suitable quantitative indicators Relevant to the circumstances of the organization
Consistent with indicators used internally by those charged with governance Connected (e.g., they display connectivity between financial and other information) Focused on the matters identified by the organization’s materiality determination process Presented with the corresponding targets, forecasts or projections for two or more future periods Presented for multiple periods (e.g., three or more periods) to provide an appreciation of trends Presented against previously reported targets, forecasts or projections for the purpose of accountability Consistent with generally accepted industry or regional benchmarks to provide a basis for comparison Reported consistently over successive periods, regardless of whether the resulting trends and
comparisons are favourable or unfavourable
Presented with qualitative information to provide context and improve meaningfulness. Relevant qualitative information includes an explanation of:
- measurement methods and underlying assumptions
- The reasons for significant variations from targets, trends or benchmarks, and why they are or are not expected to reoccur.
Source: Section 4.53 of the International <IR> Framework
Figure 4-4: Characteristics of suitable quantitative performance indicators according to the International <IR> Framework
33 Figure 4-5: Conceptual framework for reporting Key Performance Indicators in an Integrated Report.
4.5.2 Deloitte research
In Section 2.1.4 was mentioned that Deloitte Netherlands performs a yearly research about Integrated Reporting in The Netherlands. This research shows to what extend Dutch (listed) companies complied with the principles of <IR> in their annual reports. The Integrated Reporting Scorecard that is used for this assessment, which assesses all eight content elements and seven guiding principles and results in a balanced overall score about the progress with <IR>. Part of this assessment is how good the content element ‘performance’ is treated and this is done by checking whether the following aspects are included in the report:
Multiple years reported
Current and previous targets
Qualitative explanation
Compared with peer group
34
4.5.3 Properties of Good KPIs from academic literature
Besides the International <IR> framework and Deloitte knowledge about performance measures, there is also written many academic articles about performance indicators. Performance indicators are tools to compare actual results with targets that has been set (Fortuin, 1988). Organizations are always trying to outperform competitors and to accomplish that they need to adjust their strategy to their external environment and improving continuously. To accommodate this improvement,
companies need to measure their performance and follow the progress that the organization makes, in order to improve processes, or parts of processes (Fortuin, 1988). Performance indicators must be aligned with the business strategy and are useful to see the consequences of an organization’s actions (McAdam & Bailie, 2002). KPIs are the performance indicators that a company actually uses to assess their performance. The principles of <IR> aligns with the idea of Neely (1999) that a company should not only use financial measurements, but also non-financial measurements such as social &
relationship aspects. Kaplan and Norton (1992) suggest that firms should not have more than twenty KPIs that are focusing on those performance aspects that are most crucial for the success of an organization. When choosing a set of KPI’s it is useful to use the list of requirements for good performance indicators from Fortuin (1988):
The goal of the organization is clear All users accept the PI’s as measures The PI’s yield insight into the state of affair
The PI is derived from quantities that can be influenced, or controlled
Both supplier as customer agree that given PI indeed are relevant for customer satisfaction Good PI are available on time with the frequency agreed on
The frequency should be tuned to the rate of change of the process so that each new edition shows progress
PI’s should be consistent and reliable
4.6 Structuring of performance management
If an organization wants to comply with all the above-mentioned requirements for external quantitative performance reporting, companies also have to manage their internal processes. In principle is the external report a reflection of how the company has performed with executing their business model and strategy. Therefore, it is a challenge to select a set of performance indicators that align with the firms’ strategy and show a complete view of all the business processes. Section 4.3 showed desired characteristics of individual KPIs, but it is also important to choose a good set of KPIs to measure the performance of a full department or company.