Article
1
Estimation of Genetic Parameters and Prediction of
2
Genotypic Values in Common Beans Using Mixed
3
Models
4
Jessica Delfini 1,2, Vania Moda Cirino 2, Claudete de Fátima Ruas 3, Paulo Mauricio Ruas 3, José
5
dos Santos Neto 2, Leandro Simões Azeredo Gonçalves 1,*
6
1 Agronomy Department, Universidade Estadual de Londrina (UEL), Rodovia Celso Garcia Cid, Km 380,
7
Londrina, PR 86051-900, Brazil
8
2 Instituto Agronômico do Paraná (IAPAR), Rodovia Celso Garcia Cid, Km 375, Londrina, PR 86047-902,
9
Brazil
10
3 Biology Department, Universidade Estadual de Londrina (UEL), Rodovia Celso Garcia Cid, Km 380,
11
Londrina, PR 86051-900, Brazil
12
* Correspondence: [email protected]; Tel.: +xx-xxx-xxx-xxxx
13
14
Abstract: In the international scenario of agriculture, Brazil stands out as the main producer and
15
consumer of common bean (Phaseolus vulgaris L.) The increase in the productive potential of the crop
16
is mainly due to breeding programs. The objective of this study was to estimate genetic parameters,
17
predict genotypic values with REML/BLUP (Restricted Maximum Likelihood/Best Linear Unbiased
18
Prediction) and, based on these values, study the variability in common bean cultivars with carioca
19
and black grain. Twenty three agromorphological descriptors were evaluated, among them grain
20
yield. Deviance analysis detected significant differences between the cultivars in both groups.
21
Selective accuracy (Ac) was considered high for most of the traits. Broad-sense heritability (ℎ𝑔2)
22
ranged from 0.05 to 0.72, but it was low for the trait yield (YLD). In the carioca grain group, the ℎ𝑔2
23
values for the traits related to plant morphology were higher than in the black group. Nevertheless,
24
the ℎ𝑔2 values in the black group were higher in relation to the pod and seed traits. The correlations
25
for YLD were moderate but different in the two commercial groups studied. In the black group,
26
variables related to the seed morphology were correlated with grain yield, and in the carioca group,
27
traits related to seed quantity. Based on the groupings, variability among the cultivars was
28
observed. Three distinct clusters were formed for the carioca group and four for the black group.
29
Based on the predicted genetic values, genetic variability and the most adapted and stable cultivars
30
were detected among the cultivars in the studied environments.
31
Keywords: Phaseolus vulgaris L.; REML/BLUP; genetic diversity
32
33
1. Introduction
34
Common bean (Phaseolus vulgaris L.) is cultivated all over the world; it is considered the most
35
important legume for fresh consumption and a chief source of proteins (approximately 22%),
36
vitamins and minerals (Ca, Cu, Fe, Mg, Mn, Zn) of human food, in particular in developing countries
37
[1]. In the international scenario, Brazil stands out as the world’s third largest producer and one of
38
the largest consumers of common bean (FAO 2016). The crop is produced in different growing
39
seasons (rainy, dry and fall-winter seasons), and is planted in most Brazilian states, providing
40
constant supply of the product on the market. The country's annual common bean production is
41
grown on an area of approximately 3.2 million hectares, with an output of around 3.4 million tons
42
and a mean yield of 1,069 kg ha-1, in the growing seasons of 2016/17 [3].
43
In Brazil, common bean yield was significantly optimized in the last decades, as a result of
44
breeding for technological and nutritional quality of common bean. The yield increase is due to
45
several factors, such as technologies of crop planting and management, cultural practices and soil
46
management and conservation. However, the greatest yield gain resulted mainly from the planting
47
of improved cultivars with high yield potential, yield stability resulting from resistance and/or
48
tolerance to adverse biotic and abiotic factors, and suited for mechanical harvesting [4,5].
49
The existence of genetic variability in the species P. vulgaris allows the recombination and
50
selection of cultivars adapted to different environments and to meet the demand of consumers and
51
industry for different purposes and uses. The study of genetic variability in commercial cultivars or
52
elite lines is extremely relevant for crop breeding, for underlying the exploitation of traits that are
53
already adapted to specific climatic conditions. In spite of the variability available in the species, a
54
narrowing of the genetic base of the cultivars developed in Brazilian breeding programs has been
55
observed, since these use mostly Mesoamerican germplasm as parents, with little introduction of
56
alleles derived from other gene pools.
57
The use of mixed models to estimate genetic parameters and predict genotypic values, excluding
58
environmental effects, is extremely important in the orientation of breeding programs, allowing the
59
study of cultivar behavior without the influence of genotype - environment (GE) interaction [6]. In
60
view of the above, this study had the objective of estimating genetic parameters, predicting the
61
genotypic values via REML/BLUP (Restricted Maximum Likelihood/Best Linear Unbiased
62
Prediction) and based on these values, to study the variability of common bean cultivars of the carioca
63
and black grain market groups.
64
2. Material and Methods
65
2.1. Plant material
66
The data used in this study resulted from two independent trials (carioca and black commercial
67
groups), with economically important, widely grown cultivars in Brazil. All of them were bred in
68
programs of public or private institutions and registered by the National Register of Cultivars of the
69
Ministry of Agriculture, Livestock and Supply, Brazil.
70
One trial assessed 20 carioca beans cultivars (IAPAR 81, IPR Eldorado, IPR Tangará, IPR Campos
71
Gerais, IPR Curió, IPR Andorinha, IPR Maracanã, IPR Bem-te-vi, IPR Quero-quero, Pérola, BRS
72
Estilo, BRS Notável, Carioca, IAC Alvorada, IAC Formoso, IAC Imperador, FT 65, TAA Bola Cheia,
73
TAA Gol e TAA Dama) and the other 19 black bean cultivars (IAPAR 8 – Rio Negro, IAPAR 20,
74
IAPAR 44, IAPAR 65, Rio Tibagi, IPR Uirapuru, IPR Chopim, IPR Graúna, IPR Gralha, IPR Tuiuiú,
75
IPR Nhambu, BRS Valente, BRS Campeiro, BRS Supremo, BRS Esteio, IAC Una, IAC Diplomata, FT
76
Soberano e FT 41).
77
2.2. Experimental design and phenotyping
78
The experiments of agromorphological characterization were installed in four environments in
79
the state of Paraná (BR); two in the rainy season of 2014/2015, in Ponta Grossa (25o09’11”S;
80
50o09’22”W; altitude: 869 m) and in Guarapuava (25o23’51”S; 51o32’36”W; altitude: 1041 m), and two
81
in the dry season of 2015, in Ponta Grossa and Santa Tereza do Oeste (25o05’20”S; 53o35’25”W,
82
altitude: 750 m). The experiments were arranged in a randomized complete block design with three
83
replications and plots consisting of four 4-m rows spaced 0.5 m apart, at a density of 12 plants per
84
linear meter, considering the two central rows for evaluation.
85
This study analyzed a total of 23 quantitative agromorphological traits, namely: primary leaf
86
length (PLL); primary leaf width (PLW); primary leaf index (PPL/PLW) (PLI); central leaflet length
87
(CLL); central leaflet width (CLW); central leaflet index (CLL/CLW) (CLI); main stem length (StL);
88
insertion height of the 1st pod (IFP); number of nodes on the main stem (NN); pod length (PL); number
89
of seeds per pod (SP); number of locules per pod (LP); total number of pods per plant (NPP); total
90
number of seeds per plant (NSP); main stem thickness (StTh); seed length (SL); seed width (SWth);
91
seed thickness (STh); total seed weight per plant (TSW); weight of 1,000 seeds (W1000); coefficient J
92
(COEF J); coefficient H (COEF H); and grain yield (YLD).
2.3. Data analysis
94
The agromorphological data were analyzed using the mixed model methodology (model 54), of
95
software Selegen-REML/BLUP [7]. The statistical model was 𝑦 = 𝑋𝑟 + 𝑍𝑔 + 𝑊𝑖 + 𝑒, where y is the
96
data vector; r the vector of replication effects (assumed as fixed) added to the general mean; g the
97
vector of genotypic effects (assumed as random); i the vector of the effects of the genotype -
98
environment interaction (GE) (random); and e the vector of (random) errors. X, Z and W represent
99
the incidence matrices for the above effects. The assumed distributions and structures of means (E)
100
and variances (Var) were:
101
𝐸 [ 𝑦 𝑔 𝑖 𝑒 ] = [ 𝑋𝑟 0 0 0 ] ; 𝑉𝑎𝑟 [𝑔𝑖 𝑒] = [𝐼𝜎𝑔2
0 0
0 𝐼𝜎𝑖2
0 0 0 𝐼𝜎𝑒2
]
102
The model was fitted using the mixed model equations:
103
[𝑋′𝑋𝑍′𝑋 𝑊′𝑋
𝑋′𝑍 𝑍`𝑍 + 𝐼𝜆1
𝑊′𝑍
𝑋′𝑊 𝑍′𝑊 𝑊′𝑊 + 𝐼𝜆2
] × [𝑔̂𝑟̂ 𝑖̂ ] = [ 𝑋′𝑦 𝑍′𝑦 𝑊′𝑦 ],
104
where 𝜆1=𝜎𝑒
2
𝜎𝑔2= 1−ℎ𝑔2−𝑖2
ℎ𝑔2 ; where: ℎ𝑔
2= 𝜎𝑔2
𝜎𝑔2+𝜎𝑖2+𝜎𝑒2 corresponds to the individual heritability in the
105
broad sense of the block; 𝑖2=𝜎 𝜎𝑖2
𝑔2+𝜎𝑖2+𝜎𝑒2 to the coefficient of determination of the GE interaction
106
effects; 𝜎𝑔2 is the genotypic variance between common bean cultivars; 𝜎𝑖2 the variance of the GE
107
interaction; 𝜎𝑒2 the residual variance between plots; 𝑟𝑔𝑙𝑜𝑐= 𝜎𝑖
2
𝜎𝑔2+𝜎𝑖2= ℎ𝑔2
ℎ𝑔2+𝑖2 corresponds to the
108
genotypic correlation of genotypes across environments.
109
The iterative estimators of the variance components, by restricted maximum likelihood (REML)
110
and the EM algorithm, were 𝜎̂𝑒2=[𝑦′𝑦−𝑟̂′𝑋′𝑦−𝑔̂′𝑍′𝑦−𝑖̂′𝑊′𝑦][𝑁−𝑟(𝑥)] ; 𝜎̂𝑔2=[𝑔̂′𝑔̂+𝜎̂𝑒
2𝑡𝑟𝐶22]′𝑔̂
𝑞 ; 𝜎̂𝑖
2=[𝑖′𝑖+𝜎̂𝑒2𝑡𝑟𝐶33]
𝑠 ; where:
111
C22 and C33 were from 𝐶−1= [
𝐶11 𝐶21 𝐶31 𝐶12 𝐶22 𝐶32 𝐶13 𝐶23 𝐶33 ] −1 = [𝐶 11 𝐶21 𝐶31 𝐶12 𝐶22 𝐶32 𝐶13 𝐶23
𝐶33], where C is the matrix of the coefficients
112
of mixed model equations; tr the matrix trace operator; r(x) is the rank of matrix X; N, q, s = total
113
number of data, number of genotypes and number of GE combinations, respectively.
114
By this model, the empirical BLUP predictors (eBLUP or REML/BLUP) of the interaction-free
115
genotypic values were obtained, given by 𝜇̂ + 𝑔̂𝑖, where 𝜇̂ is the mean of all environments and 𝑔̂𝑖
116
the genotypic effect free of the GE interaction. For each environment j, the genotypic values (Vg) are
117
predicted by 𝜇̂ + 𝑔𝑗 ̂ + (𝑔̂𝑒)𝑖 𝑖𝑗, where 𝜇̂𝑗 is the mean of environment j; 𝑔̂𝑖 the genotypic effect of
118
genotype i in environment j; and (𝑔̂𝑒)𝑖𝑗 is the effect of the GE interaction in relation to genotype i.
119
The prediction of genotypic values by capitalizing the mean interaction (𝑔̂𝑒𝑚) in the different
120
environments is given by 𝜇̂ + 𝑔𝑖 ̂ + 𝑔̂𝑒𝑖 𝑚, and is calculated by: 𝜇̂ + (𝜎̂𝑔2+𝜎̂𝑖𝑛 2)
𝜎
̂𝑔2 𝑔̂𝑖, in which 𝜇̂ is the overall
121
mean of all environments; n the number of environments, and 𝑔𝑖 the genotypic effect of genotype i.
122
The Harmonic Mean of Genetic Values (HMGV) to assess yieldstability was computed by the
123
equation: 𝐻𝑀𝐺𝑉𝑖= ∑ 𝑛( 1
𝑉𝑔𝑖𝑗)
𝑛
𝑗=1 , where n is the number of environments (n = 4) in which genotype i was
124
evaluated,and 𝑉𝑔𝑖𝑗 the genotypic value of genotype i in environment j, expressed as the proportion
125
of the mean of this environment. The Relative Performance of Genetic Values(RPGV) for adaptability
126
was calculated by the expression: 𝑅𝑃𝐺𝑉𝑖=𝑛1
(∑𝑛𝑗=1𝑉𝑔𝑖𝑗)
𝑀𝑗 , where 𝑀𝑗 is the mean common bean yield in
127
environment j. The combined selection, considering common bean yield, stability and adaptability
128
simultaneously, is given by the statistics HMRPGV: HMRPGV𝑖= 𝑛/ (∑𝑛𝑗=1×1)
𝑉𝑔𝑖𝑗 .
129
The predicted genotypic values of the agromorphological traits were used for Pearson’s
130
correlation analysis and Ward’s hierarchical cluster analysis based on the mean standardized
Euclidean distance. For these analyses we used software R (R Core Team 2017) with the packages
132
corrplot and ade4.
133
3. Results
134
By analysis of deviance, a significant effect of genotypes (P <0.05) was detected by the chi-square
135
test for all traits evaluated. A significant effect was also observed for the GE interaction for most traits,
136
except StTh and COEF J in the carioca group and SL and SWth in the black group. The selective
137
accuracy (Ac) ranged from 0.60 (NPP) to 0.98 (COEF J) and from 0.50 (PLI) to 0.98 (PL) in the carioca
138
and black groups, respectively (Tables 1 and 2).
139
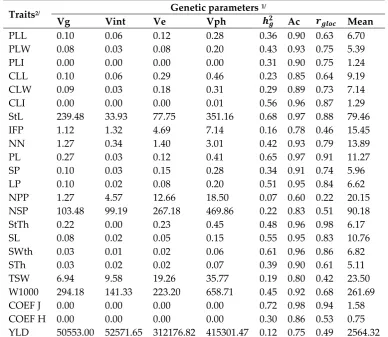
Table 1 Genetic parameters for 23 agromorphological traits in the characterization study of carioca
140
bean cultivars in four environments in the state of Paraná in the rainy (2014/15) and dry growing
141
seasons (2015/15).
142
Traits2/ Genetic parameters
1/
Vg Vint Ve Vph 𝒉𝒈𝟐 Ac 𝒓𝒈𝒍𝒐𝒄 Mean
PLL 0.10 0.06 0.12 0.28 0.36 0.90 0.63 6.70
PLW 0.08 0.03 0.08 0.20 0.43 0.93 0.75 5.39
PLI 0.00 0.00 0.00 0.00 0.31 0.90 0.75 1.24
CLL 0.10 0.06 0.29 0.46 0.23 0.85 0.64 9.19
CLW 0.09 0.03 0.18 0.31 0.29 0.89 0.73 7.14
CLI 0.00 0.00 0.00 0.01 0.56 0.96 0.87 1.29
StL 239.48 33.93 77.75 351.16 0.68 0.97 0.88 79.46
IFP 1.12 1.32 4.69 7.14 0.16 0.78 0.46 15.45
NN 1.27 0.34 1.40 3.01 0.42 0.93 0.79 13.89
PL 0.27 0.03 0.12 0.41 0.65 0.97 0.91 11.27
SP 0.10 0.03 0.15 0.28 0.34 0.91 0.74 5.96
LP 0.10 0.02 0.08 0.20 0.51 0.95 0.84 6.62
NPP 1.27 4.57 12.66 18.50 0.07 0.60 0.22 20.15
NSP 103.48 99.19 267.18 469.86 0.22 0.83 0.51 90.18
StTh 0.22 0.00 0.23 0.45 0.48 0.96 0.98 6.17
SL 0.08 0.02 0.05 0.15 0.55 0.95 0.83 10.76
SWth 0.03 0.01 0.02 0.06 0.61 0.96 0.86 6.82
STh 0.03 0.02 0.02 0.07 0.39 0.90 0.61 5.11
TSW 6.94 9.58 19.26 35.77 0.19 0.80 0.42 23.50
W1000 294.18 141.33 223.20 658.71 0.45 0.92 0.68 261.69
COEF J 0.00 0.00 0.00 0.00 0.72 0.98 0.94 1.58
COEF H 0.00 0.00 0.00 0.00 0.30 0.86 0.53 0.75
YLD 50553.00 52571.65 312176.82 415301.47 0.12 0.75 0.49 2564.32
1/Vg: genotypic variance; Vint: variance of genotype-environment interaction; Ve: residual variance;
143
Vph: phenotypic variance; ℎ𝑔2: broad-sense heritability; Ac: selective accuracy; 𝑟𝑔𝑙𝑜𝑐: genotype
144
correlation between performance in various environments; and Mean: overall mean.2/ Primary leaf
145
length (PLL); primary leaf width (PLW); primary leaf index (PPL/PLW) (PLI); central leaflet length
146
(CLL); central leaflet width (CLW); central leaflet index (CLL/CLW) (CLI); main stem length (StL);
147
insertion height of the 1st pod (IFP); number of nodes on the main stem (NN); pod length (PL); number
148
of seeds per pod (SP); number of locules per pod (LP); total number of pods per plant (NPP); total
149
number of seeds per plant (NSP); main stem thickness (StTh); seed length (SL); seed width (SWth);
150
seed thickness (STh); total seed weight per plant (TSW); weight of 1,000 seeds (W1000); coefficient J
151
(COEF J); coefficient H (COEF H); and grain yield (YLD).
152
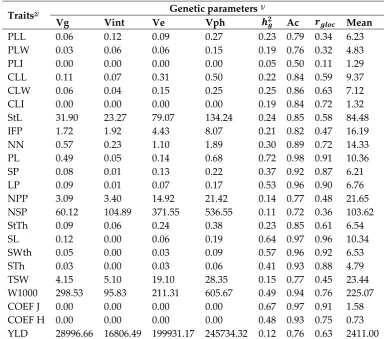
Table 2 Genetic parameters for 23 agromorphological traits in the characterization study of black bean
154
cultivars in four environments in the state of Paraná, in the rainy (2014/15) and dry growing seasons
155
(2015/15).
156
Traits2/ Genetic parameters
1/
Vg Vint Ve Vph 𝒉𝒈𝟐 Ac 𝒓𝒈𝒍𝒐𝒄 Mean
PLL 0.06 0.12 0.09 0.27 0.23 0.79 0.34 6.23
PLW 0.03 0.06 0.06 0.15 0.19 0.76 0.32 4.83
PLI 0.00 0.00 0.00 0.00 0.05 0.50 0.11 1.29
CLL 0.11 0.07 0.31 0.50 0.22 0.84 0.59 9.37
CLW 0.06 0.04 0.15 0.25 0.25 0.86 0.63 7.12
CLI 0.00 0.00 0.00 0.00 0.19 0.84 0.72 1.32
StL 31.90 23.27 79.07 134.24 0.24 0.85 0.58 84.48
IFP 1.72 1.92 4.43 8.07 0.21 0.82 0.47 16.19
NN 0.57 0.23 1.10 1.89 0.30 0.89 0.72 14.33
PL 0.49 0.05 0.14 0.68 0.72 0.98 0.91 10.36
SP 0.08 0.01 0.13 0.22 0.37 0.92 0.87 6.21
LP 0.09 0.01 0.07 0.17 0.53 0.96 0.90 6.76
NPP 3.09 3.40 14.92 21.42 0.14 0.77 0.48 21.65
NSP 60.12 104.89 371.55 536.55 0.11 0.72 0.36 103.62
StTh 0.09 0.06 0.24 0.38 0.23 0.85 0.61 6.54
SL 0.12 0.00 0.06 0.19 0.64 0.97 0.96 10.34
SWth 0.05 0.00 0.03 0.09 0.57 0.96 0.92 6.53
STh 0.03 0.00 0.03 0.06 0.41 0.93 0.88 4.79
TSW 4.15 5.10 19.10 28.35 0.15 0.77 0.45 23.44
W1000 298.53 95.83 211.31 605.67 0.49 0.94 0.76 225.07
COEF J 0.00 0.00 0.00 0.00 0.67 0.97 0.91 1.58
COEF H 0.00 0.00 0.00 0.00 0.48 0.93 0.75 0.73
YLD 28996.66 16806.49 199931.17 245734.32 0.12 0.76 0.63 2411.00
1/Vg: genotypic variance; Vint: variance of genotype-environment interaction; Ve: residual variance;
157
Vph: phenotypic variance; ℎ𝑔2: broad-sense heritability; Ac: selective accuracy; 𝑟𝑔𝑙𝑜𝑐: genotype
158
correlation between performance in various environments; and Mean: overall mean.2/ Primary leaf
159
length (PLL); primary leaf width (PLW); primary leaf index (PPL/PLW) (PLI); central leaflet length
160
(CLL); central leaflet width (CLW); central leaflet index (CLL/CLW) (CLI); main stem length (StL);
161
insertion height of the 1st pod (IFP); number of nodes on the main stem (NN); pod length (PL); number
162
of seeds per pod (SP); number of locules per pod (LP); total number of pods per plant (NPP); total
163
number of seeds per plant (NSP); main stem thickness (StTh); seed length (SL); seed width (SWth);
164
seed thickness (STh); total seed weight per plant (TSW); weight of 1,000 seeds (W1000); coefficient J
165
(COEF J); coefficient H (COEF H); and grain yield (YLD).
166
Heritability in the broad sense (ℎ𝑔2) varied from 0.07 (NPP) to 0.72 (COEF J) in the carioca group
167
and from 0.05 (PLI) to 0.72 (PL) in the black group. In both groups, ℎ𝑔2 for YLD was considered low
168
(0.12). The ℎ𝑔2 values for the carioca group were higher than for the black group for the traits related
169
to plant morphology (PLL, PLW, PLI, CLL, CLW, CLL, StL, NN and StTh), while for the black group,
170
ℎ𝑔2 was higher for pod and seed-related traits (PL, SP, LP, NPP, SL, STh, W1000 and COEF H).
171
The 𝑟𝑔𝑙𝑜𝑐 values, which indicate the genotypic correlation between trait performance in the
172
different environments, confirmed the results for heritability in the black and carioca groups. In both,
173
the traits with higher ℎ𝑔2 were associated with a higher 𝑟𝑔𝑙𝑜𝑐. The ℎ𝑔2 values for YLD were equal for
174
both groups, although 𝑟𝑔𝑙𝑜𝑐 was higher for the black group.
175
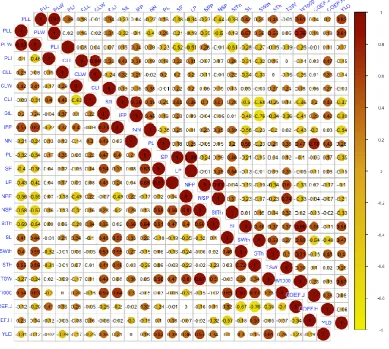
In Pearson's linear correlation analysis, the correlations were high between IFP x StL (0.73 and
176
0.78, respectively), NPP x NSP (0.80 and 0.87, respectively) and SP x LP (0.93 and 0.89, respectively)
177
(Fig. 1). No variables with high correlations with YLD were detected. Moderate correlations were
178
observed for SP, NSP and TSW (0.52, 0.57 and 0.61, respectively) in the carioca group, and for PLL
179
(0.62), PLW (0.61), SL (0.58), SWth (0.47), STh (0.40), and W1000 (0.67) for the black group.
181
Fig. 1 Pearson’s genotypic correlation among 23 agronomic traits evaluated in 20 and 19 carioca
182
(bottom) and black bean cultivars (top), respectively. primary leaf length (PLL); primary leaf width
183
(PLW); primary leaf index (PPL/PLW) (PLI); central leaflet length (CLL); central leaflet width (CLW);
184
central leaflet index (CLL/CLW) (CLI); main stem length (StL); insertion height of the 1st pod (IFP);
185
number of nodes on the main stem (NN); pod length (PL); number of seeds per pod (SP); number of
186
locules per pod (LP); total number of pods per plant (NPP); total number of seeds per plant (NSP);
187
main stem thickness (StTh); seed length (SL); seed width (SWth); seed thickness (STh); total seed
188
weight per plant (TSW); weight of 1,000 seeds (W1000); coefficient J (COEF J); coefficient H (COEF
189
H); and grain yield (YLD).
190
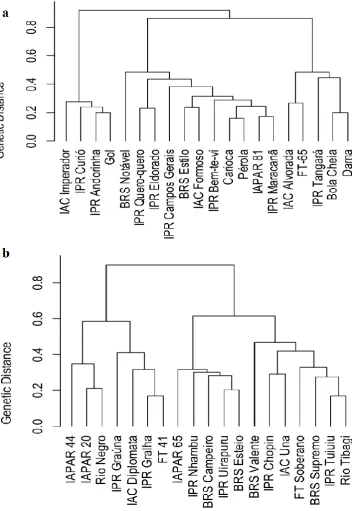
By Ward's clustering method, the carioca cultivars were separated in three groups; the first with
191
the cultivars IAC Imperador, IPR Curió, IPR Andorinha and Gol; the second and most numerous
192
contained 11 cultivars (BRS Notável, IPR Quero-quero, IPR Eldorado, IPR Campos Gerais, BRS Estilo,
193
IAC Formoso, IPR Bem-te-vi, Carioca, Pérola, IAPAR 81 and IPR Maracanã); and the third group
194
comprised the cultivars IAC Alvorada, FT-65, IPR Tangará, Bola Cheia and Dama (Fig. 2a).
195
In the black group, the cultivars were separated in four groups; group I was constituted by
196
cultivars IAPAR 44, IAPAR 20 and Rio Negro; group II consisted of IPR Graúna, IAC Diplomata, IPR
197
Gralha and FT 41; group III of IAPAR 65, IPR Nhambu, BRS Campeiro, IPR Uirapuru and BRS Esteio;
198
and group IV consisted of the cultivars BRS Valente, IPR Chopim, IAC Una, FT Soberano, BRS
199
Supremo, IPR Tuiuiú and Rio Tibagi (Fig. 2b).
201
Fig. 2 Dendrogram of genetic dissimilarity between 20 and 19 carioca (a) and black (b) bean cultivars
202
grouped by Ward’s method, based on the standardized mean Euclidean distance matrix.
203
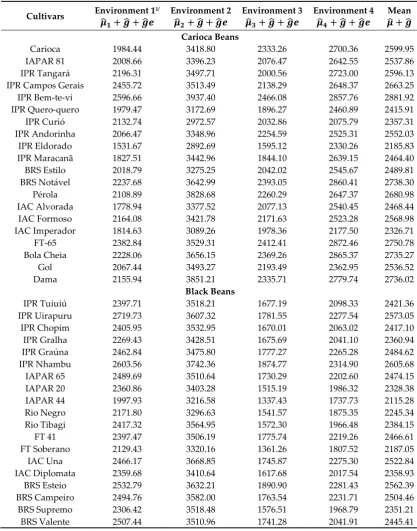
According to estimates of genotype values of YLD of common bean cultivars for the four
204
environments and their means, and by the methods applied in the analysis of adaptability (HMGV),
205
stability (RPVG) and both together (HMRPGV), five cultivars stood out above the others in the
206
different environments, for all methods (Tables 3 and 4). For both groups, the mean environment and
207
the HMRPGV method were completely coincident, and the variations in the other environments were
208
small.
Table 3 Estimates of genotypic values of grain yield (kg ha-1) of carioca and black bean cultivars for
210
four environments and for the mean environment.
211
Cultivars Environment 1𝝁̂ 1/
𝟏+ 𝒈̂ + 𝒈̂𝒆
Environment 2 𝝁̂𝟐+ 𝒈̂ + 𝒈̂𝒆
Environment 3 𝝁̂𝟑+ 𝒈̂ + 𝒈̂𝒆
Environment 4 𝝁
̂𝟒+ 𝒈̂ + 𝒈̂𝒆
Mean 𝝁̂ + 𝒈̂ Carioca Beans
Carioca 1984.44 3418.80 2333.26 2700.36 2599.95 IAPAR 81 2008.66 3396.23 2076.47 2642.55 2537.86 IPR Tangará 2196.31 3497.71 2000.56 2723.00 2596.13 IPR Campos Gerais 2455.72 3513.49 2138.29 2648.37 2663.25 IPR Bem-te-vi 2596.66 3937.40 2466.08 2857.76 2881.92 IPR Quero-quero 1979.47 3172.69 1896.27 2460.89 2415.91 IPR Curió 2132.74 2972.57 2032.86 2075.79 2357.31 IPR Andorinha 2066.47 3348.96 2254.59 2525.31 2552.03 IPR Eldorado 1531.67 2892.69 1595.12 2330.26 2185.83 IPR Maracanã 1827.51 3442.96 1844.10 2639.15 2464.40 BRS Estilo 2018.79 3275.25 2042.02 2545.67 2489.81 BRS Notável 2237.68 3642.99 2393.05 2860.41 2738.30 Pérola 2108.89 3828.68 2260.29 2647.37 2680.98 IAC Alvorada 1778.94 3377.52 2077.13 2540.45 2468.44 IAC Formoso 2164.08 3421.78 2171.63 2523.28 2568.98 IAC Imperador 1814.63 3089.26 1978.36 2177.50 2326.71 FT-65 2382.84 3529.31 2412.41 2872.46 2750.78 Bola Cheia 2228.06 3656.15 2369.26 2865.37 2735.27
Gol 2067.44 3493.27 2193.49 2362.95 2536.52
Dama 2155.94 3851.21 2335.71 2779.74 2736.02
Black Beans
IPR Tuiuiú 2397.71 3518.21 1677.19 2098.33 2421.36 IPR Uirapuru 2719.73 3607.32 1781.55 2277.54 2573.05 IPR Chopim 2405.95 3532.95 1670.01 2063.02 2417.10 IPR Gralha 2269.43 3428.51 1675.69 2041.10 2360.94 IPR Graúna 2462.84 3475.80 1777.27 2265.28 2484.62 IPR Nhambu 2603.56 3742.36 1874.77 2314.90 2605.68 IAPAR 65 2489.69 3510.64 1730.29 2202.60 2474.15 IAPAR 20 2360.86 3403.28 1515.19 1986.32 2328.38 IAPAR 44 1997.93 3216.58 1337.43 1737.73 2115.28 Rio Negro 2171.80 3296.63 1541.57 1875.35 2245.34 Rio Tibagi 2417.32 3564.95 1572.30 1966.48 2384.15 FT 41 2397.47 3506.19 1775.74 2219.26 2466.61 FT Soberano 2129.43 3320.16 1361.26 1807.52 2187.05 IAC Una 2466.17 3668.85 1745.87 2275.30 2522.84 IAC Diplomata 2359.68 3410.64 1617.68 2017.54 2358.93 BRS Esteio 2532.79 3632.21 1890.90 2281.43 2562.39 BRS Campeiro 2494.76 3582.00 1763.54 2231.71 2504.46 BRS Supremo 2306.42 3518.48 1576.51 1968.79 2351.21 BRS Valente 2507.44 3510.96 1741.28 2041.91 2445.41 1/ Environment 1: Ponta Grossa (rainy 2014/15), Environment 2: Guarapuava (rainy
season-212
2014/15), Environment 3: Ponta Grossa (dry season-2015) and Environment 4: Santa Tereza do Oeste
213
(dry season-2015).
214
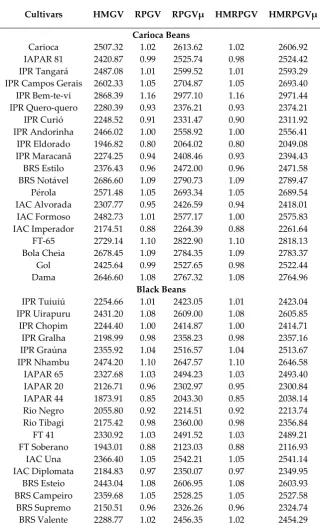
Table 4 Stability of genetic values (HMGV), adaptability of genetic values (RPGV and RPGVμ),
216
stability and adaptability of genetic values (HMRPGV and HMRPGVμ) of carioca and black bean
217
cultivars predicted by BLUP analysis.
218
Cultivars HMGV RPGV RPGVµ HMRPGV HMRPGVµ
Carioca Beans
Carioca 2507.32 1.02 2613.62 1.02 2606.92 IAPAR 81 2420.87 0.99 2525.74 0.98 2524.42 IPR Tangará 2487.08 1.01 2599.52 1.01 2593.29 IPR Campos Gerais 2602.33 1.05 2704.87 1.05 2693.40 IPR Bem-te-vi 2868.39 1.16 2977.10 1.16 2971.44 IPR Quero-quero 2280.39 0.93 2376.21 0.93 2374.21 IPR Curió 2248.52 0.91 2331.47 0.90 2311.92 IPR Andorinha 2466.02 1.00 2558.92 1.00 2556.41 IPR Eldorado 1946.82 0.80 2064.02 0.80 2049.08 IPR Maracanã 2274.25 0.94 2408.46 0.93 2394.43 BRS Estilo 2376.43 0.96 2472.00 0.96 2471.58 BRS Notável 2686.60 1.09 2790.73 1.09 2789.47 Pérola 2571.48 1.05 2693.34 1.05 2689.54 IAC Alvorada 2307.77 0.95 2426.59 0.94 2418.01 IAC Formoso 2482.73 1.01 2577.17 1.00 2575.83 IAC Imperador 2174.51 0.88 2264.39 0.88 2261.64 FT-65 2729.14 1.10 2822.90 1.10 2818.13 Bola Cheia 2678.45 1.09 2784.35 1.09 2783.37 Gol 2425.64 0.99 2527.65 0.98 2522.44 Dama 2646.60 1.08 2767.32 1.08 2764.96
Black Beans
IPR Tuiuiú 2254.66 1.01 2423.05 1.01 2423.04 IPR Uirapuru 2431.20 1.08 2609.00 1.08 2605.85 IPR Chopim 2244.40 1.00 2414.87 1.00 2414.71 IPR Gralha 2198.99 0.98 2358.23 0.98 2357.16 IPR Graúna 2355.92 1.04 2516.57 1.04 2513.67 IPR Nhambu 2474.20 1.10 2647.57 1.10 2646.58 IAPAR 65 2327.68 1.03 2494.23 1.03 2493.40 IAPAR 20 2126.71 0.96 2302.97 0.95 2300.84 IAPAR 44 1873.91 0.85 2043.30 0.85 2038.14 Rio Negro 2055.80 0.92 2214.51 0.92 2213.74 Rio Tibagi 2175.42 0.98 2360.00 0.98 2356.84 FT 41 2330.92 1.03 2491.52 1.03 2489.21 FT Soberano 1943.01 0.88 2123.03 0.88 2116.93 IAC Una 2366.40 1.05 2542.21 1.05 2541.14 IAC Diplomata 2184.83 0.97 2350.07 0.97 2349.95 BRS Esteio 2443.04 1.08 2606.95 1.08 2603.93 BRS Campeiro 2359.68 1.05 2528.25 1.05 2527.58 BRS Supremo 2150.51 0.96 2326.26 0.96 2324.74 BRS Valente 2288.77 1.02 2456.35 1.02 2454.29
The cultivars that stood out in the carioca group were IPR Bem-te-vi, FT-65, BRS Notável, Bola
219
Cheia and Dama (yields from 2,783.37 to 2,971.44 kg ha-1). Among the black-grain cultivars, those
220
with the best performance were IPR Nhambu, IPR Uirapuru, BRS Esteio, IAC Una and BRS Campeiro
221
(yields from 2,773.37 to 2,971.44 kg ha-1). These grain yield values indicate the mean genotypic value,
222
penalized by instability and capitalized by adaptability (HMRPGV). In both experiments, the yield
223
of the best-performing cultivars exceeded the general mean (2,558.52 and 2,409.03 kg ha-1 for the
224
carioca and black groups, respectively).
4. Discussion
227
Common bean is fundamental in the Brazilian agriculture, grown all year long by small, medium
228
and large producers and in diverse farming systems and different climates [9]. Consequently,
229
cultivars with wide adaptation, yield stability as well as a high yielding potential must be developed
230
[10], wherefore germplasm with high variability must be used in the crop breeding programs. For
231
the commercial cultivars investigated in this study, genetic variability was detected by deviance
232
analysis, allowing progress of the breeding programs.
233
According to Resende and Duarte (2007), selective accuracy (Ac) was considered high or very
234
high for most traits, and moderate only for the variables NPP and PLI, respectively, in the carioca
235
and black groups. This is a precision measure based on the correlation between the predicted and
236
true genetic values, and shows the quality of data and procedures used to predict genetic values; the
237
higher the Ac, the greater the reliability of a predicted genetic value [12].
238
Traits with ℎ𝑔2 between ≥ 0.49 and <0.81 are considered high [13], and most of them coincided
239
for both groups (PL, LP, SL, SWth and COEF J), whereas heritability was high for CLI and StL only
240
for the carioca group and for W1000 only for the black group. The traits with high ℎ𝑔2 values had
241
little influence of the GE interaction on the observed phenotypic values. In addition, the correlation
242
between environments (𝑟𝑔𝑙𝑜𝑐) was higher, i.e., these traits are more stable in different environments,
243
mainly influenced by the genotype.
244
The ℎ𝑔2 and 𝑟𝑔𝑙𝑜𝑐 values of the yield-related traits (NPP, NSP, TSW and YLD) were low
245
(<0.25), and moderate only for W1000 [13]. These values coincide with the values reported by other
246
authors, for common bean as well as cowpea, snap bean, and cotton [6,14–16], demonstrating that
247
these traits are strongly influenced by GE interaction.
248
The ℎ𝑔2 values for YLD were equal for both groups, although 𝑟𝑔𝑙𝑜𝑐 of the black group was
249
higher than that of the carioca group. These values can be explained by the fact that the variance in
250
the GE interaction (Vint) was higher in the carioca than the black group (12.7% and 6.8% respectively),
251
i.e., for YLD, the carioca cultivars are more influenced by the environment and therefore less stable
252
than those of the black group.
253
For the carioca group, ℎ𝑔2 was high (0.68) for the trait stem length (StL), and little influenced by
254
the environment (9.7%), different from the black group for this trait (ℎ𝑔2 and Vint of 0.24 and 17%,
255
respectively). These values were probably due to the presence of genotypes with a determinate
256
growth habit among the carioca cultivars. Similar results found in the literature, Kornegay et al. (1992)
257
showed that, in crosses with a at least one of the parents with determinate growth habit, heritability
258
was higher than in crosses between parents with indeterminate growth habit.
259
The correlation between traits is extremely useful in breeding programs, especially when based
260
on predicted genotypic values, unaffected by environmental effects. The correlations for YLD were
261
different in the two commercial groups (Fig. 1). In the black group, the variables correlated with grain
262
yield were related to seed morphology (SL, SWth, STh and W1000), and the seed quantity produced
263
(SP, NPP, NSP and TSW) in the carioca group. However, all correlations with yield-related variables
264
were moderate.
265
One of the main differences between the purpose of common bean breeding programs of the
266
carioca and black groups in Brazil is related to grain traits. Breeding programs for carioca cultivars
267
emphasize grain size, shape and color, selecting plants with large grains, oblong shape and a light
268
beige skin with light brown stripes, according to the preference and acceptance of consumers and
269
producers (Pereira et al. 2017). It is known that cultivars with larger seeds produce less than those
270
with smaller seeds [19]. Therefore, since for the black group there is no demand for large seeds,
271
cultivars with smaller seeds and high yield potential were selected, as demonstrated by the
272
correlations between grain size and yield.
273
In agreement with these results, Cabral et al. (2011) observed a significant phenotypic correlation
274
between the variable yield and the number of pods per plant and number of seeds per plant, while
275
the other variables studied were weakly correlated with grain yield. Likewise, Barili et al. (2011)
276
observed that 1000-grain weight and number of pods per plant are correlated with grain yield.
In the clustering of the carioca cultivars, group I was characterized by cultivars with shorter stem
278
length (StL), for being cultivars with a determinate growth habit, with lowest means for NSP and
279
StTh as well. For group II, the means were lowest in relation to leaf size traits (PLL, PLW, CLL and
280
CLW) while number of seeds per plant (NSP) was highest. For group III, stem length (StL) was
281
longest, higher means for seed size (SL, SWth, STh) and consequently higher means for W1000 and
282
YLD. Three of the cultivars identified as higher-yielding and more adapted and stable in the carioca
283
group, were grouped in group III.
284
The main differentiating traits of the black bean cultivars clustered in group I were a longer
285
mean stem length (StL) and higher insertion height of the first pod (IFP). The seed means (SL, SWth,
286
STh) were the lowest, characterizing this group by smaller seeds than those of the others. This group
287
had the lowest mean YLD, probably because it is formed by ancient cultivars. In group II, no
288
markedly different traits from the others groups were observed. In group III the means for W1000
289
and YLD were highest. With the exception of cultivar IAC Una, the cultivars with improved
290
performance of yield, stability and adaptability were assigned to this group. In group IV, on the other
291
hand, the mean IFP values were lower.
292
With regard to YLD, for the best–preforming cultivars, the predicted means for the
293
environments and the HMRPGV values coincided 92 and 84%, respectively, for the black and carioca
294
groups. In other words, there were small variations in relation to the assessed cultivars and
295
alterations in the ranking among the environments. However, the highlighted cultivars were
296
generally the most productive in the four environments, demonstrating that the efforts of breeding
297
programs invested in adaptability and yield stability in different environments were effective.
298
Other authors reported similar results, reinforcing that this method leads to a refinement of
299
cultivar selection, as well as having the advantage of providing results on the proper measurement
300
scale of the trait [22]. The GE interaction is one of the great challenges for breeders, particularly in the
301
evaluation stages of genotypes for recommendation for producers, since the experiments are carried
302
out at different locations and in different years and growing seasons [23].
303
Owing to breeding efforts, the carioca cultivars developed since 2005 reach higher production
304
levels than the older ones [24]. The cultivars used in this study were generally developed and
305
registered in the last 10 years, except for the cultivars Pérola, Carioca and IAPAR 81 (registered in
306
1998), although, all produced satisfactory yields.
307
The black group accounts for only 17% of the Brazilian production [9], therefore, less breeding
308
efforts are invested than for the carioca group. However, since 1988, significant progress was
309
observed in the genetic gain of black bean cultivars, and cultivars that reach higher yield levels are
310
still being developed [25].
311
Although breeding led to a bottleneck in the genetic base of the species, genetic variability
312
among the cultivars was detected, for both market groups studied. Based on the genetic values
313
predicted for the evaluated traits, free of GE interaction, genetic variability was observed among the
314
cultivars, and the best adapted and most stable in the studied environments were identified.
315
Acknologments: This research was supported by the Parana State’s resource through the Instituto Agronômico
316
do Paraná–IAPAR, and CAPES.
317
References
318
1. Broughton, W. J.; Hernandez, G.; Blair, M.; Beebe, S.; Gepts, P.; Vanderleyden, J. Beans (Phaseolus
319
spp.) - model food legumes. Plant Soil 2003, 252, 55–128, doi:10.1023/A:1024146710611.
320
2. FAO, F. and A. O. FAOSTAT: FAO Statistical Databases.
321
3. CONAB, C. N. D. A. Acompanhamento da safra brasileira de grãos, Safra 2016/2017, 9o Levantamento.
322
4. Ramalho, M. A. P.; Dias, L. A. dos S.; Carvalho, B. L. Contributions of plant breeding in Brazil –
323
progress and perspectives. Crop Breed. Appl. Biotechnol. 2012, S2, 111–120.
324
5. Tsutsumi, C. Y.; Bulegon, L. G.; Piano, J. T. Melhoramento genético do feijoeiro: avanços, perspectivas
325
e novos estudos, no âmbito nacional. Nativ. - Pesqui. Agrárias e Ambient. 2015, 3, 217–223,
326
doi:10.14583/2318-7670.v03n03a12.
327
6. Chiorato, A. F.; Augusto, S.; Carbonell, M.; Antônio, L.; Deon, M.; Resende, V. De Prediction of
328
7. Resende, M. D. V. de Software Selegen-REML / BLUP : a useful tool for plant breeding. Crop Breed.
330
Appl. Biotechnol. 2016, 16, 330–339, doi:http://dx.doi.org/10.1590/1984- 70332016v16n4a49.
331
8. Team, R. C. R: A language and environment for statistical computing. 2017.
332
9. Faria, L. C. de; Melo, P. G. S.; Pereira, H. S.; Wendland, A.; Borges, S. F.; Pereira Filho, I. A.; Diaz, J. L.
333
C.; Calgaro, M.; Melo, L. C. Genetic progress during 22 years of black bean improvement. Euphytica
334
2014, 199, 261–272, doi:10.1007/s10681-014-1135-z.
335
10. Moda-Cirino, V.; Gerage, A. C.; Riede, C. R.; Sera, G. H.; Takahashi, M.; Abbud, N. S.; Nazareno, N. R.
336
X. de; Araújo, P. M. De; Auler, P. M.; Yamaoka, R. S.; Sera, T.; Almeida, W. P. de Plant breeding at
337
Instituto Agronômico do Paraná – IAPAR. Crop Breed. Appl. Biotechnol. 2012, S2, 25–30.
338
11. Resende, M. D. V. de; Duarte, J. B. Precisão e controle de qualidade em experimentos de avaliação de
339
cultivares. Pesqui. Agropecuária Trop. 2007, 37, 182–194, doi:10.5216/pat.v37i3.1867.
340
12. Pimentel, A. J. B.; Guimarães, J. F. R.; de Souza, M. A.; Resende, M. D. V.; Moura, L. M.; de Carvalho
341
Rocha, J. R. do A. S.; Ribeiro, G. Estimação de parâmetros genéticos e predição de valor genético
342
aditivo de trigo utilizando modelos mistos. Pesqui. Agropecu. Bras. 2014, 49, 882–890,
doi:10.1590/S0100-343
204X2014001100007.
344
13. Cargnelutti Filho, A.; Storck, L.; Ribeiro, N. D. Medidas da precisão experimental em ensaios com
345
genótipos de feijão e de soja. Pesqui. Agropecu. Bras. 2009, 44, 1225–1231,
doi:10.1590/S0100-346
204X2009001000003.
347
14. Torres, F. E.; Teodoro, P. E.; Sagrilo, E.; Ceccon, G.; Correa, A. M. Interação genótipo x ambiente em
348
genótipos de feijão-caupi semiprostrado via modelos mistos. 2015, 1–6.
349
15. Carvalho, L. P. De; Farias, J. F. C.; Morello, C. D. L.; Teodoro, P. E. Use of REML/BLUP methodology
350
for selecting cotton genotypes with higher adaptability and productive stability. Bragantia 2016, 1–8,
351
doi:http://dx.doi.org/10.1590/1678-4499.275.
352
16. Sousa, C. M.; Gravina, G. A.; Viana, A. P.; Daher, R. F.; Souza, C. L. Selection of snap bean F 2
353
progenies for production using the REML/ BLUP methodology. Hortic. Bras. 2017, 35, 33–40,
354
doi:http://dx.doi.org/10.1590/S0102-053620170106 Selection.
355
17. Kornegay, J.; White, J. W.; Cruz, O. O. De; Tropical, D. A. Growth habit and gene pool effects on
356
inheritance of yield in common bean. 1992, 171–180.
357
18. Pereira;, H. S.; Alvares, R. C.; Silva, F. de C.; Faria, L. C. de; Melo, L. C. Genetic, environmental and
358
genotype x environment interaction effects on the common bean grain yield and commercial quality.
359
Semin. Ciências Agrárias 2017, 38, 1241–1250, doi:10.5433/1679-0359.2017v38n3p1241.
360
19. White, J. W.; Gonzalez, A. Characterization of the negative association between seed yield and seed
361
size among genotypes of common bean. F. Crop. Res. 1990, 23, 159–173.
362
20. Cabral, P. D. S.; Soares, T. C. B.; Lima, A. B. P.; Soares, Y. J. B.; Silva, J. A. da Análise de trilha do
363
rendimento de grãos de feijoeiro (Phaseolus vulgaris L.) e seus componentes. Ciência Rural 2011, 42,
364
132–138.
365
21. Barili, L. D.; Do Vale, N. M.; Morais, P. P. P.; Da Cruz Baldissera, J. N.; De Almeida, C. B.; Da Rocha, F.;
366
Valentini, G.; Bertoldo, J. G.; Coimbra, J. L. M.; Guidolin, A. F. Correlação fenotípica entre
367
componentes do rendimento de grãos de feijão comum (Phaseolus vulgaris L.). Semin. Agrar. 2011, 32,
368
1263–1274, doi:10.5433/1679-0359.2011v32n4p1263.
369
22. Carbonell, S. A. M.; Chiorato, A. F.; Resende, M. D. V. de; Dias, L. A. dos S.; Beraldo, A. L. A.; Perina,
370
E. F. Stability of common bean cultivars and lines in different environments in the state of São Paulo.
371
Bragantia 2007, 66, 193–201, doi:10.1590/S0006-87052007000200003.
372
23. Peixouto, L. S.; Nunes, J. A. R.; Furtado, D. F. Factor analysis applied to the G + GE matrix via REML /
373
BLUP for. 2016, 1–6.
374
24. Barili, L. D.; Vale, N. M. do; Prado, A. L. do; Carneiro, J. E. de S.; Silva, F. F. e; Nascimento, M.
375
Genotype-environment interaction in common bean cultivars with carioca grain, recommended for
376
cultivation in Brazil in the last 40 years. Crop Breed. Appl. Biotechnol. 2015, 15, 244–250,
doi:10.1590/1984-377
70332015v15n4a41.
378
25. Barili, L. D.; Vale, N. M. do; Carneiro, J. E. de S.; Silva, F. F. e; Silva, F. L. da Five decades of black
379
common bean genetic breeding in Brazil. Pesqui. Agropecuária Trop. 2016, 46, 259–266,
380
doi:http://dx.doi.org/10.1590/1983-40632016v4641371.