University of South Carolina
Scholar Commons
Theses and Dissertations
2015
Middle School Students' Perceptions of Fairness
and Trust in Assessment Scenarios
Corinne Elaine Jimenez
University of South Carolina
Follow this and additional works at:https://scholarcommons.sc.edu/etd
Part of theEducational Psychology Commons
This Open Access Dissertation is brought to you by Scholar Commons. It has been accepted for inclusion in Theses and Dissertations by an authorized administrator of Scholar Commons. For more information, please [email protected].
Recommended Citation
Middle School Students' Perceptions of Fairness and Trust in Assessment Scenarios
By Corinne Elaine Jimenez
Bachelor of Arts
State University of New York at Binghamton, 1994
Master of Arts in Teaching University of South Carolina, 1996
Master of Education
University of South Carolina, 2000
Submitted in Partial Fulfillment of the Requirements
For the Degree of Doctor of Philosophy in
Educational Psychology and Research
College of Education
University of South Carolina
2015
Accepted by:
Robert L. Johnson, Major Professor
Xiaofeng Liu, Committee Member
Tammie Dickenson, Committee Member
John Arnold, Committee Member
ii
Dedication
To the two people who hold my heart and
made pursuing my dreams possible.
iii
Acknowledgements
I was the first in my mother’s family to graduate college. I am the first in
her family to earn a doctorate. But neither would be possible without my
mother’s consistent expectation of nothing less than greatness. Thank you for
being my first teacher and forever cheerleader.
My father, to whom I am a princess, taught me life isn’t always fair, but
you move past it. Maybe that is why I chose a topic that explores students’
sense of fairness, to help make life just a little more fair and to honor him.
Margaret Hicks has been my friend and colleague for at least a decade.
Without her sending me articles and pushing me professionally, I would still be
deciding on a topic. She has been an editor, a sounding board, and a shoulder
to lean on throughout the process.
Robert Johnson is the reason I am a doctor of philosophy. His
unwavering support of my passion to improve classroom assessment practices
has been instrumental in my academic and professional career.
John Arnold has been the best colleague any person could ask for. I have
been able to share with him my frustrations and worries, and he is always there
iv
Abstract
Fairness in assessment practices is an elusive concept which has been
explored in some detail at the university level, but rarely with students in middle
school. This study examines students’ perceptions of fairness on nine classroom
assessment practices. It also studies if students’ perceptions of fairness, as well
as student gender, could predict their levels of trust. Students were able to
discern fair practices, as defined by alignment to best assessment practice
literature, from unfair practices for most scenarios. They were more inclined to
recognize interactional fairness deviations or promotions. The student’s ability to
identify a fair or unfair situation did predict the level of trust they would have in
a teacher, though the student’s gender did not. Recommendations include
teachers being more cognizant of their assessment practices and how they will
v
Table of Contents
Dedication ... ii
Acknowledgements ... iii
Abstract ... iv
List of Tables ... vii
List of Figures ... viii
Chapter One Introduction ... 1
Hypotheses... 7
Generalizations and Limitations ... 8
Chapter Two Literature Review ... 10
Introduction... 10
Fairness and Ethics ... 11
Fairness in Education ... 13
Fairness, Trust and Teacher Effectiveness ... 17
Student Perception of Assessment Techniques ... 19
Assessment Practice Literature... 21
Developing the Survey Instrument ... 26
vi
Chapter Three Method ... 29
Measures ... 29
Samples ... 32
Data Analysis ... 34
Procedures ... 38
Chapter Four Data Analyses and Major Findings ... 41
Qualitative Results from Surveys and Focus Groups ... 41
Survey Results ... 45
Psychometric Qualities for Fairness Questions ... 45
Hypothesis Testing: Fairness Perceptions ... 52
Psychometric Qualities for Trust Questions ... 53
Hypothesis Testing: Trust Perceptions ... 56
Chapter Five Discussion and Conclusion ... 62
Summary of the Study... 62
Discussion of Results ... 63
Implications of Results and Limitations ... 65
Recommendations... 66
Implications for Future Research ... 67
Conclusion ... 70
References ... 71
Appendix A-Focus Group Script and Questions ... 81
vii
List of Tables
Table 3.1 Table of Test Specifications for the Survey ... 29
Table 3.2 Seventh Grade Demographics Data in Percent
from District’s Middle Schools ... 32
Table 4.1 Focus Group Demographics ... 40
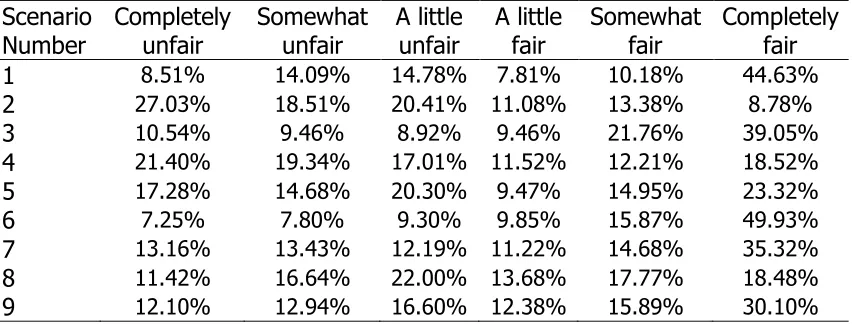
Table 4.2 Student Perceptions of Fairness Results
Shown as a Percentage ... 44
Table 4.3 Student Perception of Fairness for Each Scenario (FAC) ... 47
Table 4.4 Discrimination Indices for Fairness Items on
Assessment Scenarios Survey ... 48
Table 4.5 Exploratory Factor Analysis Structure Matrix ... 51
Table 4.6 Discrimination Indices for Trust Items on
Assessment Scenarios Survey ... 53
Table 4.7 Student Perceptions of Trust Results
Shown as a Percentage ... 54
Table 4.8 Means and Standard Deviations for
Fairness Total Scores and Trust Total Scores ... 56
Table 4.9 Multiple Regression Coefficient Table with Trust Total as
viii
List of Figures
Figure 2.1. Rodabaugh and Kravitz’s types of fairness ... 14
Figure 3.1 Sample survey scenario and questions ... 30
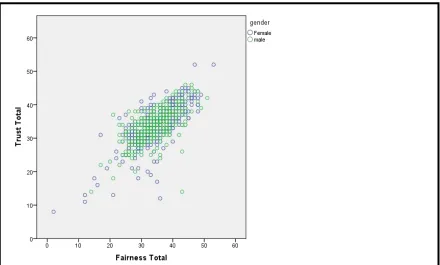
Figure 4.1 Scatterplot of fairness and trust scores
differentiated by gender... 57
Figure 4.2 Scatterplot for test of homoscedasticity ... 58
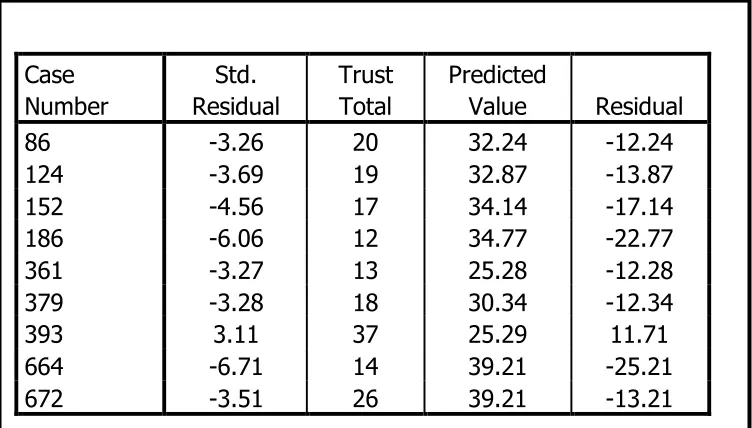
Figure 4.3. Casewise diagnostics results from
multiple regression analysis ... 59
Figure 4.4. Histogram of regression standardized residuals using the
1
Chapter One
Introduction
Fairness is an elusive concept. Yet, for most, it is an ideal that guides
their interactions with individuals, groups, and institutions (Tyler, Boekmann,
Smith, & Huo, 1997). Students have an opportunity to experience fairness, or
unfairness, daily. In one day, a teacher, group of peers, and school policy might
be judged based on a student’s sense of fairness. Vieno, Perkins, Smith, &
Santinello (2005) found that schools in which students felt the teachers acted
fairly and the rules were applied fairly had a higher sense of community.
Standardized testing often comes to mind for the general public in terms
of fairness. The concept behind standardized tests is to allow all students a
similar opportunity to show their achievement on a given set of objectives.
However, due to issues with accessibility to the test or content and universal
design of the test, sometimes these standardized examinations are considered
unfair (American Educational Research Association, 2014). In the most recent
Standards for Educational and Psychological Testing, the American Educational
Research Association devotes an entire chapter to fairness in standardized
testing, calling fairness an “overriding, foundational concern” (p. 49). The
results of these standardized tests are then used for various decisions: retention,
2
can make a dramatic impact on a student’s future, research studies began to
look at the ethics of teacher actions in terms of standardized test preparation
(Mehrens & Kaminski, 1989).
However, standardized tests are only given at limited times in a students’
career. Classroom assessment and grading often are considered when one
speaks of unfair actions at the school level. Also, assessment and evaluation are
of great importance when designing curriculum. Martone and Sireci (2009)
studied assessment as part of curricular design and found an important
component of effectiveness was the “teachers need to understand the value of
the assessments, how the assessments relate to what they should be teaching,
and how to make changes in their approach based on the results they see” (p.
1356).
Assessment is not always a separate part of the daily lesson. Tierney
(2014) described formative assessment as the feedback teachers give to
students as the teacher is instructing and questioning, with the results of those
interactions being used to inform instruction. Tierney goes on to explain
summative assessment is used to “report on achievement” (p. 55).
Assessment, be it formative or summative, is the means to judge how well
a student understands the taught concepts. Thus, effective teachers must
assess well, but they must also be fair in their assessment practices. The use of
best practices in assessment and grading may be one way to address this issue
3
Many experts have studied the concept of best practices in assessment
and grading. However, as standards-based instruction has become the norm in
the United States, assessment practices have not quite kept up. As Guskey
(2009) stated, “of all aspects of our educational system, none seems more
impervious to change than grading” (p. 2). Various researchers have
recommended assessment policies including not using zeros in grading (Carifo &
Carey, 2009; Guskey, 2009; Wormeli, 2006) and only using a student’s
demonstrated ability, as opposed to effort and growth, in reporting achievement
(Edwards, 2000; Guskey, 2009; Stanley & Baines, 2004). Yet, teacher’s
individual grading practices widely vary and often stray from the best practice
assessment literature. For example, Tierney, Simon and Charland (2011) found
teachers will often knowingly abandon their pedagogical knowledge in order to
maintain, what they esteem to be, a fair grading environment. However, these
“fair” practices “may have included a host of unexamined assumptions” (p. 224),
such as assessing students in a lower track on a set of non-grade level content
standards merely because they were in the low group, not because of individual
need or performance. This form of bias undermines a key aspect of fairness
(McMillan, 2004). This is one example of the confusion that surrounds the
claim by teachers and administrators of fair and accurate assessments of student
achievement.
This line of reasoning leads back to the initial concept that fairness is an
4
vary. However, teachers are just one part of the educational equation. The
students who educators serve are the clients. One might argue, if students find
the assessments and subsequent grading practices to be unfair, their purpose of
providing valuable and accurate feedback to the student for further growth might
become obsolete. In describing attribution theory, Carifio and Carey (2009)
explained “grading practices must be perceived as reliable and predictable if they
are to have the intended and desired effect” (p. 29). Hence, it might follow that
if students do not find the teacher’s assessment policy and procedures to be fair
because they are not reliable nor predictable, they might not perform in a true
form. In terms of classical test theory, the observed score on the test or project
might be heavily influenced not by the student’s true score, but by the error
associated with the student’s sense of unfairness. Thus, assessments would not
give the teacher a realistic picture of what the student knows, and would not
allow for meaningful reflection on how to change instruction to meet the needs
of the child. This logical progression might apply to all stages of the assessment
and grading procedures: from formative to summative assessment, and in terms
of overall course or subject evaluation.
Trust is another elusive concept which might relate to fairness. If trust is
the “firm belief in the reliability, truth, ability or strength of someone or
something” (Oxford Dictionaries, 2015), it would seem a teacher who acts in a
fair manner, a reliable and truthful manner, would foster trust in his or her
5
Some research has been conducted on the importance of trust in schools.
In their report on school climate, Thapa, Cohen, Hiffins-D’Allessando, and Guffey
(2012) found “a positive school climate promotes cooperative learning, group
cohesion, respect, and mutual trust” (p. 7). These researchers discussed many
forms of mutual trust: parent-teacher, teacher-administrator, school
level-district-level, teacher-teacher, and more. However, specific practices which build
or derailed trust were not investigated, nor was the relationship between fairness
and trust.
Bryk & Schneider (2004) used case studies to build a four system model
for an effective school. They believed professional capacity, order and safety,
parent-school ties, and instructional guidance were all essential and were all tied
together by the various stakeholders trusting each other. While they did report
fair discipline and classroom management practices were important to creating
and maintaining trust, they did not report on any relationship between fairness
and trust in terms of assessment practices.
How do students view different assessment practices in terms of fairness?
Does their perception of fairness impact their trust in the teacher? In the past,
researchers have studied the perceptions of college students and their
professors’ grading policies and feedback mechanisms (Gordon & Fay, 2010;
Holmes & Smith, 2005). Other researchers have investigated middle school
students’ preferences for different assessment techniques (James, Griffin, &
6
students’ insights about the fairness of different common assessment practices
are limited.
To understand more about how students view assessment and grading in
terms of fairness, the following research questions were investigated:
Do students’ perceptions of fairness in an assessment scenario differ
based on the characteristics of the scenario? More precisely, do students
perceive assessment practices that promote best practice as fair, and
those that deviate from best practice as unfair?
Then, in order to examine the possible relationship between fairness and trust,
the following secondary research question was asked:
To what extent does a student’s perception of fairness and the student’s
gender predict his or her perception of change in trust toward the
teacher? In other words, if a teacher acts in a perceived fair way, does
the student’s trust in that teacher increase? Or, if a teacher acts in a
perceived unfair manner, does the student’s trust in that teacher
decrease? Does student gender aid in this prediction?
To answer these research questions in the proposed study, different
fictional scenarios were developed, some of which were written in accordance to
best assessment and grading practice and some of which deviate from said
practice. These scenarios also represent different types of fairness, which will be
7
scenarios from middle school students, the study examined the differences in
perceived fairness scores based on the situation’s fairness type.
In order to study the second research question, this investigation
examined the relationship between students’ views on the fairness of a scenario,
student gender, and the change in trust they would have if their teacher should
act in such a way as described in the setting. In other words, to what extent did
a student’s perception of fairness of an assessment circumstance and a student’s
gender predict his or her perception of change in trust toward the teacher that
circumstance would bring about?
In addressing these questions, the study provided information about how
middle school students perceived different assessment and grading scenarios in
terms of fairness. It also offered insight into how fairness and trust are related.
Study findings might suggest teachers need to consider student views on
common assessment and grading practices, especially if those practices are
found to be considered unfair and degrade the trust a student has in the
teacher.
Hypotheses
There were two foci of this study. First, the study examined the
differences between fairness scores based on characteristics of the assessment
scenario. Secondly, it investigated the possible relationship between fairness
scores, gender, and change in teacher trust of student. The guiding theoretical
8
of a teacher’s fairness can be changed by a teacher’s assessment practices, and
that when a teacher acts unfairly, trust in that teacher is diminished. This model
also assumed that the best practices of assessment, as described by various
assessment experts, are fair. Hence, if a teacher does not follow best practice,
that instructor is acting in an unfair manner. Therefore, one working hypothesis
was there will be a difference in fairness perception scores, based on the
underlying best practice characteristic of the scenario. The second working
hypothesis was that as a fairness perception score increases, so will the student’s
trust in a teacher. There will be a strong, positive relationship between
perception of fairness and change of trust in teacher. This hypothesis stemmed
from the assumption that students trust a teacher based on his or her actions,
including actions involving grading and assessments. Actions that are considered
unfair will derail that trust; actions that are fair will build that trust. Also, gender
will not be a significant regression factor in predicting a student’s change in trust.
Generalization and Limitations
These findings might not be appropriate to generalize to elementary or
high school situations given the unique transitional nature of traditional middle
school. Middle school students change greatly from their sixth grade to their
eighth grade years, becoming less immature and more like young adults. Also,
the developmental level of elementary school students might limit the
applicability of the findings, as they are less likely to question a teacher’s
9
developmental stage that demands more independent thinking, which results in
questioning most authority figure’s judgment, not based on merit but based on
the fact that it came from an authority figure (Christine & Viner, 2005).
These data are from one suburban school district with an average
(mid-point) poverty indicator (49% free and reduced lunch). However, this district is
in the 93rd percentile in terms of wealth, as measured by the state’s poverty
index (South Carolina Department of Education, 2014). Hence, care should be
taken when attempting to generalize these data to other settings.
Given the large sample size and use of an instrument based on widely
accepted best assessment practices, the research might be generalized to other
similar populations. It is also reasonable that the findings might be generalized
to other subjects not covered in the scenarios, such as physical education and
art, as the assessment best practices could be imagined in every type of class
10
Chapter Two
Literature Review
The following sections provide a review of the literature for fairness in
terms of the educational environment; the relationship between fairness, trust,
and teacher effectiveness; and the potential for differences between teacher and
student perception. Fairness will be described in relationship to ethics, as a
construct, as perceived in a classroom, and as viewed through educational
assessment measurements. The link between fairness and trust will be explored,
as well as the connection between trust and teacher effectiveness. Finally,
perception itself and the nature of perception being different based on one’s role
will be discussed.
Introduction
A teacher’s responsibility, at the macro level, is to help create a more
informed student population which will lead to a better citizenry. However, at
the micro level, a teacher’s purpose is to serve the individual student (Sloan,
2012). To serve a student, a teacher must be competent. One quality that a
teacher must possess to be considered competent is credibility (Brookfield,
2006). Students must believe in the teacher and trust the teacher, in content
and action. Whitley, Perkins, Balogh, Keith-Spiegel, and Wittig (2000) reasoned
11
the student and teacher. Teachers who are perceived as less fair can be trusted
less by students. This reasoning seems sound; however, the assessment
literature contains little research into actual student perceptions of fairness.
To follow the reasoning of Brookfield in terms of credibility (2006), this
study first examined if students feel a practice is fair or unfair. Then, it
measured to what extent the students’ perception of the fairness of a practice
affects the trust the student has for the teacher. In Rodabaugh’s (1996)
research on fairness, she identified actions which could be considered unfair by
college level students. Most of these actions are associated with either formative
or summative assessment. Examples of fair practices include assessments that
align to objectives and instruction and grading procedures that reflect student
mastery. This study focused on middle school level students’ perceptions of
teacher’s fairness in assessment-based scenarios.
Fairness and Ethics
The concept of fairness and the concept of ethics have shared tenets, but
the two concepts are not the same. Velasquez, Andre, Shanks, and Meyer
(1996) framed acting ethically as the decision to act morally. They described five
approaches to help a person make an ethical and moral decision. One of these
approaches is the fairness or justice approach (Velasquez, Andre, Shanks, &
Meyer, 1996, para. 10). Using the fairness approach, any action is considered
12
discrimination” (Velasquez, Andre, Shanks, and Meyer, 1996, para. 10). Other
authors agree that fairness is a dimension of ethics. In the Journal of Academic
and Business Ethics, Stranahan, J. Borg, and Borg (2009) discussed the concept
of grading schools using standardized tests. Their paper discussed the possibility
of schools’ accountability grades being lowered based on the types of students it
serves, and argued this was unfair. This concept is consistent with Velasquez,
Andre, Shanks, and Meyer’s definition of the fairness approach to an ethical
decision. Green, Johnson, Kim and Pope (2007) also used the concept of
fairness as a dimension of ethics in their paper “Ethics in the classroom
practices: Issues and attitudes.” The paper discussed the concept of Do No
Harm (Green, Johnson, Kim & Pope, 2007) as a guiding ethical principle. They
presented the idea that teachers not acting fairly may violate this ethical
principle:
Fairness (or protection of student rights) is a general principle that no one
contests in the abstract. However, thinking about causing harm focuses
the discussion at the level of the implications of everyday practice.
Educators must be well versed in the potential impact of the practices
they use because their assessment and evaluation may have a variety of
unintended consequences for their students. (p. 1001)
Thus, for the remainder of this study, the concept of fairness as a dimension of
13
Fairness in Education
When a student is at school, his or her teachers are considered to be “in
loco parentis,” (Popham, 1991). In other words, the teacher acts as the child’s
parents in the student’s best interest. Therefore, it follows that it is a teacher’s
responsibility to act as a parent by protecting the students’ rights. Green,
Johnson, Kim and Pope (2007) wrote that “fairness (or the protection of
students’ rights) as a general principle no one contests in the abstract” (p. 1001).
When fairness is considered a right, it should be guaranteed, much as United
States’ citizens are guaranteed certain rights through the Constitution. Along
these lines, Rodabaugh (1996) argued fairness should be institutionalized in
classrooms. By doing so, teachers will be guaranteeing the rights of their
students, as is their responsibility.
Based on their studies at the university level, Rodabaugh and Kravitz
(1994) divided fairness into three categories: interactional fairness, outcome
fairness, and procedural fairness. Figure 2.1 presents a definition for each type
of fairness and provides examples of each.
The strength of the link between fairness and assessment is reflected in
analyzing the three types of fairness. A majority of the examples offered by
Rodabaugh and Kravitz (1994) are associated with assessments and evaluation.
Procedural fairness almost completely describes assessments, with the exception
of attendance, while outcome fairness is entirely focused on assessment and
14
students emphasize fairness in describing good assessment and evaluation
practices.
Type of
Fairness Definition Examples of Fair Behavior
Interactional
fairness The relationship between the students and their professors
Showing no partiality to some students on the basis of gender, race, or age;
Not being “angry” or “mean” in class (including using profanity, yelling, or screaming);
Not embarrassing students in the classroom, especially by using sarcasm and put-downs;
Exhibiting a caring attitude toward students;
Responding to student questions Procedural
fairness The rules and regulations that are employed to
determine grades, and the policies regarding
attendance, make-up tests,
cheating and
plagiarism, and other student performance
Rules and regulations related to the classroom to be fair to all students, without exceptions
Tests to be fair and to measure accurately what they have been asked to learn, without trick questions or vague references.
Tests returned promptly and discussed in class, the answers explained, and time allotted for questions.
Monitoring and regulation of cheating and plagiarism. Outcome
fairness The distribution of grades Grades fairly reflect student mastery of the class topics as demonstrated by test scores or the completion of other course requirements.
Individual accomplishments should count toward their final grades, as opposed to group
accomplishments
15
In terms of assessment, fairness can be characterized in many ways.
Carlson (2003) stated “effective grading practice relies on equitable and
appropriate evaluation” (p. 511). So what makes an assessment practice
equitable and appropriate? Thinking about an assessment from its inception, the
first characteristic would be alignment to instruction. In Wren et al.’s study, they
found “there was a high expectation that the assessments set would be closely
aligned with the taught elements of the course (2009, p. 14).” The alignment of
assessments and instruction is also described as a fair practice by Hill and
Zinsmeister (2012) as they described an ethical college professor as being
“cognizant of assessments that do not match course objectives” (p. 129).
Second in the cycle of creating an assessment is its design. This may
mean avoidance of unfairness in terms of questions being demeaning to any one
gender, race, age, or sexual orientation (Rodabaugh, 1996.) Kuhs, Johnson,
Agruso, and Monrad (2001) have a broader definition of fairness: “Assessments
should be designed to measure the skill(s) of interest and not be affected by the
individual differences of students” (p. 5). This includes a person’s race, ethnicity,
gender, sexual orientation but also includes the background knowledge a student
needs to be able to have an equal chance of performing an assessment well.
One example Kuhs et al. gave was a question asking about travel to Europe;
they proposed this question may not be fair for a low socio-economic child who
16
An assessment may also be unfair on the basis of unclear directions,
questions, or rubric descriptors (Wren et al., 2009). Sadler (1989) researched
the relationship between classroom assessment and teacher expectations. He
found students needed to understand the standards used to appraise their work.
Thus, for an assessment to be considered fair, the instrument needs to be free
from vague wording and easily misinterpreted language. Ideally, the assessment
instrument should either be reviewed with the students or made in collaboration
with the students. Ross, Rolheiser, and Hogaboam-Gray (2010) found support
for this principle when they worked with students to develop a set of
performance tasks to appraise students’ learning. Then, the instructors and the
students both evaluated the students’ work after a project using these
collaborative assessments. Most students believed that this system “fairly
appraised their work” (p.88).
Fairness may also be exhibited in the grading of student work. Holmes
and Smith (2003) stated that “students should know from the outset that the
grading criteria are the same for all students (p. 319).” This may mean all
students, regardless of race, gender, sexual orientation or it may mean
regardless of socio-economic status, degree of friendliness, or many other
behavioral aspects that have been included in grading by teachers (Marzano,
2000). When a grade or evaluation is changed because of factors that do not
17
homework completion, class contributions), the grade is considered polluted
(Pope, Green, Johnson & Mitchell, 2009).
False praise may also be considered a form of score pollution. Cameron
and Pierce (1994) found students reported greater satisfaction toward a teacher
when that teacher had given feedback to the student which was explicitly linked
to the quality of the performance, and not to the effort given. In terms of
feedback, students in Rodabaugh’s study also described prompt feedback as a
component to a fair assessment (1996).
Fairness, Trust, and Teacher Effectiveness
As shown in Figure 2.1, Rodabaugh and Kravitz (1994) described one
component of fairness as interactional. It is the relationship between the
instructor and the students, and whether that relationship is the same for all
students. Instructors must be “equally concerned about all students in their
classrooms without showing any partiality when answering their questions, when
giving them assistance, and when responding through body language or
otherwise” (Rodabaugh, 1996, p. 40).
Although many people think of assessment as a written form of
communication; however, assessment in the form of feedback can also be given
orally or through demeanor. Personal communication can lead to immediate
insight about student learning, but needs to have clear learning objectives and
judgment criteria identified for it to be effective (“Assessment Methods: A Set of
18
However, fairness is not perceived solely through the instructor’s actions,
but also through the assessments he or she designs and uses. In a study of
seventh graders, Wang and Holcolme (2010) found that “teachers can best
promote students’ positive identification with school and stimulate their
willingness to participate in their tasks by offering positive and
improvement-based praise.” Teachers who used assessments as opportunities for constructive
feedback maintained a level of engagement with their students which led to
student satisfaction of the school environment. However, the converse may be
true as well. As Green et al. stated, “teacher–student trust can be damaged by
assessments that the student perceives as unfair or unfounded” (2007, p. 1009).
A teacher who uses surprise items on a test that did not appear on the study
guide is an example from the Green et al. study. They believe this action may
do “harm by breaking the implicit bond of trust between teacher and student”
(2007, p. 1001). However, there is no research which tests this theory. Can
unfair assessment practices diminish the trust a student has in a teacher?
In order for a teacher to be most effective, that teacher must foster a
trusting relationship with his or her students. In his studies on skillful teaching,
Brookfield (1990) found a “teacher’s actions, and the trust these inspire or
destroy, are crucial to learning” (p. 163). Educators must be well versed in the
potential impact of the practices they use because their assessment and
evaluation may have a variety of unintended consequences for their students
19
Researchers have found middle school students who perceived their
teachers “cared” were more likely to be motivated to succeed (Wentzel, 1998).
These same caring teachers were identified as those who acted in what
Rodabaugh would call a fair way: they showed interactional fairness through
democratic principles, procedural fairness through developing expectations for
student behavior despite individual differences, and outcome fairness by
providing constructive feedback (Wentzel, 1997).
In terms of student demographics and trust, many studies have found
females tend to have more of a relationship with their teachers compared to
males. In contrast, males typically have more conflict and less closeness in their
relationships with teachers than females (Baker, 2006; Howes et al., 2000;
Hughes, Cavell, & Wilson, 2001). However, these studies were all based on
students in pre-school through sixth grade. Therefore, this study will attempt to
provide or more complete picture of the gender and trust relationship by using
the student’s gender as a factor during analysis.
Student Perception of Assessment Techniques
In designing classroom environment that is fair, including the evaluation
procedures and assessment measures, the teacher’s perspective may differ from
the students’ perspective. The teacher may believe he or she has created an
interactional, procedural, and outcome fair curriculum, but his or her students
may not share that perception. Brookhart and DeVoge (1999) described the
20
the actions of the teacher but also the meaning the students derive from those
actions.
Many studies show the difference between student perceptions and
teacher perceptions of a shared reality. In Gulikers, Bastiaens, Kirschner and
Kester (2014), the researchers discovered both freshmen and senior high school
students had a different idea of the degree of authenticity in an assessment task
than their teachers. When looking at the same assessment tasks, teachers
believed the task, method, and criteria of the individual assessments were more
authentic than the students did. The students’ perceptions were similar, but
different from the teachers’ view.
Therefore, investigation of student perceptions on fairness would be a
logical next step. In this line of research, Gordon and Fay (2010) examined
several hundred college students’ perceptions of fairness in their evaluative
systems. They found that college students believed interactional fairness (the
instruction given in class) to be more important than outcome fairness (how
teachers used assessment to create the course grade).
In another study of student perceptions, Alkharusi (2010) examined ninth
grade student self-efficacy. He examined the perceived assessment environment
of these high school freshmen, one in which assessments were challenging,
clear, and provided detailed feedback versus classrooms in which assessments
were difficult, feedback was in the form of a grade, and assessments were used
21
learning-oriented and harsh-oriented, respectively. However, at the conclusion
of his study, he found a limitation: it made an omnibus categorization of
classroom as either learning-oriented or harsh-oriented. He continued in saying,
this might have made it difficult to know which aspects of the recommended
“classroom assessment practices could be considered responsible for the
observed effects detected in the study” (p. 38).
Assessment Practice Literature
In order to measure students’ perceptions of fairness, the students need
to have plausible scenarios on which to base their opinions. In development of
surveys, an initial step is to investigate the literature on best practice in
assessment in order to create scenarios which are both aligned with Rodabaugh’s
types of fairness and reflect best assessment practices. The following sections
describe the results of that best practice investigation.
Grading formative assessment.
Formative assessment is described by Stiggins (2008) as assessment for
learning. In other words, teachers use formative assessment to diagnose their
day to day instruction, both to gather data on how effective the lesson was, but
also to analyze which students might need further help. Formative assessment is
a time when students should be allowed to make mistakes, so the teacher might
discover misconceptions early and address them. Referring to formative
assessments, Stiggins stated, “These have no place in the gradebook,” (2008, p.
22
graded, but elaborate as to why this concept is difficult for teachers to accept:
“Many teachers…believe that students will not take the work seriously unless it is
graded” (2010, p. 111). Thus, student achievement is often measured using a
grade before any substantive feedback is given to the students and before any
teacher guided practice is provided.
Using student achievement measures to change behaviors.
One of the goals of the educational system is to develop students who
will contribute to a democratic society in a positive way as they become adults
(Green & Johnson, 2010). Thus, many teachers argue that they must teach
non-academic factors such as participation, following directions, punctuality of
assignments, effort, attendance, work habits and neatness, and attitude
(Guskey, 2009). Assessment experts agree that these factors are important to
educating the whole child, but feel they could assign these as separate grades,
what Guskey calls “process grades” (2009, p. 21).
However, many teachers are hesitant to separate those factors because
they are used to change behavior, either as a reward or a punishment.
“Teachers perceive non-achievement factors such as effort, behavior and
attendance as important to classroom control, and consequently, often include
them in their grading practices” (Marzano, 2000, p. 37). For example, McMillan,
Myran and Workman (2002) provided an example where rewarding effort might
lead students “who are not competent…to believe that they demonstrated
23
might think the child might not try, which makes learning more difficult. On the
punishment side, many teachers take away points for work being turned in late.
Thus, a student who might completely understand the concepts, but is
disorganized, might appear to not have mastered the learning objectives. These
type of measurement practices affect validity. As Green, Johnson, Kim and Pope
(2007) described the problem: “the score on the test does not represent actual
student achievement in the content area and is ‘polluted’ by factors unrelated to
academic attainment” (p. 1001).
Using zeros in measuring student achievement.
In mathematics, a zero represents the concept of nothing. When we
consider student achievement after appropriate instruction, it is a rare instance
for a student to have learned nothing (Raebeck, 1993). Most often, zeros are
used as punishment for what the teacher perceives as a lack of responsibility
(Guskey, 2009) because it reflects missing work. It is mathematically correct:
there is no work, so it is a zero. However, in terms of that zero representing
student achievement, it rarely leads to a valid conclusion.
Also in terms of mathematics, a zero has an “undeserved and devastating
influence” (Guskey, 2009, p. 137) on a student’s grade. A zero creates a much
larger interval between a D and an F, compared to the other grade intervals. For
example, in South Carolina, the distance between a zero and a D is 70 points,
whereas the distance from a D to a C (and all subsequent sequential letter
24
“mathematically and ethically is unacceptable” (p. 138). Given that strong
wording, the current study will include inquiry into student perceptions on the
use of zeros.
Using any type of assessment exclusively.
As students progress to middle school, their instruction turns from an
integrated model (where they typically had one or two teachers to deliver the
four major subjects) to a content specific model (where they have four teachers
each of whom specializes in one of the four major subjects.) This shift causes
teachers to become content experts. As content experts, middle school teachers
also tend to assess students in more rigid ways that conform to their content.
For example, math is a subject that is easily assessed in many ways through
selected response assessments, such as multiple choice or true/false questions.
Writing, however, is most easily assessed through performance tasks. However,
as Gronlund (2006) discussed, “effective assessment requires that a variety of
assessment procedures be used” (p. 19). By using a myriad of assessment
types, a teacher is increasing the validity of his/her instructional decisions.
Wormeli described this idea: “When we assess students through more than one
format, we see different sides to their understanding” (2006, p. 31). Thus, a
survey on assessment and fair practices should include questions about the use
25
Evaluating non-content area standards with content standards.
A grade is a means to measuring “how well a set of instructional
objectives have been achieved” (Gronlund, 2006, p. 169). In the instructional
process, many advocates of assessment recommend a backwards model, in
which teachers identify the learning outcomes (i.e., objectives), decide how
those assessments can be most effectively assessed, and then create the
instruction that will help guide the students to success on the assessment
(Wiggins & McTighe, 1998). Thus, the assessments and the learning objectives
are closely aligned. However, this ideal situation does not always occur. At
times, teachers will create or use assessments which are meant to measure one
objective, but require mastery of a different content area. For example, a
student might understand and be able to show mastery on the aspects of the
French Revolution, but cannot read the test. Thus, the child receives a poor
grade on the social studies test, but that poor grade truly indicates a deficit in
reading, not social studies. Similarly, one content area assessment might
measure its content objectives, but also include non-content objectives that
seem relevant. One instance might be a science project which requires writing.
The teacher might have a rubric which is measuring the various science
concepts, but that same rubric might also include non-science content such as
handwriting, spelling and punctuation. When this occurs, the science grade
becomes a writing assessment. Assessments should illuminate, not obfuscate,
26
(Wormeli, 2006). This a scenario that depicts the muddling of content areas will
be included on the survey.
Developing the Survey Instrument
In this study, a Likert question followed each scenario to measure the
students’ perceptions of fairness. The researcher decided to use six-point
response categories for several reasons. First, the researcher wanted to use an
even number of responses to avoid a neutral response. Odd number responses
allow for a middle point, which might prevent this researcher from discriminating
between those students who perceived a scenario as fair or unfair and those
scenarios which build or undermine trust (Johnson & Morgan, in press). Also,
six-response categories were used to increase reliability and validity. In their
study on the optimal number of response categories, Preston and Colman (2000)
found reliability as measured by Cronbach alpha coefficients increased as the
number of responses increased; but after seven responses, the coefficients did
not increase at a statistically significant level. They also reported that validity
and ability to discriminate between respondent choice increased as the number
of response categories increased. Thus, six-point response categories were used
as this format supports validity and reliability with an even number of possible
responses.
Additional consideration was taken in preparing the response scales.
First, response categories were ordered from negative responses to positive
27
stance. For example, Nicholls, Orr, Okubo and Loftus (2006) found respondents
who completed a questionnaire that started with the statement ‘definitely agree,’
responded with that answer 27 percent more than did the students who were
offered ‘definitely disagree’ as their first option. The scale also had what
Johnson and Morgan (in press) call opposite end points, with answer choices that
“reflect equal intervals along a continuum” (p. 18). The remaining four points
were mirror-images of each other, with a total of three positive responses and
three negative responses.
Purpose of the Study
Fairness as a construct has been described in the academic literature.
However, there are three aspects to fairness which have not been explored.
First, quantitative measurements concerning which assessment practices are
considered fair by students are sparse. Second, in the few assessment studies
that address fairness, the students are often at the university level. Finally, no
empirical evidence appears to exist on the effect of fairness, or lack of fairness,
in relationship to student-teacher trust. Therefore, this study examined, in a
quantitative manner, how middle school students perceive various assessment
scenarios in terms of fairness. These results were also used to investigate the
relationship between a student’s perception of fairness and the change in trust
that child has in his/her teacher based on the assessment scenario.
The first hypothesis for this study was that there will be a difference in
28
characteristic of the scenario, but not based on the type of fairness (i.e.,
interactional, procedural, and outcome) represented in the scenario.
There may indeed be differences in students’ responses based on type of
fairness, because the types of fairness appear to represent different aspects of
teaching, assessing, and evaluating. Interactional fairness depicts more of the
formative assessment, day to day evaluations, of student performance.
Procedural fairness outlines the summative assessment practices of a teacher,
the ways in which a teacher assesses a unit of study. Outcome fairness deals
with how a teacher gives a final grade, a complete evaluation, for each student.
These are different aspects of teaching and assessing, so the students’
responses may show they are more sensitive to a teacher acting, in their
perception, more fairly during the formative, summative or evaluative period of
instruction. However, for the purposes of this study, while those differences will
be explored and discussed, the null hypothesis states the students’ responses will
vary only by the underlying fairness characteristic (i.e. deviates from best
practice or promotes best practice) rather than the type of fairness.
The second hypothesis is the students’ perceptions of fairness will have a
29
Chapter Three
Method
The following sections describe the methods that were used to investigate
students’ perceptions of fairness, and to study any relationship between the
students’ perception of fairness and the students’ perceptions of trust. Explained
below are the measures, samples for focus groups and surveys, and data
analysis and procedures that were used in this study.
Measures
This study measured two aspects of student perceptions. First, it
examined students’ judgments of various assessment scenarios in terms of
fairness. Then, it investigated if there is a relationship between the students’
perceptions of fairness and the trust the assessment practice in the scenario
would create. For example, a scenario may have described a teacher who grades
based on the length of their essays, and not on the content. The first question
students answered asks about their perception of the fairness of this practice;
the second inquired as to how this practice would influence their level of trust in
the teacher.
To ensure a balanced presentation of fairness issues, the researcher first
created a table of specifications for the survey (Table 3.1). Like a traditional
30
different types of scenarios and did not include “superfluous assessment items”
(Green & Johnson, 2010, p. 56). There were an equal number of scenarios for
each type of fairness (i.e., interactional, procedural, outcome). There was one
more scenario which deviates from best practice than promotes best practice.
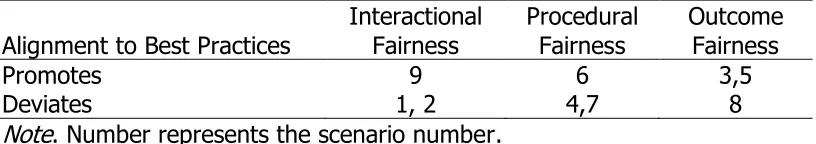
Table 3.1
Table of Test Specifications for the Survey
Alignment to Best Practices Interactional Fairness Procedural Fairness Outcome Fairness
Promotes 9 6 3,5
Deviates 1, 2 4,7 8
Note. Number represents the scenario number.
The survey was created based on the table of test specifications for the
survey. It consisted of an introduction and short description of the study,
followed by one scenario. After the scenario, two questions were asked: “If you
were a student in this class, how fair is this scenario?” and “If you were a
student in this class, and this actually happened, how would it change your trust
of the teacher?” Both questions were followed by six-point Likert responses,
with lower numbers representing the extreme “unfair” or “damage trust”
categories, respectively. An example is provided below, in Figure 3.1, and the
entire survey and scenarios can be reviewed in Appendix B.
To increase the validity of the survey, nine educators (i.e., middle school
teachers and administrators) provided feedback on the scenarios. Their
responses provided evidence based on response processes, which helped the
31
nature of the performance or response actually engaged in by test takers”
(American Educational Research Association, p. 15). They were asked to
comment specifically, for each scenario, “Is this clear to a typical middle
schooler? Is it possible this might happen in a middle school classroom? Can I
make it better? If so, how?” The researcher used the educators’ responses to
clarify the scenarios before the survey was sent to the students.
Sample Scenario and Questions
One of your teachers is trying to motivate everyone to do their best. One way he is trying to increase the students’ motivation is by handing back tests to students in order of how well they did. Students with the highest grades get their tests back first, and students with the lowest grades get their tests back last.
How fair is it for the teacher to hand back tests in order from highest to lowest?
1 2 3 4 5 6
Completely
unfair Somewhat unfair A little unfair A little fair Somewhat fair Completely fair
If this happened in your class, how much would it change your trust in your teacher?
1 2 3 4 5 6
I would not trust my teacher anymore. I would trust my teacher a lot less. I would trust my teacher a little less. I would trust my teacher a little more. I would trust my teacher a lot more. I would trust my teacher completely.
32
Samples
This study was conducted in a suburban school district in the
Southeastern United States with approximately 27,000 students in pre-school
through twelfth grade. The district has 18 elementary schools, 7 middle schools
and 5 high schools.
This study examined the perceptions of fairness in assessment scenarios
and the relationship between these perceptions and change in the
student-teacher trust relationship. The middle grades were selected for this study for
two main reasons. First, most studies addressing fairness and assessment
focused on university students. Thus, in this study the researcher wanted to
explore the perceptions of students in K-12. Also, in middle school, students
become adolescents. As Eccles and Midgley (1989) found, teacher and student
relationships decline as students make the transition into adolescence. Thus,
this study was designed to provide information that might inform the role of
assessment in contributing to that declining relationship. The sample was
further restricted to seventh grade students; at the time of the study, they had
completed one half of their middle school experience, which signifies they are
equally removed from elementary and high school.
The district’s Research, Accountability and Evaluation department
provided student demographic data, as well as school rosters. It also served as
the survey administrator, both sending out the survey and receiving the results.
33
participating district. Of those students, 53 percent were male, 47 percent were
female. Three percent of students were Asian, 60 percent were
African-American, 7 percent were Hispanic, 27 percent were White, and the remaining
three percent were either American Indian, Native Hawaiian or identified
themselves as two or more races. Forty nine percent of the students received
free or reduced lunch.
In order to help ensure the scenarios and questions of the survey would
be understood by the students, the researcher first conducted a pilot test. Fink
(2006) suggested “trying out the survey process initially by using a different
method from the one you eventually intend to use” (p. 40). In this case, the
survey instrument was first administered to a focus group in interview form. In
order to capture “a sample that represents various groups and patterns of
characteristics in the desired proportions” (Fink, 2006, p. 49), a focus group was
conducted which was comprised of seventh graders from a middle school in the
district whose seventh graders most matched the district’s seventh grade
population in terms of gender, race and socioeconomic proportions, which was
School C in Table 3.2. The table shows those demographic data points. Once
the focus group from School C gave feedback, the instrument was revised.
Changes made to the instrument are discussed in more detail in Chapter Four.
Subsequently, the remaining 2,150 seventh graders in the district were given the
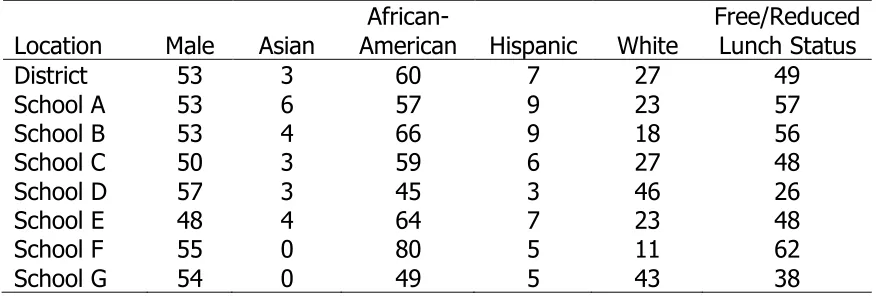
34 Table 3.2
Seventh Grade Demographic Data in Percent from District’s Middle Schools
Location Male Asian American Hispanic African- White Free/Reduced Lunch Status
District 53 3 60 7 27 49
School A 53 6 57 9 23 57
School B 53 4 66 9 18 56
School C 50 3 59 6 27 48
School D 57 3 45 3 46 26
School E 48 4 64 7 23 48
School F 55 0 80 5 11 62
School G 54 0 49 5 43 38
Data Analysis
In order to support validity, the survey scenarios were first presented to
nine educators with professional middle school experience as well as a focus
group comprised of seventh graders. This step was necessary in providing
content validity evidence, or as Doherty (2008) stated, when “you want to
improve something, ask the people who do it” (p. 82). One focus group was
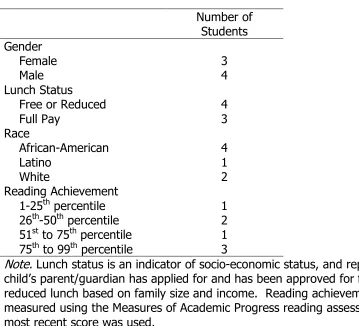
used, with seven randomly selected seventh grade students. Brown (1999) says
that the group should consist of 4-12 if the group is homogeneous and 6-12 if
heterogeneous; a balance between the need to have enough people for a lively
discussion and the danger of an overwhelming group size must be achieved.
The selected students’ parents/guardian received an invitation letter, describing
the study, explaining the benefits and risks, and asking for permission. Because
the students are minors, receiving adult permission was necessary legally and
35
same letter. Once the students had been selected and permission had been
given, the researcher coordinated with the school to meet with the students
during non-instructional time, in this case, lunch. The researcher used the script
and questions given in Appendix A. By asking for feedback before the
large-scale data collection, the researcher was able to refine the questions. As Glesne
stated, this process “enables [the researcher] to focus and shape the study as it
proceeds” (2006, p. 148). The researcher took notes during the focus group.
Later, the researcher used coding to “break down, examine, compare,
conceptualize and categorize” (Strauss & Corbin, 1990, p. 61) the data from the
interviews. These patterns then were used to change the scenarios in order to
provide clarity or relevance. The data gathered helped the “choice of question
wording become more objective and less a matter of research judgment”
(Fowler, 2002, p. 6).
The first research question of this study investigated student perceptions
of fairness based on scenarios that were constructed according to best practice
in assessment and to exemplify one of the three types of fairness as described
by Rodabaugh (1996).
1. Do students’ perceptions of fairness in an assessment scenario differ
based on the best practice characteristics of the scenario (if it is written to
promote best practice or deviate from best practice), but not based on the
36
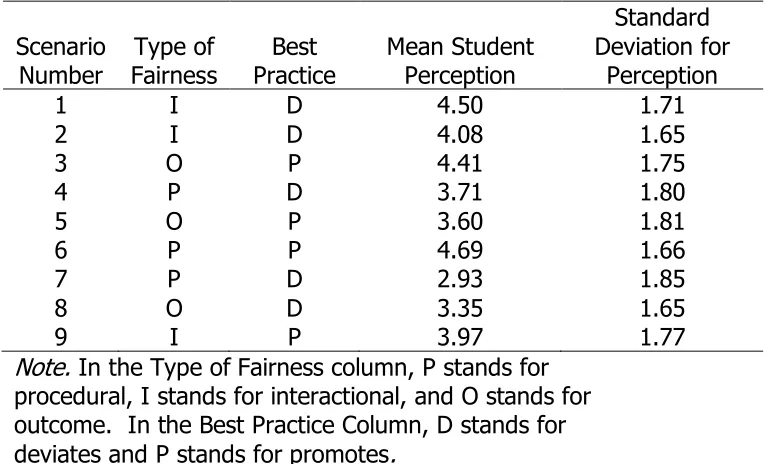
To answer this question, first a fairness alignment coefficient (FAC Sub-score) for
each student was created, in regards to type of fairness. The FAC sub-score was
a sum of the student’s perception of fairness for each of the three scenarios that
represented the three different types of fairness. In other words, the students’
perception of fairness for scenarios 1, 2, and 9 were added together to create a
FAC-interactional score. Similarly, scenarios 4, 6, and 7 were added together to
create a FAC-procedural score and scenarios 3, 5 and 8 were added together to
create a FAC-outcome score. Each student had three FAC sub-scores, and one
total FAC score.
However, because some scenarios were intentionally written to deviate
from best practice, the student’s responses for these items were reverse coded.
Thus, after this recoding, a score of six represented a student either (a)
perceiving a scenario deliberately written to promote best practice as completely
fair or (b) a student perceiving a scenario deliberately written as deviating from
best practice as completely unfair.
Then, to determine if the FAC for each sub-score is similar, a
within-subjects analysis of variances (ANOVA) was performed. A within-within-subjects’
analysis is necessary because each student’s perceptions of fairness was
represented in multiple types of fairness’ alignment coefficients sub-scores. An
ANOVA was desirable because there were three types of fairness sub-scores
represented in the scenarios. The dependent variable was comprised of the FAC
37
are interactional, procedural, and outcome fairness. When significant differences
were found (p<.05), Tukey HSD post hoc procedures were applied as necessary
to determine where the differences in FAC sub-scores lie.
While the scenarios were developed specifically with Rodabaugh’s types of
fairness in mind, to provide confirmatory validity, factor analysis was completed
on the results. Ideally, the students’ responses to the interactional, procedural
and outcome scenarios would have had similar patterns of responses because
they are all associated with a latent variable-type of fairness. However, the
researcher measured the relationships between the scenarios and reported the
results of the factor analysis.
The second research question of this study investigated if there was a
relationship between students’ perception of fairness, student’s gender, and
change in trust student perception.
2. To what extent does a student’s perception of fairness and the
student’s gender predict his or her perception of change in trust toward
the teacher?
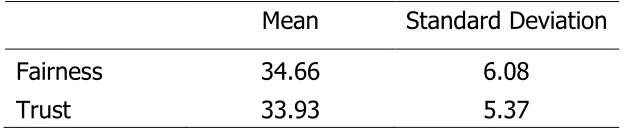
Each student’s reverse coded Total Fairness Alignment Coefficient was used as
one predictor. The student’s gender was used as the second predictive variable.
The trust variable was reverse coded for scenarios which were intentionally
written to deviate from best practice. Thus, after this recoding, a score of six
represented (a) a student gaining trust based on a fair practice or (b) a student
38
This regression coefficient addressed the second hypothesis that students
whose perceptions of fairness were more in line with best practice also changed
the level of trust for the teacher in a significant manner. In other words, a
student who found scenarios that deviated from best practice as more unfair,
and who found scenarios that promoted best practice as more fair, also changed
the trust in the teacher in a similar pattern (less trust for unfair practices and
more trust for fair practices). Also, by using gender as another predictive value,
the model tested the question “Did gender have a role in these changes of
trust?”
Procedures
For the focus group, seven students were randomly selected from School
C’s seventh grade population. The researcher met with these students during
their lunch period and used the script and questions listed in Appendix A. The
purpose of the focus group was, as Fowler states, “to compare the reality about
which respondents will be answering questions with the abstract concepts
embedded in the study objectives” (2002, p. 106).
Using data from the focus groups, scenarios were honed for the larger
survey. Then, all seventh grade students in the district received the survey via
the K12 Insight survey software program used by the district. Students were
told the survey was not mandatory and their responses would be kept
confidential. The survey began with an introduction, and description of the
39
sent via their school email, and was tracked using the K12 software’s program so
students could not complete it more than once. All data were kept in a
password-secured computer and network throughout the collection and analyses.
The data were divided into two tables. The first identified the individual
student’s responses concerning fairness to all nine scenarios. It recorded the
student’s unique identification number, the scenario number, and it noted if the
situation was written to promote best practice, or to deviate from best practice.
These pieces of data were useful first in descriptive statistics. Such statistics as
the overall mean scores for each scenario were reported, as well as overall
fairness scores for scenarios that were written in concordance or discordance
from best practice. The data table also indicated which type of fairness the
scenario represented. These data were used to create the FAC sub-scores,
which were then used in the within-subjects ANOVA.
The second data table was similar to the first data table, in that it also
recorded the student’s unique identification number, the scenario number, and it
noted if the situation was written to promote best practice, or to deviate from
best practice. However, it also recorded the change on trust perception as well.
These data were first used to create descriptive statistics such as the mean in
student perceptions of fairness and mean in student perceptions of change in
trust for each scenario. However, it was also used to run a multiple regression
40
variables for the change in trust variable. Both analyses were created using
41
Chapter Four
Data Analyses and Major Findings
This chapter presents a variety of data analyses designed to answer the
research questions:
1. Do students’ perceptions of fairness in an assessment scenario differ
based on the best practice characteristics of the scenario (if it written to
promote best practice or deviate from best practice), but not based on the
type of fairness represented (i.e., interactional, procedural, outcome)?
2. To what extent does a student’s perception of fairness and gender predict
his or her perception of change in trust toward the teacher?
Qualitative results from the educator surveys and from the student focus group
will be reported first. The descriptive and inferential statistics concerning
student perceptions of fairness will follow. Finally, analyses of students’
perception of trust, student gender, and students’ perception of trust will
conclude the chapter.
Qualitative Results from Surveys and Focus Groups
In order to increase evidence of validity based on response processes, the
researcher gathered input from stakeholders familiar with the types of behaviors