Inter-comparison of Dose Distributions Calculated by FLUKA,
GEANT4, MCNP, and PHITS for Proton Therapy
Zi-YiYang1, †,Pi-EnTsai1, 2, *, †, Shao-ChunLee1, Yen-ChiangLiu1,Chin-ChengChen3,Tatsuhiko Sato2, and Rong-JiunSheu1
1Institute of Nuclear Engineering and Science, National Tsing-Hua University, Hsinchu, Taiwan 2Japan Atomic Energy Agency, Tokai, Japan
3ProCure Proton Therapy Center, Somerset, NJ, USA
† Contributed equally to this work with: Zi-Yi Yang and Pi-En Tsai
Abstract. The dose distributions from proton pencil beam scanning were calculated by FLUKA, GEANT4, MCNP, and PHITS, in order to investigate their applicability in proton radiotherapy. The first studied case was the integrated depth dose curves (IDDCs), respectively from a 100 and a 226-MeV proton pencil beam impinging a water phantom. The calculated IDDCs agree with each other as long as each code employs 75 eV for the ionization potential of water. The second case considered a similar condition of the first case but with proton energies in a Gaussian distribution. The comparison to the measurement indicates the inter-code differences might not only due to different stopping power but also the nuclear physics models. How the physics parameter setting affect the computation time was also discussed. In the third case, the applicability of each code for pencil beam scanning was confirmed by delivering a uniform volumetric dose distribution based on the treatment plan, and the results showed general agreement between each codes, the treatment plan, and the measurement, except that some deviations were found in the penumbra region. This study has demonstrated that the selected codes are all capable of performing dose calculations for therapeutic scanning proton beams with proper physics settings.
1 Introduction
Proton radiotherapy, compared to the conventional radiation therapy using photons, has the advantages of a more pronounced dose profile, as the so called Bragg peak, and a sharper distal dose falloff (DDF) followed by the Bragg peak. As such, doses can be delivered more restrictively to tumour regions, and less damages are caused to surrounding normal tissues. However, also due to proton’s sharp Bragg peaks, the accuracy of the proton beam delivery is of critical importance in clinical treatments.
In the regulation for clinical treatment in radiotherapy, it is often required an additional independent methodology other than the semi-empirical method used in treatment planning systems (TPS) for verification and validation of the TPS. Monte Carlo (MC) simulations by using the general-purpose radiation transport codes, such as FLUKA [1], GEANT4 [2, 3], MCNPX [4, 5], MCNP6 [6], and PHITS [7], are able to calculate the dose profiles delivered by energetic protons. Hence, this study aims to investigate the applicability of these four MC codes in the proton therapy using the pencil beam scanning technique. The simulation results with respect to the accuracy,
computing efficiency, and capability of performing complicated source setup of each code were inter-compared and discussed in this study. The simulation results were also validated by the experimental data.
2 Materials and Methods
2.1 Test Cases
The following describes the details of three test cases in this study: two for the integrated depth dose curves (IDDCs) in water from a mono-directional proton pencil beam but with different energy distributions, and one for the three-dimensional (3D) volumetric dose distribution from the pencil beam scanning.
Case (a) is a mono-energetic proton pencil beam incident on a water phantom with a depth of 40 cm and an infinite area. Two proton energies, respectively at 100.0 MeV and 226.0 MeV, were tested.
delivery process. Our previous study [8] showed that the adjustments in the beam energy and its energy distribution in MC calculations can better match the experimental data, and the degree of energy spread-out decreases with the increasing proton energy. As such, the proton beam originally at 100 MeV was shifted to 100.5 MeV with 1.62-MeV full width at half maximum (FWHM) (standard deviation σ = 0.690 MeV) of a Gaussian distribution. For the original 226.0-MeV proton beam, it became a Gaussian distribution centred at 227.5 MeV with 0.54-MeV FWHM (σ = 0.023 MeV). The amount of the energy shift and the degree of the spread-out were determined by the FLUKA calculations with the same methodology used in [8].
Case (c) is to simulate the volumetric dose distribution with various proton energies between 116.1 MeV and 181.5 MeV by using the pencil beam scanning. The planning target volume (PTV) is a 10 × 10 × 10 cm3
cube centred at depth of 15 cm inside a 40 × 40 × 40 cm3
water phantom. How each pencil beam is delivered to each spot was determined by the RayStation treatment planning system (TPS) (version 4.0.3.4, RaySearch Laboratories AB, Stockholm Sweden).
2.2 Monte Carlo Simulations
The FLUKA, GEANT4, MCNP, and PHITS codes were employed for this MC simulation study owing to their established and widespread use for particle transport calculations. A brief description on the physics setting for each code and the simulation setup will be given in this section. The parameters set in each code followed either the recommended setting or the default value.
2.2.1 FLUKA
The FLUKA code version 2011.2c.4 was utilized for dose calculations. We selected the particle transport physics card HADROTHErapy, which sets the neutron transport threshold at 10-5 eV for neutrons. Transport and
production cuts were set at 100 keV for electrons/positrons, photons, and protons by EMFCUT and THRESHOLD. Also, delta ray production by charged hadrons with a 100-keV threshold is activated in this physics option. The hadron-nucleus nuclear interactions were treated by the PEANUT (PreEquilibrium-Approach-to-Nuclear-Thermalization) package. The neutron transport below 20 MeV is handled by FLUKA’s own group-wise cross section library, which was oriented from E. Cuccoli et al. [9] and updated based on the evaluations like ENDF/B, JEF, and JENDL.
2.2.2 GEANT4
The GEANT4 code version 10.1.1 was employed for this study. The physics lists adopted in this study were based on the suggestions from the user guide and recommended setting in other studies [10, 11]. The reference physics list Standard EM option 3 in the
extended example TestEm7 of electromagnetic, G4Binary and G4LElastic were selected. The range cutoffs for electrons/positrons, photons, and protons were respectively set at 143.1 μm, 34 cm, and 1 mm, which all correspond to cutoff energy at about 100 keV (the default range cut is 1 mm for the above-mentioned particles), and were not specified for the remaining particle species. The neutron transport below 20 MeV is based on the default cross section data library, G4NDL4.5, whose data comes largely from the ENDF/B-VI library [12]. Note that the delta ray production is simulated in the electromagnetic processes for both electrons (and positrons) and hadrons above the range cuts.
2.2.3 MCNP
The MCNPX code version 2.6.0 as well as the MCNP6 code version 1.0 were both used in this study, since they both have a large number of users. Both codes employ the tabulated data library for nucleon-induced reactions for projectile energies less than 150 MeV. In this study, we used the same data libraries for both versions of the code, which are LA150N [13] sourcing from ENDF/B-VI.6 [12] for neutrons, and LA150H [13] for protons. For energies above, MCNPX uses the Bertini model as default [14], whereas MCNP6 changes the default model to the cascade-exciton model (CEM) as incorporated in the event generator CEM03.03 [15]. For both of MCNPX and MCNP6, the Coulomb diffusion and the energy straggling of protons as well as elastic and inelastic scatterings were taken into account, while the photonuclear interaction was not considered. The cutoff energies were both set to 100 keV for electrons, photons, protons, and no thresholds for neutrons. Also, both codes consider the delta-ray production only from electron-electron collisions by PHY:E card, but not from heavy charged hadrons.
2.2.4 PHITS
The PHITS code version 2.86 was employed for the inter-code comparison. ATIMA [16] was used to calculate stopping powers for protons and nucleus as the default setting since this version. The options for the Landau Vavilov energy straggling and the Coulomb diffusion by Lynch’s formula [17] were turned on. The nucleon-induced nuclear reactions were modelled by the INCL4.6 model [18]. For neutron energies below 20 MeV, the transport is based on the cross section data library, JENDL-4.0 [19]. Photon and electron transports were calculated by the PHITS built-in EGS5 [20] code. The cutoff energies were 100 keV for electrons/positrons, photons, and protons, and 10-5 eV for neutrons.
Knock-on electrKnock-ons are treated in the simulatiKnock-on, and the optiKnock-on for delta rays produced from heavy charged particles with a threshold of 100 keV was turned on in order to compare the CPU time with the other codes.
0 5 10 15 20 25 30 0
2 4 6 8 10 12
14 29.5 30.0 30.5 31.0 31.5 32.0 32.5 33.0
0.0 1.0 2.0 3.0 4.0 5.0 6.0
0 2 4 6 8 10 12
1.3 1.4 1.5 1.6 1.7
(a)
226 MeV protons
Absorbed Dose
(
10
-1
1 Gy/ proton
)
Depth (cm)
GEANT4_default
GEANT4_I = 75 eV
FLUKA
MCNP6
MCNPX
PHITS
100 MeV protons
Depth (cm)
(b)
226 MeV zoom in
(c)
226 MeV zoom in
Absorbed Dose
(
10
-1
1 Gy/ proton
)
Depth (cm)
Fig. 1. (a)The IDDCs in water calculated by FLUKA, GEANT4, MCNP, and PHITS for mono-energetic protons, respectively at 100 MeV and 226 MeV; zoom in of (b)the Bragg peaks, and (c) the entrance and plateau region from 226-MeV proton.
A proton pencil beam impinged a water phantom from 200 cm upstream in vacuum. The water phantoms for case (a) and (b) are identical: both are 40-cm deep with an infinite cross sectional area. The absorbed doses were scored by disks with a 4.08-cm radius and a 1-mm depth along the beam direction, whose geometry is the same as the Bragg peak chamber (model 34070, PTW-Freiburg, Germany) used in the measurement.
The phantom for case (c) is a 40 × 40 × 40 cm3cubic
water phantom. Two different tallies were scored for this case: (i) the central-axis depth dose distribution. The tallied voxel size is 0.3 cm in thickness and 1.77 × 1.77 cm2 in cross sectional area (to mimic the collecting
electrode dimension of the multiple layer ionization chambers, (MLIC, IBA Dosimetry GmbH, Germany). (ii) The two-dimensional (2D) dose distributions perpendicular to the central axis respectively at the depths of 5, 11, 13, 15, 17, and 19 cm. The size of each scoring volume is 0.1 × 0.1 × 0.1 cm3.
The treatment plan for the dose delivery in case (c) was designed by RayStation TPS. In this treatment plan, there are 28 different incident energies ranging from 116.1 MeV to 181.5 MeV, and more than 10,000 scanning spots in total. Beam characteristics including proton energy, measured spot sizes, virtual and effective source-to-axis distance, and absolute dose correction [8] were applied in the simulation.
2.3 Measurements
The simulated results of case (b) and (c) were validated by the measurements performed at the ProCure Proton Therapy Center in NJ, USA.
For case (b), the IDDCs were measured with a Bragg peak ionization chamber (model 34070, PTW-Freiburg, Germany) [21]. The central-axis depth dose distribution in case (c) was measured by a multi-layer ionization chamber (MLIC, IBA Dosimetry GmbH, Germany) [22]. The 2D dose distributions at specific depths were measured with a 2D ion chamber array (MatriXXPT, IBA Dosimetry GmbH, Germany) [23]. More details of the measurements and the experimental uncertainties are described in the references [21-23].
3 Results and Discussions
3.1. Case (a): IDDCs from mono-energetic protons
down to zero. FLUKA, MCNP [27], and PHITS all use 75 eV for their default I value, which is the same as in the ICRU Report 37 [28]. Only the GEANT4 code version 10.1.1 employs 68.998 eV for its default ionization potential. Fig. 1 (a) shows the comparisons of the IDDCs calculated by GEANT4 (with the default I
value, andI = 75 eV), FLUKA, MCNPX, MCNP6, and PHITS, respectively for 100-MeV and 226-MeV protons. The calculated peak locations for 100-MeV protons show no prominent differences, except that the GEANT4 with the default setting has the Bragg peak location 0.1 cm shallower than the others. The difference in peak location becomes significant as the proton energy increases to 226 MeV as shown in Fig. 1(b), the zooming-in of the 226-MeV protons’ IDDCs around the Bragg peak. The result of GEANT4 with the I value of 75 eV showed better agreement with the others. Based on this fact, the ionization potential was set at 75 eV for later calculations in GEANT4 to be consistent with the other codes.
In MCNP simulations, it is observed that, in the entrance region, their IDDCs look stepwise and are not as smooth as the other codes’. An example is shown in Fig. 1 (c) with 226-MeV protons incident on a water phantom. Such smoothness can be adjusted by the efac
parameter in the PHYS:H card in MCNP6 (MCNPX does not offer this option to users). More details of the effects of this parameter will be discussed in section 3.2.2 along with its computation time.
3.2 Case (b): IDDCs from proton beams with energy shift and energy spread-out
The MC simulations and the measured relative IDDC data were compared here for case (b): proton beams with a Gaussian energy distribution centred at the energy slightly higher than case (a).
3.2.1 Depth dose distribution
Table 1 lists the total energy depositions in the cylindrical scoring region calculated by each codes for
Table1. The total energy deposition in the cylindrical scoring
region (radius = 4.08 cm) for two proton beam energies calculated by each MC codes.
Code 100.5 MeV
(FWHM: 1.62 MeV)
227.5 MeV (FWHM: 0.54 MeV)
FLUKA 98.60 MeV 204.52 MeV
GEANT4 98.18 MeV 203.91 MeV
MCNP6 97.21 MeV 201.96 MeV
MCNPX 96.84 MeV 200.90 MeV
PHITS 98.22 MeV 204.20 MeV
Average
(Measurement) 97.81 MeV 203.10 MeV Maximum
difference* 1.82% 1.80%
* (maximum − minumum) minumum⁄ × 100%
0 1 2 3 4 5 6 7 7.6 8 9
0.90 0.92 0.94 0.96 0.98 1.00 1.02 1.04 1.06
(a)
Bragg peak
Protons: 100.5 MeV (FWHM = 1.62 MeV) FLUKA
GEANT4 MCNP6 MCNPX PHITS
Ratio of Calculation/Measurement
Depth (cm)
0 5 10 15 20 25 3031.7 35
0.90 0.92 0.94 0.96 0.98 1.00 1.02 1.04 1.06
Bragg peak
Ratio of Calculation/Measurement
(b)
Protons: 227.5 MeV (FWHM = 0.54 MeV) FLUKA
GEANT4 MCNP6 MCNPX PHITS
Depth (cm)
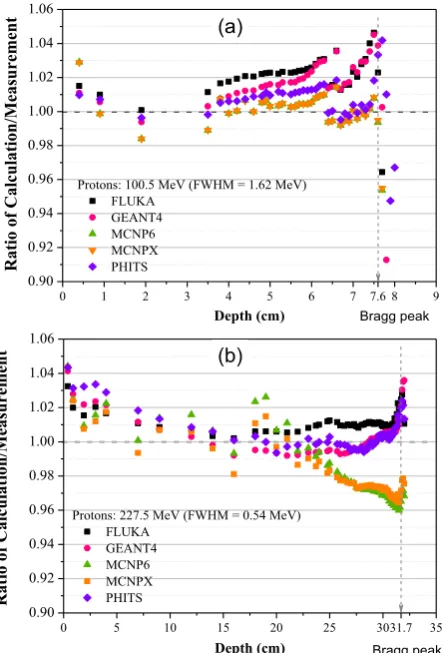
Fig. 2.The C/M ratios of each code for proton beams with a
Gaussian energy distribution: (a) 100.5 MeV (1.62-MeV FWHM), and (b)227.5 MeV (0.54-MeV FWHM).
two proton beam energy distributions. The values were obtained by integrating the doses deposited in each 4.08-cm-radius disk along the central axis over the entire phantom depth, i.e. the area under calculated IDDCs. Because the experimental data are available only in relative intensity, in order to compare the measurement and the simulations, the area under the measured IDDC was scaled to the average area under the MC calculated IDDCs, which is 97.81 MeV for the 100.5-MeV proton beam, and 203.10 MeV for the 227.5-MeV proton beam.
Table 1 also shows that, for both proton energies, MCNPX deposits the least amount of the total energy in the water phantom among all MC codes, while FLUKA deposits the largest amount of the total energy. The maximum differences among all the simulations are around 1.8%.
phantom than other codes, whereas MCNPX and MCNP6 deposit the least amount of energies among all the codes. Such trends in the deeper region are in consistent with the total energy depositions listed in Table 1.
Fig. 2 also shows that the discrepancies also occur in the ascending region before the Bragg peaks, as well as the DDF region (here the distal dose falloff is defined as the distance from the 80% to the 20% dose level). Before the pristine Bragg peak, these inter-code differences in the C/M ratios are mainly resulted from (i) different stopping powers adopted in each code, and (ii) different physics models implemented in each code. However, as the depth in the water phantom increases, proton energy is continuously slowed down, and the inter-code differences are contributed by both factors, and thus need further study to investigate which factor has more impact on the differences.
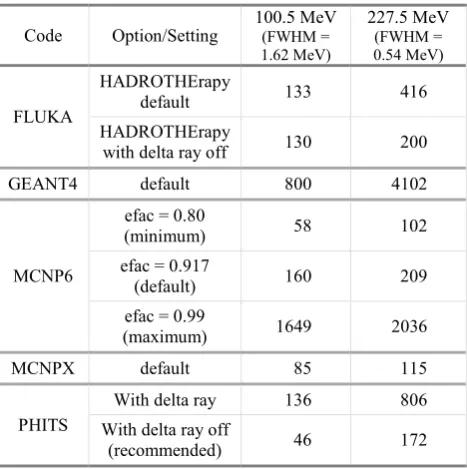
3.2.2 Computation time
The computation time of each code was also compared for these two proton energies by using a PC equipped with a 3.4-GHz i7-3770 CPU, and the results were listed in Table 2. Note that PHITS does not recommend turning on delta ray production from heavy charged particles in calculations for particle therapy, as the transport of delta electrons is CPU expensive but only contributes negligible dose (less than 1%) to the final IDDCs due to the extremely short ranges of those delta rays. Thus the computation time for PHITS without considering delta rays from hadronic interactions is also tested and listed in Table 2. In FLUKA, though the default setting in the physics card HADROTHErapy considers the delta ray production from charged hadrons, the option can be turned off by users. Thus the run time was also tested, respectively with activating and
Table 2. The computation time (minutes) for 107 particles
using different MC codes with different parameter settings.
Code Option/Setting
100.5 MeV (FWHM = 1.62 MeV)
227.5 MeV (FWHM = 0.54 MeV)
FLUKA
HADROTHErapy
default 133 416
HADROTHErapy
with delta ray off 130 200
GEANT4 default 800 4102
MCNP6
efac = 0.80
(minimum) 58 102
efac = 0.917
(default) 160 209
efac = 0.99
(maximum) 1649 2036
MCNPX default 85 115
PHITS
With delta ray 136 806
With delta ray off
(recommended) 46 172
deactivating this option, in order to investigate its impact on the computation time.
From Table 2, it is shown that, if the calculation of delta rays from heavy charged particles is taken into account (in FLUKA, GEANT4, and PHITS), then FLUKA and PHITS require about the same least amount of time for 100.5-MeV protons. If the proton energy increases to 227.5 MeV, FLUKA’s computation time is about half of PHITS’, indicating that the transport of delta electrons in FLUKA is more efficient than in PHITS. In contrast, for both proton energies, the computation time for GEANT4 is much longer than FLUKA and PHITS, and should be further improved.
When the transport of delta ray produced from charged hadrons is not considered, the difference in computation time required among all codes (excluding GENAT4 and MCNP6 with non-default efac settings) is not as significant as the time difference whilst the detla ray produced from charged hadrons is taken into consideration. The run time is least for PHITS with the 100.5-MeV proton beam, and for MCNPX with the 227.5-MeV proton beam, whereas the MCNP6 code with the default efac requires the longest time. Note that for both of FLUKA and PHITS, the computation time is much shorter when delta rays produced heavy charged particles are not considered, especially for higher incident proton energies.
It is worth mentioning that in MCNPX or MCNP6, the short calculation time is partially owing to its relatively rough energy spacing in the stopping power calculation by the default setting for “efac” in the PHYS:H physics card. Such default setting also results in its IDDCs in the entrance region coarse-stepwise and not as smooth as the other codes’, as shown in Fig. 1 (c). In MCNP6, users can determine the efac value within the range of 0.80 and 0.99 (default is 0.917); a larger efac
value produces more points in the stopping power tables, and thus a smoother IDDC. In this study, we also investigated how this setting affects the computation time and IDDCs; the result is shown in Fig. 3. With a larger efac value, (i) the IDDC is smoother. (ii) The range is slightly shorter. For instance, the range calculated with efac = 0.99 is about 2 mm shorter than the one with efac = 0.80. (iii) The required computation time, as shown in Table 2, is much longer. (iv) The area under the IDDCs (the total energy deposition) remains about the same (≪ 1.0%) regardless the efac setting. As
0 4 8 12 16 20 24 1.3
1.4 1.5 1.6 1.7 1.8 1.9 2.0
31.0 31.5 32.0 32.5 33.00.0 1.0 2.0 3.0 4.0 5.0
Absorbed Dose (
10
-1
1Gy/ proton
)
Depth (cm)
MCNP6 efac = 0.800 efac = 0.917
efac = 0.990 Absorbed Dose (
10
-11
Gy/ proton)
Depth (cm)
Fig. 3. The IDDCs calculated by MCNP6 with efacat 0.80
such, this parameter setting depends on users’ requirement and the compensation between computation time, precision in range calculation, and smoothness of IDDCs.
3.3 Case (c): Volumetric dose distributions
In this test case, the source setup based on the TPS was to deliver a uniform volumetric dose distribution by using scanning pencil beams with energies from 116.1 MeV to 181.5 MeV. The calculation results of FLUKA, GEANT4, MCNP6, and PHITS along with the treatment plan and the measurement are compared in this section.
For the central-axis depth dose curves, all the measured and calculated results were normalized to 110 at the depth of 15 cm (the isocentric plane), because the dose distribution is quite flat in the plateau region. The MC simulations, the experimental data, and the TPS calculation are shown in Fig. 4(a); the calculation to measurement ratios for each MC codes are shown in Fig. 4(b). As seen in Fig. 4, though the deviations of the TPS to the measurement or the MC simulations to the measurement can be as large as ~5% at the phantom entrance window and the beginning region of the optimized target volume, they mostly agree with each other with C/M within 1.00 0.02. Besides, the MC simulations can well overlap with TPS result. Considering the distal dose fall-off edge and lateral penumbra, the differences among the calculations, TPS, and the measurements were within 1 mm.
The calculation results of total dose and the total energy deposition per incident proton were also inter- compared for each MC code and listed in Table 3. The
0 20 40 60 80 100 120
0 2 4 6 8 10 12 14 16 18 20 22
0 2 4 6 8 10 12 14 16 18 20 22 0.7
0.8 0.9 1.0 1.1
optimized target volume
(a)
normalization point
FLUKA GEANT4 MCNP6 PHITS TPS Meas.
Re
la
tiv
e Do
se
(a
rb
itr
a
ry
u
n
it)
1.00 +/- 0.02 1.00 +/- 0.05
(b)
FLUKA GEANT4 MCNP6 PHITS
Ra
tio
of C
a
lc
ul
ati
o
n/Measurement
Depth(cm)
Fig. 4. (a) The relative depth dose distributions along the
central axis for case (c) from measurement, TPS, as well as FLUKA, GEANT4, MCNP6, and PHITS simulations.(b)The C/M ratios for each MC code.
Table 3. The total dose and energy deposition per proton,
respectively in the PTV (10 ⨯ 10 ⨯ 10 cm3) and in the entire
water phantom (40 ⨯ 40 ⨯ 40 cm3).
Code
PTV Entire water phantom
Total dose1
Total energy deposition2
Total dose1
Total energy deposition2
FLUKA 90.06 56.22 3.941 157.45
GEANT4 92.69 57.86 3.891 155.44
MCNP6 91.58 57.17 3.865 154.41
PHITS 93.46 58.34 3.901 155.86
Maximum
difference3 3.77% 1.96%
1. Unit in 10-13 Gy/proton 2. Unit in MeV/proton
3. (maximum − minumum) minumum⁄ × 100%
trend in total energy deposition in the entire water phantom is consistent with Table 1, which shows the energy deposition is the greatest with the FLUKA calculation, followed by PHITS, GEANT4, and then MCNP6. The maximum inter-code difference is about 2.0%. Nevertheless, the trend in the total dose per proton delivered to the PTV is slightly different. PHITS estimates the largest amount of dose in the PTV region, and is then followed by GEANT4, MCNP6, and FLUKA in order. The maximum inter-code difference, 3.8%, is also slightly larger. Since the proton beam scanning spots are not far from the boundaries of the PTV, the relatively large inter-code differences and inconsistent trend with the total dose in the entire phantom are likely resulted from the different models employed in each MC code for angle straggling.
The 2D dose distributions of the measurements, TPS, and MC simulations were performed or tallied at the depths of 5 cm, 11 cm, 13 cm, 15 cm, 17 cm, and 19cm inside the water phantom, which include both upstream and downstream of the isocentric plane (at the depth of 15 cm in this case). To obtain the relative 2D dose distributions, the doses inside the water phantom at different depths were all normalized to the average value of the central 0.6 cm × 0.6 cm area at the isocentric plane. The ratio of the TPS or calculation over the measurement within 1.00 0.05 are considered in good agreement with the data, as the statistical errors of the experimental data are about 5% within the PTV. As shown in Fig. 5, for the 10 cm × 10 cm target areas, the TPS and the MC calculations, overall, have agreement within 5% with the measurement at all of the depths, although there are some spots that slightly underestimating the delivered does for (i) FLUKA and GEANT4 in the 5-cm-deep plane, and (ii) MCNP6 and PHITS in the 19-cm-deep plane.
the PTV. It is likely that such underestimation is resulted from the background contribution of room scattering during the measurement, which was disregarded in neither the TPS nor the MC simulations.
To quantify the agreement of results, the gamma evaluation method [29, 30] was utilized here. This evaluation method provides a quantitative index from a composite analysis of dose -difference (DD) and distance-to-agreement (DTA, defined as the distance between a measured data point and the nearest point in the simulated dose distribution that has the same dose). The smaller the value of , the better the agreement between the reference and the calculation. When 1, it means calculations pass the evaluation criteria; when 1, it means calculations fail in the evaluation. Table 4 lists the passing rates for each code at six different depths, respectively with the measurement and the TPS as the reference. The criteria to distinguish the differences were DD = 2% and DTA = 2 mm, as suggested by the ICRU report [31]. Higher passing rates over all points in a certain distribution indicates better agreement for this comparison. As seen in Table 4, all of the results had the passing rates greater than 90%.
However, the results versus the measurement were lower than the results versus the TPS, which is due to (i) the disregard of background contribution in neither the TPS nor the MC simulations, and (ii) the statistics in the measurement becomes poor as the distance from the
Table4. The gamma passing rates with 2% DD and 2mm DTA
criteria for each code compared with the measurement and the TPS at the depths of 5 cm, 11 cm, 13 cm, 15 cm, 17 cm, and 19 cm for case (c).
Depth FLUKA GEANT4 MCNP6 PHITS
vs. Mea
s.
5 cm 92.39 % 92.03 % 91.68 % 90.45 % 11 cm 93.93 % 93.83 % 93.72 % 90.06 % 13 cm 90.06 % 92.31 % 93.30 % 92.77 % 15 cm 99.85 % 98.77 % 90.80 % 99.08 % 17 cm 93.72 % 93.72 % 99.01 % 91.55 % 19 cm 94.10 % 91.72 % 91.81 % 91.63 %
vs. TPS
5 cm 96.18 % 94.63 % 93.74 % 95.55 % 11 cm 99.44 % 99.36 % 98.10 % 98.16 % 13 cm 99.91 % 99.22 % 99.72 % 98.67 % 15 cm 99.85 % 98.77 % 96.71 % 99.15 % 17 cm 99.73 % 97.00 % 95.24 % 98.47 % 19 cm 98.79 % 98.26 % 94.08 % 96.36 %
Fig. 5.The representative C/M ratios of 2D dose distributions at depths of 5 cm (1strow), 11 cm (2ndrow), 15 cm (3rdrow), and 19
cm (4th row) for case (c). From left to right in order are the ratios of FLUKA/measurement, GEANT4/measurement,
PTV increases, and such statistical fluctuation causes the drop of the passing rates versus the measurement.
For this case (c), in summary, the TPS as well as the MC simulations by FLUKA, GEANT4, MCNP6, and PHITS are all able to reproduce the measured results in the PTV. Although the disagreement becomes more significant in the high dose gradient regions, the dose contribution to the phantom also becomes smaller due to the sharp distal falloff of the scanning proton beams as the distance was further away from the PTV. As such, the differences in the total dose to the entire water phantom are also small.
4 Conclusions
This study has demonstrated that the five MC codes – FLUKA, GEANT4, MCNPX, MCNP6, and PHITS, are capable of performing dose calculation for therapeutic proton beams, even for complex source setup with more than 10,000 scanning spots. Several physics settings were probed, including the ionization potential of water in GEANT4, the energy spacing for stopping power calculations in MCNP6, and the delta ray production from heavy charged particles in FLUKA and PHITS. It is suggested these setting or parameters should be carefully determined or selected, based on the users’ requirements for computational time, smoothness of IDDCs, as well as preciseness and accuracy of range calculations. If users require a rough and quick calculation, MCNPX or MCNP6 with large energy spacing in stopping power calculations is suitable for this purpose. If users consider both computation time and smoothness of IDDCs, it is recommended to use the PHITS code without considering delta rays produced from heavy charged particles.
The results of this study has also shown that, with proper physics parameter settings in the MC codes, the simulations, measurements and TPS are generally in a few percent agreement with each other. As such, these MC codes can be further developed as an independent tool for verification of TPS in clinical use.
References
1. K. Parodi, A. Ferrari, F. Sommerer, H. Paganetti, Phys. Med. Biol.,52, 3369-87 (2007)
2. H. Paganetti, H. Jiang, K. Parodi, R. Slopsem, M. Engelsman, Phys. Med. Biol.,53, 4825–53 (2008) 3. T. Akagi, T. Aso, G. Iwai, A. Kimura, S. Kameoka,
S. B. Lee, Y. Maeda, N. Matsufuji, T. Nishio, C. Omachi, S. Park, T. Sasaki, T. Toshito, W. Takase, T. Yamashita, Y. Watase, Prog. Nucl. Sci. Technol.,
4, 896-900 (2014)
4. A. E. Torshabi, A. Terakawa, K. Ishii, H. Yamazaki, S. Matsuyama, Y. Kikuchi,M. Nakhostin, H. Sabet, A. Ishizaki, W. Yamashita, T. Togashi, J. Arikawa, H. Akiyama, K. Koyata, World Acad. Sci. Eng. Technol.,3, 1124-29 (2009)
5. G. O. Sawakuchi, D. Mirkovic, L. A. Perles, N. Sahoo, X. R. Zhu, G. Ciangaru, K. Suzuki, M. T.
Gillin, R. Mohan, U. Titt, Med. Phys.,37, 4960-70 (2010)
6. J. M. Verburg, H. A. Shih, J. Seco, Phys. Med. Biol., 57, 5459-72 (2012)
7. T. Sato, K. Nitta, N. Matsuda, S. Hashimoto, Y. Iwamoto, S. Noda, T. Ogawa, H. Iwase, H. Nakashima, T. Fukahori, K. Okumura, T. Kai, S. Chiba, T. Furuta, L. Sihver, JNST, 50, 913-23 (2013)
8. Z. Yang, C. Chen, D. Mah, R. Sheu, Int. J. Particle. Ther.,2, 298, (2015)
9. E. Cuccoli, A. Ferrari, G.C. Panini, JEF-DOC-340,
91(1991)
10. C. Z. Jarlskog, H. Paganetti, IEEE Trans. Nucl. Sci.,
55, 1018-25 (2008)
11. L. Grevillot, T. Frisson, N. Zahra, D. Bertrand, F. Stichelbaut, N. Freud, D. Sarrutet, Nucl. Instr. Meth. Phys. Res. B,268, 3295-3305 (2010)
12. P.F. Rose, Report BNL-NCS-17541 (ENDF-201), (USA, 1991)
13. M. B. Chadwick, P. G. Young, P. Moller, G. M. Hale, A. J. Koningt, Satoshi Chiba,Los Alamos National Laboratory report LA-UR-99-1222(1999). 14. D. B. Pelowitz et al., MCNPXTMUser’s manual
Version 2.6.0 (2008)
15. D. B. Pelowitz et al., MCNP6TMUser’s manual
Version 1.0 (2013)
16. https://web-docs.gsi.de/ weick/atima/
17. G. R. Lynch, O. I. Dahl, Nucl. Instr. Meth. Phys. Res. B,58, 6-10 (1991).
18. A. Boudard, J. Cugnon, J. -C. David, S. Leray, D. Mancusi, Phys. Rev. C,87, 014606 (2013)
19. Shibata, Keiichi, et al. JNST, 48, 1-30 (2011). 20. H. Hirayama, Y. Namito, A. F. Bielajew, S. J.
Wilderman, W. R. Nelsonet, SLAC-R-730 (2005) and KEK Report 2005-8(2005)
21. X. Zhang, W. Liu, Y. Li, X. Li, M. Quan, R. Mohan, A. Anand, N. Sahoo, M. Gillin, X. R. Zhu, Phys. Med. Biol., 56, 7725-35 (2011)
22. S. Dhanesar, N. Sahoo, M. Kerr, MB. Taylor, P. Summers, X. R. Zhu, F. Poenisch, M. Gillin, Med. Phys.,40, 092102 (2013)
23. B. Arjomandy, N. Sahoo, X. Ding, M. Gillin, Gillin, Med. Phys.,35, 3889-94 (2008)
24. H. Bethe, AdP,397, 325-400 (1930) 25. F. Bloch, Z. Phys.,81, 363-76 (1933) 26. F. Bloch, AdP,408, 285-320, (1933)
27. R. M. Sternheimer, S. M. Seltzer, M. J. Berger, Phys. Rev. B, 26, 6067-76 (1982)
28. ICRU, ICRU Rep. No. 37, Bethesda, MD (1984) 29. D. A. Low, W. B. Harms, S. Mutic, and J. A. Purdy,
Med. Phys. 25, 656-61, (1998).
30. D. A. Low and J. F. Dempsey, Med. Phys. 30, 2455-64, (2003).