Comparison of Performance of RR CPU
Scheduling Algorithm with Different Dynamic
CPU Scheduling Algorithm
Purnendra Kumar 1, Rohit 2
Guest Faculty, Department of Computer Science, REC Sonbhadra , UP, India1
Guest Faculty, Department of Computer Science, REC Sonbhadra , UP, India 2
ABSTRACT: Round Robin CPU scheduling algorithm use fixed time quantum in timeshared system. In timeshared system performance is totally depends upon the selection of time quantum. Static time quantum and selection of time quantum both reason in RR CPU scheduling algorithm is disadvantage for the CPU performance. In this paper study the different dynamic RR CPU scheduling algorithm and discuss the selection of time quantum for better performance. This paper present the compression between simple RR CPU scheduling algorithm, AMMRR (Average Mid-Max RR),EDRR (Efficient dynamic RR),SRBRR(Shortest Remaining Burst RR) and ISRBRR(Improved Shortest Remaining Burst RR). Large response time, large turnaround time, large waiting time, high context switch and fewer throughputs this is the disadvantage of RR CPU scheduling algorithm. This disadvantage of RR CPU Scheduling algorithm can be improved by new dynamic CPU scheduling algorithms.
KEYWORDS: Operating system, Gantt chart, RR CPU scheduling algorithm, Turnaround time, Response time, waiting time, Context switching, burst time.
I. INTRODUCTION
Computer hardware is managed by operating system which is a program [7]. Platform is provided by operating system for executing a program and user can communicate with hardware by operating system. Modern operating system use multitasking and multiprocessing environment because of this processes are assign to available CPU this is called CPU scheduling. Sharing of CPU between more than one processes is called scheduling [1]. Process starvation may be come when CPU allocate to the process for avoid the starvation require justice and awareness for CPU allocation to the process. Performance metrics viz. is maximizes the throughput, CPU utilization and minimizes waiting time, context switches and response time is the goal of CPU scheduling algorithm [6].
Selection of the CPU scheduling algorithm following performance metrics [2, 3] is required.
A) CPU utilization: we are assigned the CPU to processes as possible means CPU busy always during the execution of the processes is called CPU utilization. Range of the CPU utilization is 0 to 100 percent.
B) Response time: first response is produced after submission of the request this time is called response time. C) Throughput: no of processes execute completely in per unit time means the no of task execute completely in
per second which is managed by schedule is called throughput.
D) Turnaround time: turnaround time is the time interval between time of completion and time of submission of the processes. Turnaround is the sum of the time spent in the waiting to get in the memory, execution on the CPU, waiting the ready queue, and doing I/O.
E) Waiting time: waiting time is the after submission of the processes wait in the ready queue and we are focused minimize the average waiting time of the processes.
Basic scheduling algorithms
First-Come First Serve: Modern operating system is not used FCFS CPU scheduling algorithm. It is a non-pre-emptive scheduling algorithm. In non-pre-non-pre-emptive scheduling algorithm if CPU holds by a process, process leave the CPU after completes the execution. In FCFS scheduling algorithm which process arrive first then that process hold the CPU first.
Shortest Job First: in this algorithm allocate CPU first to the shortest CPU burst time. It is also a non-pre-emptive CPU scheduling algorithm this algorithm tries to minimize the average waiting time. This algorithm is better than FCFS. Pre-emptive scheduling algorithm is better than non-pre-emptive because pre-emptive has abilities to switch the CPU to another process.
Round Robin: It is used in time shared system. It is pre-emptive scheduling algorithm but switch the CPU to another process after a fixed amount of time which is the static time quantum [4]. This algorithm is same as FCFS but in pre-emptive manner. This algorithm fare to all process for execution but more overhead required.
Shortest Remaining Time Next: This algorithm is pre-emptive version of shortest job first algorithm.
Highest Response Ratio Next: In this algorithm select a process for assign to CPU with the highest ratio of service time and waiting time.
Feedback Queue: in this algorithm ready queue is divided in to several separate queues. And one queue is assign to one process and this process is allowed to move between queues. Each queue has its own scheduling algorithm.
II. SCHEDULINGALGORITHM
A) ROUND ROBIN CPU SCHEDULING ALGORITHM :
Following steps are given for RR scheduling algorithm:- Step 1:
A queue is maintained by scheduler for ready processes, swapped out processes and list of blocked processes. Step 2:
Newly created process has Process Control Block it is add to the end of ready queue. Terminating process of Process Control Block is discarding from the scheduling data structure.
Step 3:
Select the Process Control Block by scheduler is always from the head of the ready queue. Step 4:
When time quantum is finish by a running process then this process is added at the end of ready queue. Step 5:
Following action is performed by event handler:
a) When a process makes swapped out or input-output request then its PCB which is in the ready queue is removed and moved in to the blocked/swapped out list.
Round Robin scheduling algorithm has the following disadvantage for operating system:
Larger response time and waiting time
Static time slice
Large number of context switches
Low throughput
B) EFFICIENT DYNAMIC ROUND ROBIN CPU SCHEDULING ALGORITHM:
Small modification in the round robin algorithm by this algorithm. During round robin algorithm FCFS is used but in this algorithm shortest job first strategy is used. For smaller CPU burst RR algorithm is not efficient. Instead of static time quantum this algorithm is used dynamic time quantum for time shared system [5]. This algorithm is minimizing the number of performance matrices because this algorithm is executed in two steps. Following steps for this algorithm:
Step 1:
Based on the CPU burst time processes are arranged in the ascending order. Step 2:
Shortest burst time means burst time of first process is set to the time quantum. Step 3:
Calculate the mean and median for all processes in terms of CPU burst time. Step 4:
Time quantum for the processes is set by following methods: If (median<mean)
TQ = (mean∗highest burst time) + (median∗lowest burst time)
Else If (mean<median)
TQ = (median∗highest burst time) + (mean∗lowest burst time)
Else
TQ = mean
Step 5:
Based on the round robin algorithm allocate the CPU to every processes. Step 6:
Go to step 1.
C) A BEST POSSIBLE TQ FOR SHORTEST REMAINING BURST RR (SRBRR) ALGORITHM:
Following steps are required for this algorithm: Step 1:
All processes are sorted in increasing order and all processes are present in the ready queue. Step 2:
While (ready queue ! = NULL)
TQ = (highest burst time∗median)
Step 3:
Set the TQ to process
Pi → TQ
Step 4:
If (i< n) then go to step 3. Step 5:
If arrived a new process. Update the counter n and go to step 1. End of While.
Step 6:
Step 6: End.
D) IMPROVED SHORTEST REMAINING BURST RR (ISRBRR) USING RMS AS ITS TIME TQ :
This algorithm is works as follows: Step 1:
Ready queue is empty or not first of all this is check. Step 2:
Ready queue is assigned by all processes when ready queue is empty. Step 3:
Arrange the all processes based on burst time in ascending order that means process which has larger burst time get low priority and process which has smaller burst time get high priority.
Step 4:
While (ready queue ! = NULL) Step 5:
Time quantum is calculated as follow:
TQ = ( ∑ / )
Step 6:
Each process is getting the TQ:
P ←TQ and i = i + 1
Step 7:
If (i < ) then go to step 6.
Step 8:
Ready queue is update if the new process is arrived, go to step 2. Step 9:
End of While. Step 10:
Calculate average turnaround time, average waiting time and number of context switches. Step 11:
End.
E) AVERAGE MID MAX RR (AMMRR) SCHEDULING ALGORITHM :
Step 1:
Processes are shorted in increasing order based on the burst time and then arrived in the ready queue. Step 2:
While (RQ != NULL) // RQ = Ready Queue // Mid = Mid of all the processes in the ready queue
// Min = First process in the ready queue having minimum burst time // Max = Fast process in the ready queue having maximum burst time
Mid =Min + Max
2
TQ =Mid + Max
2
(Remaining burst time of the process)
// if one process is there then after calculation of TQn is equal to BT itself Step 3:
// assign TQ to (1 to n) processes For i = 0 to N loop
{
}
End of for
// assign TQ to all the available processes Step 4:
Calculate the remaining burst time of all processes. Step 5:
If (new process arrived and BT ! = 0 or new process is arrived and BT == 0)
Then go to step 1
Else if (new process is not arrived and BT ! = 0) Then go to step 2
Else Go to step 6 End of if End of while Step 6:
Calculate ATT, NCS, AWT Step 7:
End.
III. EXPERIMENTAL ANALYSIS
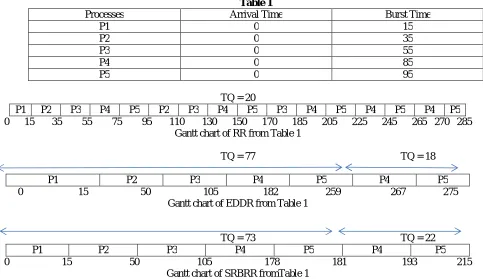
CASE 1:-Let us consider five processes arrival time =0 and burst time (P1 = 15,P2 = 35,P3 = 55,P4 = 85,P5 = 95) as shown in the table 1.
Table 1
Processes Arrival Time Burst Time
P1 0 15
P2 0 35
P3 0 55
P4 0 85
P5 0 95
TQ = 20
P1 P2 P3 P4 P5 P2 P3 P4 P5 P3 P4 P5 P4 P5 P4 P5 0 15 35 55 75 95 110 130 150 170 185 205 225 245 265 270 285
Gantt chart of RR from Table 1
TQ = 77 TQ = 18
P1 P2 P3 P4 P5 P4 P5
0 15 50 105 182 259 267 275 Gantt chart of EDDR from Table 1
TQ = 73 TQ = 22
P1 P2 P3 P4 P5 P4 P5
TQ = 65 TQ = 30
P1 P2 P3 P4 P5 P4 P5
0 15 50 105 170 235 255 285 Gantt chart of ISRBRR from Table 1
TQ = 75 TQ = 20
P1 P2 P3 P4 P5 P4 P5
0 15 50 105 180 255 265 285 Gantt chart of AMMRR from Table 1
Compression between above CPU scheduling algorithm
Algorithm Time Quantum Turnaround Time Average Waiting
Time
No of Context Switches
RR 20 173 116 15
EDDR 77,18 142.4 70.4 6
SRBRR 73,22 115.6 69.6 6
ISRBRR 65,30 136 68 6
AMMRR 75,20 144 87 6
IV.CONCLUSION
This paper presents a various CPU scheduling algorithm. Compression between RR, EDDR, SRBRR, ISRBRR, AMMRR has been done in terms of Turnaround Time, Average Waiting Time and number of Context Switches. Other than Round Robin CPU scheduling algorithm each of the algorithm used dynamic time quantum or adjusting the time quantum based on the analytical method. Compression with all CPU scheduling algorithm which are in this paper and RR algorithm all other algorithm is more efficient than RR algorithm based on the performance metrics. So all algorithm based on dynamic time quantum reduce the overhead in the operating system.
REFERENCES
[1] Abraham Silberschatz, Peter Baer Galvin, Greg Gagne, “Operating System Concepts”, Sixth Edition.
[2] E.O. Oyetunji, A. E. Oluleye,” Performance Assessment of Some CPU Scheduling Algorithms”, Research Journal of Information Technology,1(1): pp 22-26, 2009
[3] Ajit Singh, PriyankaGoyal, SahilBatra,” An Optimized Round Robin Scheduling Algorithm for CPU Scheduling”, (IJCSE) International Journal on Computer Science and Engineering Vol. 02, No. 07, 2383-2385, 2010.
[4] “Silberschatz, A., P.B. Galvin and G. Gagne, 2008” Operating Systems Concepts. 7th Edn., John Wiley and Sons, USA., ISBN: 13: 978-0471694663, pp: 944.
[5] Rami J. Matarneh, “Self-Adjustment Time Quantum in Round Robin Algorithm Depending on Burst Time of the Now Running Processes”, American Journal of Applied Sciences, Vol 6, No. 10, 2009
[6] Ajit Singh, PriyankaGoyal, SahilBatra,” An Optimized Round Robin Scheduling Algorithm for CPU Scheduling”, (IJCSE) International Journal on Computer Science and Engineering Vol. 02, No. 07, 2010, 2383-2385.
[7] Operating Systems SibsankarHaldar 2009, Pearson Education, India.