Color Image De-Noising Using Wavelet Thresholding
RAJAN RAJPAYLE (M.E.) 1
P.N.NARWADE (Ph.D), Assistant professor 2
1,2Khurana Sawant Institute of Engineering & Technology, Hingoli, Maharashtra, India
[email protected] [email protected]2
Abstract
For processing on any image first we need to denoise it. Image de-noising is a fundamental problem in the field of image processing. Image de-noising is a process of make or become better the quality of image by improving its feature. It is often used in the field of photography or publishing where an image is somewhat degraded but needs to be improved before it is utilized. This paper represents an approach of wavelet based image denoising methods using soft thresholding. The good image denoising model is one which completely removes noise as far as possible as well as preserve recover original denoised image without affecting the original images characteristics. One of the most powerful and perspective approaches in this area is image denoising using wavelet transform soft thresholding technique. Aim to modify the coefficient is remove the noise from data or signal and almost remove different types of noise presents in the colour images.
keywords
:-colour image denoising, wavelets denoising, Wavelet Thresholding, soft thresholding1.
I
NTRODUCTION
Wavelet denoising attempts to remove the noise present in the image while preserving its characteristics. It is different from smoothing as smoothing only removes high frequency while retaining the lower ones.
In this era of digitalization, the colour image is much important because image information transmitted in the form of digital images, but after that transmission noise is add in image, Image noise may be caused by different intrinsic (i.e., sensor) and extrinsic (i.e., environment) conditions which are unable to avoid. we have developed many methods towards denoising but still searching for efficient method. One of the most efficient and powerful way
is image denoising. Using wavelet transform i.e. thresholding technique an image is often corrupted by noise in its acquition and transmission. Image denoising is used to remove the additive noise while retaining as much as possible the important signal features.
In the recent years there has been a fair amount of research on wavelet thresholding and threshold selection for signal de-noising [1], [3]-[10], [12],Images are often contaminated by noise during i) Acquisition ii) storage iii) Transmission Which effect mostly in Degradation at the quality of the images.
Wavelet denoising attempts to remove the noise present in the image while preserving its characteristics. It is different from smoothing as smoothing only removes high frequency while retaining the lower ones
2.
T
YPES OF
N
OISE
M
ODELING
Noise is nothing but an unwanted signal which affects the original data or image .Images are pretentious by different types of noise such as Gaussian noise , Salt and Pepper noise, Poisson Noise, Speckle Noise, etc.
A.Additive noise
International Journal of Research
Available at https://edupediapublications.org/journals e-ISSN: 2348-795X Volume 04 Issue 07
June 2017
Available online:
http://edupediapublications.org/journals/index.php/IJR/
P a g e | 1671B.Multiplicative noise
The intensity of the noise varies with the signal intensity (e.g., speckle noise). Impulsive noise is also called as salt-and- pepper noise or spike noise. This kind of noise is usually seen on images. It consists of white and black pixels. An image containing salt and pepper noise consists of two regions i.e. bright and dark regions. Bright regions consist of dark pixels whereas dark regions consist of bright pixels. Transmitted bit errors, analog-to-digital converter errors and dead pixels contain this type of noise.
C.Speckle Noise
Speckle noise is a multiplicative noise. It is a granular noise that commonly exists in and the active radar and synthetic aperture radar (SAR) images. Speckle noise increases the mean grey level of a local area. It is causing difficulties for image analysis in SAR images .It is mainly due to coherent processing of backscattered signals from multiple distributed targets.
3.
W
AVELET
P
ACKET
T
REE
A. The wavelet packet technique is a generalization of wavelet decomposition which gives a richer signal analysis. Wavelet packet atoms are waveforms indexed by three naturally interpreted parameters i.e. position, scale (as in wavelet decomposition), and frequency. For a given orthogonal wavelet function, we generate a library of bases called wavelet packet bases. Each of these bases offers a particular way of coding signals, preserving global energy, and reconstructing exact features. The wavelet packets can be used for numerous expansions of a given signal.
B. Wavelets to wavelet packets decomposing. The orthogonal wavelet decomposition procedure splits the approximation coefficients into two parts. After splitting we obtain a vector of approximation coefficients and a vector of detail coefficients both at a coarser scale. The information lost between two successive approximations is captured in the detail coefficients. Then the new approximation coefficient vector is split again. In the wavelet packet approach,
each detail coefficient vector also decomposed into two parts as in approximation vector splitting. An idea of wavelet packet is the same as wavelet. Only difference is that wavelet packet offers a more complex and flexible analysis. In wavelet packet analysis the details as well as the approximation are split.
4.
T
HRESHOLDING
Wavelet thresholding is indirectly signal estimation technique that makes full use of the ability of wavelet transform for signal denoising. It eliminate noise by killing coefficients that are unimportant relative to some threshold, and turns out o be simple and effective, depends majorly on the selection of a thresholding criteria and this selected threshold determines, to a great extent the efficiency, of de-noising Wavelet It is a simple non-linear method, which operates on one wavelet coefficient at a time. Basically, each coefficient & threshold is matched with each other, if the threshold is higher than coefficient, set to zero, apart from that. It is kept as it is & other coefficient is revising & changes the small noisy coefficients by zero. And inverse wavelet transform on the result may lead to reconstruction with the essential signal characteristics and with less noise. Since the work of Donoho & Johnstone [1], [4], [9],[10], there has been much research on finding thresholds, however few are specifically designed for images.
5.
T
HRESHOLD
S
ELECTION
C
RITERIA
As we seen that, threshold selection is an important question when arise the denoising. A small threshold may gets result close to the input, but the result may still be noisy. A large threshold on the other side, produces a signal with a large number of zero coefficients which leads to a smooth signal. Paying too much attention to smoothness, though, destroys details and in image processing may cause blur and artifacts.
6.
T
HRESHOLDING
M
ETHOD
(i) Hard thresholding, (ii) Soft thresholding,
In our execution, soft thresholding results in better denoising performance than other denoising methods therefore soft thresholding method is used to analyze the performance of denoising system for different levels of DWT decomposition. Soft thresholding cause less severe distortion of the object than distinct thresholding methods. Several way have been demonstrate for setting the threshold for each band of the wavelet decomposition.
Image Thresholding a) Original Image b) Hard Thresholding c) Soft Thresholding
7.
L
ITERATURE
R
EVIEW
[1]. F. Xiaoa et al. demonstrated a technique Wavelet based image denoising which is the basic of wavelet-based de-noising through thresholding. several natural gray scale test images like Lina, Barbara of size 512 X 512 at different noise levels are 10, 20, 30, 35 with soft thresholding and semi-soft thresholding with discrete Mayer filter having 4th level decomposition are used to evaluate these threshold selection algorithms are used to explore various Properties of image denoising algorithm and quantitative comparison between these techniques through MSE and PSNR.
[2] Z. Weipeng et al. Presented method with merging two-dimensional discrete wavelet transform and bilateral. for this purpose two images of coal-mine refuge chamber in different scenes are selected as original images .First the wavelet transform is adopted to break down the image of safety enclosure and low frequency component of subject image remains unchanged. Then, 3 high-frequency elements are activated by bilateral filtering, and the image is reconstructed. While supplying better optical effect and ultimately terminate that integrating wavelet transform and bilateral filtering collectively, can in effect destruct image noises of refuge chamber, and result comparison given in this paper depending on Comparison of information entropy, standard deviation and mean gradient after applying bilateral filtering based on wavelet transform.
[3] C. chen et al.,proposed method uses the digital complex ridge let transform to denoising some standard images such as lina, MRI image and Thumb Impression image having Gaussian white noise. Hard thresholding of the complex ridge let coefficients is used. their experiment Results show that this new method performs VisuShrink, the ordinary ridge let image denoising, and wiener2 filter both in terms of peak signal-to-noise ratio and in visual quality. In particular, this method preserves sharp edges better while.
8.
IMAGE DENOISING USING
WAVELET AND THRESHOLDING IS
CARRIED OUT IN FOLLOWING
STEPS
International Journal of Research
Available at https://edupediapublications.org/journals e-ISSN: 2348-795X Volume 04 Issue 07
June 2017
Available online:
http://edupediapublications.org/journals/index.php/IJR/
P a g e | 1673 pepper noise of variance 0.1 is added in to selectedimage from wavelet toolbox as shown in figure 4. Step 3: These Noisy images are decomposed using different wavelet transforms such as db4, haar and sym4 for example haar Wavelet Transform is applied to these noisy images
Step 4: First level or second level decomposition is applied to these noisy image.
Step 5: now for different wavelet transforms, we are doing Soft Thresholding at each decomposition level of an image for different wavelet transforms. At each level the value of threshold is different for example at the end the inverse of the wavelet transform has been performed to get the denoised image
Step 6: Finally the inverse of the wavelet transform has been performed to get the denoised image as shown in figure 5 and The performance of various wavelet transforms has been compared with the help of various parameters such as Peak signal to Noise Ratio (PSNR), Signal to Noise Ratio (SNR) and Mean Square Error (MSE).
9.
E
XPERIMENTAL
R
ESULT
Two parameters, PSNR (peak signal to noise ratio) and MSE (Mean square Error) are calculated for all the denoised images.
Mean Square Error (MSE):
Mean Square Error (MSE) is defining as the average of square of the error. Error is difference between desire quantity and estimated quantity. The Mean Square Error (MSE) provides a means of choosing the best estimator. We also calculate Root Mean Square Deviation taking the square root of Mean Square Error (MSE), it is also good statistic parameter for measure quality of image. Having a Mean Square Error of zero (0)is ideal. Lower the MSE produces good denoising result, The Mean Square Error (MSE) is defined and used to calculate error metrics used to compare the various image compression techniques are the Mean Square Error (MSE). Where f (i,j) is the original image, F (i,j) is the approximated version (which is actually the
decompressed image) and N or M are the dimensions of the images .
In statistics, the mean squared error (MSE) or
mean squared deviation (MSD) of an estimator (of a
procedure for estimating an unobserved quantity)
measures the average of the squares of the errors or
deviations—that is, the difference between the
estimator and what is estimated.
Fig.1 Color Images with different noise Present in it.
Original Image
Apply Inverse Wavelet Transform Add AWGN and salt and pepper noise
Noisy Image
Apply Haar or Db4 or Sym4 Wavelet Transform
Apply First and Second Level of decomposition
Apply Soft or Hard Thresholding
Fig. 2: Wavelet Denoising Algorithm form Haar,
Db4 and Sym4.
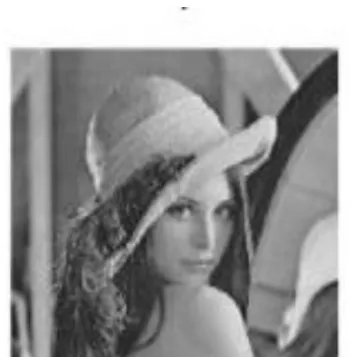
Fig. 3: Selected original lina Image from MATLB database.
Fig. 4: Noisy lina Image a) lina with AWGN .01 variance
Fig. 4: b) lina with Salt Peeper .1 variance
Fig. 5: Denoised Image
10.
R
ESULTS AND
A
NALYSIS
International Journal of Research
Available at https://edupediapublications.org/journals Volume 04 Issue 07 e-ISSN: 2348-795X June 2017
Available online:
http://edupediapublications.org/journals/index.php/IJR/
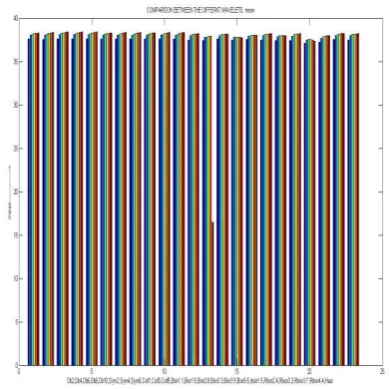
P a g e | 1675 Fig. 7 Resulted Graph Plotted Figure SNRFig. 8.Resulted Plotted Graph Figure 3 P_SNR
Fig. 9 Resulted Graph Plotted Figure 4. Mean
11.
C
ONCLUSION
In this paper general famous algorithms for denoising natural images were explore and their performance was comparatively studied.using soft thresholding, A new algorithm based on the haar, db4 and sym4 wavelet transform was developed. Its performance was shown to be competitive with or exceeding the performance of other algorithms. In addition, it has been shown to the advantage of implementation simplicity. There are different types of noises that may corrupt a natural and its characteristics were studied and as per result and comparison, and previous literature say lower MSE of images gives good denoising result mean clear denoised image and higher PSNR values produces good quality of decomposed
Future Scope
The same proposed work can be applied for videos and the quality of video is improved to great extent.
R
EFERENCES
[1] D.L. Donoho, De-Noising by Soft Thresholding,IEEE Trans. Info. Theory 43, pp. 933-936, 1993,
and itsmethod noise thresholding”, Optik 124, science direct, PP. 5756- 5760, 2013.
[3] S. Grace Chang, Bin Yu and M. Vattereli, Adaptive Wavelet
[4] D.L. Donoho and I.M. Johnstone, Adapting to unknown smoothness via wavelet shrinkage, Journal of American Statistical Assoc., Vol. 90, no. 432, pp 1200-1224, Dec. 1995Norwood, MA: Artech House, 2000.
[5] Thresholding for Image Denoising and Compression, IEEE Trans. Image Processing, vol. 9, pp. 1532-1546, Sept. 2000.”
[6]Pawan Patidar, Manoj Gupta,Sumit Srivastava, Ashok Kumar Nagawat, “Image De-noising by Various Filters for Different Noise”, International Journal of Computer Applications, Vol.9, No.4, November 2010..
[7]G. Kutyniok, D. Labate,“ Resolution of the wavefront set using continuous shear-lets”, Trans. Amer. Math. Soc. 361 (2009) 2719932754
[8] D. Gnanadurai, V. Sadasivam, J. Paul Tiburtius Nishandh, L. Muthukumaran, C. Annamalai, “Undecimated double density wavelet transformbased speckle reduction in sar images”, Comput. Electr. Eng. (2009)209217.
[9] D.L. Donoho and I.M. Johnstone, Ideal spatial adaptation via wavelet shrinkage, Biometrica, Vol. 81, pp. 425-455,1994.
[10] D.L. Donoho and I.M. Johnstone, Wavelet shrinkage: Asymptopia?, J.R. Stat. Soc. B, ser. B, Vol. 57, no. 2, pp. 301-369, 1995.”.
[11] G.Y. Chen, B. Kgl,“Image denoising with complex ridgelets”,science direct. Pattern Recognition 40 (2007) 578 - 585