International Journal Advances in Social Science and Humanities
Available online at: www.ijassh.com
RESEARCH ARTICLE
Changing Pattern of Crops and Land use during Post Reform Period in
Haryana: A Geographical Analysis
Asha Lata*
Dept. of Geography, F.G.M. P.G. College, Adampur, Hisar, Haryana,India.
*Corresponding Author: Email: [email protected]
Abstract
The study of changing pattern of crops and land use involves the description of area under various crops and changes there in during a certain period of time which gives a clue to understand the option preferred by farmers. The extent of changes in cropping pattern varies considerably among different regions of Haryana depending upon variations in their agro-climatic factors and infrastructural facilities. The main objective of this paper have been to examine changes in cropping pattern in different agro climatic regions of Haryana State during post reform period. The above analysis concluded that the cultivable area under wheat and rice have increase considerably since 1990-92 while it has decreases in rest of the crops which is against the manifest objective of economic liberalization policy because the wheat-rice monoculture pattern leads to biological problems besides, reduced soil fertility. Thus, the situation required rectification recognized the importance of crop rotations and bio diversity in maintaining sustainable agricultural production system in the state.
Keywords: Cropping Pattern, Agro Climatic Regions.
Introduction
Change in crop land use pattern is a significant feature in the agricultural landscape of a region. Haryana, being an agriculturally rich state with various physiographic dimensions, presents variations in agro-climatic conditions. Such variations have led to the evolution of regional niches for various crops. Historically, regions were often associated with the crops in which they specialize for various agronomic, climatic, hydro-geological, and even, historical reasons. But, in
the aftermath of technological changes
encompassing biochemical and irrigation
technologies, the agronomic niches are
undergoing significant changes. With the advent of irrigation and new farm technologies, the yield level of most crops especially that of cereals has witnessed an upward shift. Besides, as agriculture become drought proof and growth become more regionally balanced, there has been a reduction in the instability of agricultural output.
Aims and Objectives
The main objective of this paper have been to examine changes in cropping pattern in different agro climatic regions of Haryana State during post reform period. The analyses have been done by categorizing the state of Haryana in to four agro climatic regions.
Data Base and Research Methodology
Haryana consists of different agro climatic zones which are conducive for different variety of crops. To facilitate the analysis of data and to make the study more useful in planning and research for agricultural development, Haryana State has been divided into four homogeneous agro climatic zones which are as under. The administrative division district is considered as an aerial unit to show crop land use pattern in general and also their changes within the agro climatic zones.Sr. Zone Districts included
1 Northern Panchkula, Ambala, Yamunanagar, Kurukshetra,Karnal, Panipat
2. Central Kaithal, Jind, Sonipat, Rohtak, Jhajjar
3 Western Bhiwani, Hisar, Fatehabad, Sirsa
Changes in cropping pattern have been examined in terms of changes in percentage share of individual crops in total cropped area during post reform period. At each point of time, three yearly averages of data on area under individual crops have been taken and used for working out share in total cropped area. The minor crops, for which separate analysis could not be done, have been grouped in the category of residual crops. The points at which the analysis of cropping pattern has been done are 1990-92 1nd 2010-12.
An examination of data on the magnitude of area gained and lost by individual crop between 1990-92 and 2010-12 indicates that the actual gain in cropped area in Kharif season was 360.7 thousand hectare, in Rabi season 184.4 thousand hectare, and by residual crop 193 thousand hectares, but, out of this total increase in the net sown area and the remaining 543.2 thousand hectares through increase in intensity of cropping and increase in net sown area. Among the major crops gaining
large amount area in Kharif season, during the period covered in the study are Rice and Bajara, each gaining, respectively, about 427 thousand hectare and 25 thousand hectares. Among the crops losing substantial amount of cropped area are Jowar, Maize, Sugarcane and Cotton.
So far as the Rabi crops are concerned, Wheat gained as much as 587.6 thousand hectares. On the other hand, Gram lost 338.2 thousand hectare, Barley 17.3 thousand hectares and Rapeseed and Mustured 47.7 thousand hectares. When the area increase of crops that have gained near between 1990-92 and 2010-12 is added up, it works out to be about 1078 thousand hectares. Since the increase in total cropped area was only about 373.2 thousand hectares, the area gained by crops through shifts of area from other crops works out to be 704.5 thousand hectares. Thus, shift in area has been relatively more important source of change in cropping pattern than the increase in total cropped area in Haryana state.
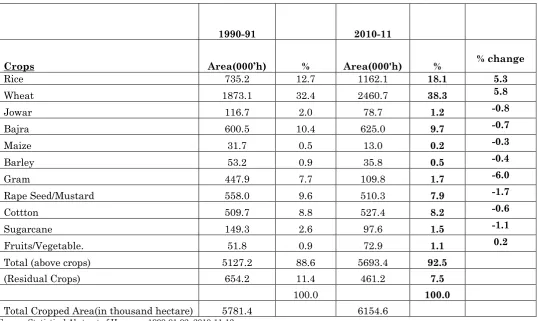
Table 1.1: Change in percentage of total cropped area under different crops in Haryana state, 199092 -2010-12
1990-91 2010-11
Crops Area(000’h) % Area(000'h) % % change
Rice 735.2 12.7 1162.1 18.1 5.3
Wheat 1873.1 32.4 2460.7 38.3 5.8
Jowar 116.7 2.0 78.7 1.2 -0.8
Bajra 600.5 10.4 625.0 9.7 -0.7
Maize 31.7 0.5 13.0 0.2 -0.3
Barley 53.2 0.9 35.8 0.5 -0.4
Gram 447.9 7.7 109.8 1.7 -6.0
Rape Seed/Mustard 558.0 9.6 510.3 7.9 -1.7
Cottton 509.7 8.8 527.4 8.2 -0.6
Sugarcane 149.3 2.6 97.6 1.5 -1.1
Fruits/Vegetable. 51.8 0.9 72.9 1.1 0.2
Total (above crops) 5127.2 88.6 5693.4 92.5
(Residual Crops) 654.2 11.4 461.2 7.5
100.0 100.0
Total Cropped Area(in thousand hectare) 5781.4 6154.6
Source: Statistical Abstract of Haryana, 1990-91-92, 2010-11-12.
The cropping pattern of Haryana state during post reform period is presented in the table 1.1. As evident from the table that rice in Kharif season and wheat in Rabi have gained substantial proportion of the total cropped area. Wheat which accounted for only 32.4 percent of the total cropped area in 1990-91, increased its share 38.3 percent in 2010-12. Similarly, rice increased its
at the problem of population explosion, India cannot afford a significant shift of cropland from food grain to green fodders. Therefore, any major shift and improvement must wait for a reduction in the rate of natural growth of population and swing from agriculturalisation to industrialization in rural environment. It is observed that the area under gram has recorded sharp declined from 7.7 percent in 1990-91 to 1.7 percent in 2010-12. With the spread of irrigation, cultivation of gram has given way to what because of lack of
breakthrough in technology in case of gram. The area under cotton decreased from 8.8 percent in 1990-91 to 8.2 percent in 2010-12. On the other hand, the area under sugarcane instead of rise in support price being enhanced and opening up of more sugar mills in the state declined from 2.6 percent in 1990-91 to 1.5 percent in 2010-11. During 1990-92 to 2010-12, the share of area under rapeseed and mustered decreased from 9.6 to 7.9 percent. During post reform period the area share of residual crops decreased from 11.4 to 7.5.
Table 1.2: Change in percentage share of individual crops in total cropped area in northern region
1990-92 2010-12
CROPS Area(000h) % Area(000h) % % Change
WHEAT 491.8 39.3 545.3 42.4 3.09
RICE 403.3 32.2 530.9 41.3 9.04
JOWAR 1.2 0.1 1.8 0.1 0.04
BAJARA 5 0.4 4.3 0.3 -0.1
MAIZE 28.3 2.2 8.5 0.6 -1.6
BARLEY 2.7 0.2 0 0 -0.2
Rapseed &Mustered 8.5 0.6 8 0.6 -0.1
COTTON 2.6 0.2 0.3 0.02 -0.2
SUGARCANE 77.2 6.6 62.2 4.8 -1.3
GRAM 8.5 0.6 1.1 0.09 -0.6
FRUITS/VEGE. 24.3 1.9 26.2 2.04 0.09
Total (above crops) 1053.4 84.2 1188.6 92.4 8.21
Residual Crops 197.6 15.8 97.5 7.6
Total 100.0 100.0
TOTAL CROPPED AREA 1251 1286.1
(in thousand hactare)
Source: Statistical Abstract of Haryana, 1990-91-92, 2010-11-12.
The changes in cropping pattern in region of Haryana during post reform period are examined in the following.
The percentage share of individual area in northern region post reform period presented in table 1.2, which indicates that Rice –Wheat cropping system was prominent in the region in 1990-92, as rice accounted for 32.2 percent and wheat accounted for 39.3 percent of the total cropped area. Sugarcane in Kharif season and Rapseed and Mustured in Rabi season were the two important crops and accounted for about 6.6 percent and 0.6 percent of the total cropped area, respectively. Maize and Rapeseed and Mustured were also quite important as they respectively, accounted for about 2.2 percent and 0.6 percent of the total cropped area. Gram and Cotton accounted area in 1990-92. The area share of area
under of residual crops was 15.8 percent, fruits and vegetable 1.9 percent and remaining crops less than 0.5 percent. it is thus clear from the above that the cropping pattern was dominated by Rice and Wheat in Rabi season in 1990-92.
Table1.3: Change in Percentage share of individual crops in total cropped area in Central Region
CROPS 1990-92 In Percent 2010-12 In Percent Change
WHEAT 536.4 36.7 722.4 44.6 7.9
RICE 189.3 12.9 423.6 26.1 13.0
JOWAR 73.0 5.0 49.4 3.1 -1.9
BAJARA 109.5 7.4 123.4 7.6 0.1
MAIZE 2.1 0.1 1.2 0.1 -0.1
BARLEY 10.3 0.7 5.1 0.3 -0.4
RAPE/MUST. 98.9 6.7 53.8 3.3 -3.4
COTTON 66.8 4.5 57.8 3.6 -1.0
SUGARCANE 43.5 2.9 16.3 1.1 -2.0
GRAM 50.6 3.4 1.7 0.1 -3.4
FRUITS/VEGE. 13.6 0.9 14.0 0.9 -0.1
Total(above crops) 1194 81.6 1468.7 90.5 8.9 Residual Crops 269.5 18.4 152.8 9.5
Total 100.0 100.0
TOTAL CROPPED AREA 1463.5 1621.5
(in thousand hactare)
Source: Statistical Abstract of Haryana, 1990-91-92, 2010-11-12.
The cropping pattern of central region during post reform period is presented in table 1.2. It is clear from the table that the cropping pattern of this region was dominated by Rice and Bajara in Kharif season and Wheat and Rapeseed and Mustered in Rabi season in 1990-92. The share of total cropped area under Wheat was 36.7 percent, Rice 12.9 percent, Bajara 7.5 percent, Rapeseed and Mustured 6.7 percent and Jowar 5.0 percent in 1990-92. The area under cotton, Sugarcane and Gram was less than 5 percent. None of the
remaining crops except Barley occupied even one percent of the total cropped area in 1990-92. The cropping pattern prevailing in 1990-92 got substantially changed during post reform period. The change was the most spectacular in the case of Rice whose area share increased to 44.6 percent in 2010-12. Change in share of area under other crops is also quite important. Except, Jowar all remaining crops declined to a certain extent. The share of residual crops decreased from about 18.4 percent to 9.5 percent during post reform period.
Table 1.4: Change in percentage share of individual crops in total cropped area in western region
1990-92 2010-12
CROPS Area(000h) % Area(000h) % % Change
WHEAT 534.2 24.4 837.3 33.5 9.1
RICE 61.2 2.8 204.4 8.2 5.4
JOWAR 2.5 0.1 4.3 0.2 0.1
BAJARA 267.6 12.2 228.7 9.1 -3.1
MAIZE 0.9 0.04 0.2 0.01 -0.03
BARLEY 15.4 0.7 30.8 1.2 0.5
RAPE/MUST. 196.2 8.9 248.3 9.9 1
COTTON 453.2 20.7 424.8 16.9 -3.8
SUGARCANE 5.5 0.25 2.6 0.1 -15
GRAM 448.2 20.5 94.2 3.7 -16.8
FRUITS/VEGE. 6.4 0.3 15.5 0.6 0.3
Total 1991.3 91.1 2091.1 83.6 -7.5
Residual Crops 195.2 8.9 410.8 16.6
Total 100 100
TOTAL CROPPED AREA 2186.5 2501.9 (in thousand hactare)
The cropping pattern of this region during post reform period is presented in the table 1.4. it is important to note from the table that Wheat is the most important crop, followed by Cotton and Gram. Wheat still remains the most important crop in this region. The change was the most spectacular in the case of Gram whose area share declined from 20.5 to 3.7 during 1990-92 to 2010-12. The percent share of Bajara declined from
12.2 to 9.1, Cotton 20.7 to 16.9. On the other hand, percentage share of area under wheat increased from 24.4 to 33.5 and Rapeseed and Musturd from 8.9 to 9.9 percent. The region of Haryana appears to have the best potential for increasing area in favour of Oilseeds and Pulses. In the region, area under Wheat and Rice has shown the Sharpest increased.
Table 1.5: Change in percentage share of individual crops in total cropped area in southern region
1990-92 2010-12
CROPS Area(000h) % Area(000h) % % Change
WHEAT 293.2 29.8 347.0 34.1 4.3
RICE 8.6 0.9 61.1 6.0 5.1
JOWAR 51.2 5.2 22.6 2.2 -3.0
BAJARA 225.6 22.9 222.3 21.8 -1.1
MAIZE 1.9 0.2 0.0 0.0 -0.2
BARLEY 22.1 2.2 6.3 0.6 -1.6
RAPE/MUST. 194.7 19.8 197.4 19.4 -0.4
COTTON 1.1 0.1 1.7 0.2 0.1
SUGARCANE 9.6 0.9 3.5 0.3 -0.6
GRAM 78.5 7.9 9.1 0.9 -7.0
FRUITS/VEGE. 7.3 0.7 11.7 1.2 0.5
Total 893.8 90.7 882.7 86.7 -4.0
Residual Crops 91.2 9.3 135.2 13.3
Total 100.0 100.0
TOTAL CROPPED AREA 985.0 1017.9
(in thousand hactare)
Source: Statistical Abstract of Haryana, 1990-91-92, 2010-11-12.
The data on percentage share of individual crops in total cropped area during post reform period is presented in the table 1.5 for this region. An examination of the data presented in the table reveals that the cropping pattern of this region reveals that the cropping pattern of this region has shifted substantially in favour of Wheat and rice against gram, Bajara and Barley crops. Most of the other crops also lost their share in the total cropped area. Among the important crops, the percentage share of area under Wheat increased from 29.8 to 34.1 and Rice from 0.9 to 6.0 percent, while it declined under Gram from7.9 to 0.9, Bajara from 22.9 to 21.8 between 1990-92 and 2010-12. The share of are under remaining minor crops either remained constant or declined to a certain extent. The share of area under residual crops increased from 9.3 percent to 13.3 percent.
Conclusion
The above analysis concluded that the cultivable area under wheat and rice have increase considerably since 1990-92 while it has decreases in rest of the crops which is against the manifest
objective of economic liberalization policy because the wheat-rice monoculture pattern leads to biological problems besides, reduced soil fertility. Thus, the situation required rectification recognized the importance of crop rotations and
bio diversity in maintaining sustainable
agricultural production system in the state. Results indicate that the production performance of the more enumerative crops, such as wheat and rice, is generally greater than that of less enumerative crops such as pearl millet and chickpeas. The study concludes that value productivity and profitability of crops are determining factors of change. On the other hand, there are more or less continuous decrees in the area under pulses, and total food gains from 1990-92 to 2010-12. There is an argent need to make all possible efforts to increase area under pulses (and food grains) as it is a very essential food item (protein) of the daily diet of the people and its role in soil fertility maintenance
The land utilization statistics of Haryana state
geographical area is under cultivation. As regards changes in cropping pattern, the share of area under wheat increased from 32.4 percent to 38.3 percent and rice from 12.7 percent to 18.1 percent during post reform period, while the share of area under bajara declined from 10.4 percent to 9.7 percent and gram from7.7 percent to 1.7 percent. All of the other crops, except fruits and vegetables, lost their share in total cropped area. As regards the cropping pattern of individual regions, the rice-wheat system of cropping was
prominent in northern region in 1990-92 and
became much more prominent by 2010-12. The share of total cropped area of rice increased from 32.2 percent to 41.3 percent and wheat from 39.3 percent to 42.4 percent during post reform period. Maize in Kharif season and Sugarcane in Rabi season were the next the next important crops whose share in gross cropped area declined from 2.2 percent to 0.6 percent and 6.6 percent to 4.5 percent, respectively, during the period. The share of area under most of the remaining crops also declined substantially over the years. The
cropping pattern of central region, which was
dominated by bajara and rice in kharif season wheat and gram in Rabi seasons 1990-92, got substantially changed during post reform period. The changes were the most spectacular in the case of rice and gram whereas the share of rice
increased from 12.9 to 26.8 percent and the share of gram declined from 3.4 to 0.1 percent. Wheat whose share in total cropped area increased from 36.7 percent to 44.6 percent during post reform period. Thus, wheat, rice and rapeseed and mustered are the high yielding crops and the main gainer of the area in the region.
In the cropping pattern of the western region,
wheat was the most important crop followed by cotton, gram and bajara in 1990-92, their respective share in total cropped area being 24.4 percent, 20.7 percent, 20.5 percent and 12.2 percent. But by 2010-12, the percentage share of these crops changed to 33.5 percent, 16.9 percent, 3.7 percent and 9.1 percent, respectively. The share of rice increased from 2.8 percent to 8.2 percent and rapeseed and mustard from 8.9 to 9.9
percent. The cropping pattern of the southern
region has shifted substantially in favour of wheat and rapeseed and mustard and against gram, bajara and barley crops. Except rice crop, whose share increased from 0.9 percent to 6.0 percent, most of the other crops lost their share in the total cropped area. The dry land crops still remain important in the region. Rapeseed and mustard seems to be having very good prospect of gaining area in the region [1-6].
Suggestions
The dominance of wheat-rice rotation needs to be broke down. Maize, Soyabean and Pulses in kharif season is good alternative crop that can be grown in Haryana. Bringing in more areas under maize (which requires one sixth water as against paddy) cultivation from existing paddy cultivation will help conserve precious ground water resources. Noting that technological fatigue was a major challenge before farm sector, the yield
potential of existing crop verities had already reached plateau and genetic breakthrough was urgently required for quantum jump in output. Observing that seed replacement rate of various crop especially of pulses and paddy was poor, it laid stress on development of heat tolerance varieties of wheat salinity resistant of oilseeds and pulses.
References
1. Chand R, Haque T (1997) Sustainability of Rice-Wheat Crop System in Indo-Gangetic Region. Economic and Political Weekly, p. 26-30.
2. Singh JP (1992) Changing Pattern Of Crops and Land use In Haryana” Mohammad, Noor,(eds.), Dimentions in Agriculture Geography, Concept Publication company, p, 133-152.
3. Muthili G (2008) Acreage and yield Response for major crops in the pre and Post-Reform Periods in India: A Dynamic panel Data Approach” IGIDR-ERS/USDA Project Report: Agricultural markets
and Policy.
http://www.igidr.ac.in/Pdf/Publication/pp-061.pdf.
4. Dhindsa KS, Sharma A (1995) Analysis of Cropping Pattern in Punjab During 1965-66 to 1090-91. Indian Economic Review, Vol. XXX, No. 1.
5. Mahendera Dev S (1987) Growth and instability in foodgrains production: A interstate analysis. Economic and Political Weekly, 22 (39) A82-A92. 6. Ramasamy C, Selvaraj KN (2002) Pulses, oilseeds