Characterization and Applications of Single-Domain Antibody Mimics against ErbB3
Yingqiu Zhou
A thesis submitted to the faculty at the University of North Carolina at Chapel Hill in partial fulfillment of the requirements for the degree of Master of Science in
Pharmaceutical Sciences in the School of Pharmacy
Chapel Hill 2016
ii 2016 Yingqiu Zhou
iii
ABSTRACT
YINGQIU ZHOU: CHARACTERIZATION AND APPLICATIONS OF SINGLE-DOMAIN ANTIBODY MIMICS AGAINST ERBB3
(Under the direction of Rihe Liu)
iv
v
To my family and friends.
vi
ACKNOWLEDGEMENT
I would like to thank all the people that makes this thesis possible. Five years of graduate school is such a long journey, and without the supports from my family and friends, I would never get through all the difficulties and hardship, and find a new path in my life.
I would like to express my sincerest gratitude to my advisor, Dr. Rihe Liu, and the previous and current lab members, especially to Dr. Jianwei Zou, Dr. Dongwook Kim, Dr. Adam Friedman, Lu Zhang for their continuous support and inspiration in the field of scientific research and drug discovery. Working with the team gave me invaluable experience in problem solving and critical thinking.
I really appreciate the help from my colleagues in collaborations and the staff from UNC core facilities, especially Dr. Hui Wang and Mengzhe Wang from Dr. Zibo Li’s lab, Dr. Ashutosh Tripathy from UNC Macromolecular Interactions Facility, people in CICBDD, and the staff in UNC microscopy service laboratory and UNC flow cytometry core facility.
vii
I am so grateful to my friends I met here in the pharmaceutical sciences program, especially Jingxian Chen from DPET, Xiaomeng Wan and Dongfen Yuan from MOPH for their expertise in research and spiritual supports.
viii
TABLE OF CONTENTS
LIST OF TABLES ... x
LIST OF FIGURES... xi
LIST OF ABBREIATIONS ... xiii
CHAPTER 1 Introduction ... 1
Targeted Cancer Therapy ... 1
The ErbB family and cancer ... 2
Targeting ErbB receptors for cancer treatment ... 5
Targeting ErbB3 and combination therapies ... 6
CHAPTER 2 Characterization of the pre-selected single-domain antibody mimics against ErbB3 ... 14
Introduction ... 14
Materials and Methods ... 16
Result ... 19
Pre-selected SDAs with distinct sequences shows good solubility and level of expression ... 19
SDAHER3-A1 and SDAHER3-D5showed great binding affinity to ErbB3 in vitro and selectively binds to ErbB3-positive cells ... 19
Discussion ... 21
ChAPTER 3 Generation and characterization of a biparatopic ErbB3 -targeting SDAHER3 ... 29
ix
Materials and Methods ... 31
Result ... 34
Construction, expression and purification of SDAHER3-D5A1 and SDAHER3-D5A1-Cys ... 34
SDAHER3-D5A1 binds to ErbB3 with picomolar affinity and specificity in vitro, and it selectively binds to ErbB3-positive cells ... 34
Competition assay supported that SDAHER3-D5A1 is a biparatopic molecule and binds to ErbB3 ... 35
Cellular binding affinity of SDAHER3-D5A1 to ErbB3 -positive cell line ... 36
SDAHER3-D5A1 inhibited the NRG1 induced proliferation ... 36
Discussion ... 38
CHAPTER 4 Biparatopic ErbB3-targeting SDAHER3 as a theranostic agent ... 50
Introduction ... 50
Materials and Methods ... 52
Result ... 55
SDAHER3-D5A1 internalized through receptor-mediated endocytosis (RME) and targeted ErbB3-positive cells in hyperthermia treatment. ... 55
A combination of SDAHER3-D5A1 and Lapatinib showed improved inhibition efficiency in proliferation assay... 55
SDAHER3-D5A1 inhibited the ligand-induced activation of the downstream pathways ... 56
SDAHER3-D5A1-IRDye800 conjugate as fluorescence imaging probe for ErbB3-expressing cancers ... 57
Discussion ... 58
CHAPTER 5 General discussion ... 69
x
LIST OF TABLES
Table 1.1 ErbB receptor dimers and their ligands ... 11 Table 1.2 FDA approved small molecule drugs and antibody
drugs targeting EGFR and ErbB2 ... 12 Table 1.3 ErbB3 targeting antibodies in development and
xi
LIST OF FIGURES
Figure 1.1 ErbB family and the ligands, adapted47 ... 9
Figure 1.2 Signaling pathway of ErbB receptors, adapted from cellsignal.com... 10
Figure 2.1 Selection strategies by general elution and ligand-specific competitive elution. ... 23
Figure 2.2 The Changes in Recovery Percentages Show Enrichment in two Selections ... 24
Figure 2.3 The binding affinity of selected SDAHER3s against ErbB3 ECD-Fc in vitro by ProteOn XPR36 ... 25
Figure 2.4 The binding of SDAHER3-A1 and SDAHER3-D5 to ErbB3-positive ASPC1 cells were confirmed by confocal microscopy ... 26
Figure 2.5 Confocal microscopy confirmed that SDAHER3-A1 and SDAHER3-D5 did not bind to ErbB3-negative MDA-MB-231 cells ... 27
Figure 2.6 The WT-FN3 showed no binding to ErbB3-positive or ErbB3-negative cell lines by confocal microscopy ... 28
Figure 3.1 Purification of SDAHER3-D5A1 and SDAHER3-D5A1-Cys ... 40
Figure 3.2 The binding affinity of SDAHER3-D5A1 to ErbB3 ECD-Fc ... 41
Figure 3.3 Selectivity of SDAHER3-D5A1 to ErbB receptor family ... 42
Figure 3.4 Binding affinity of SDAHER3-D5A1 against ErbB4 ... 43
Figure 3.5 The binding curve of SDAHER3-A1, SDAHER3-D5 and SDAHER3-D5A1 to the extracellular domain of ErbB4... 44
Figure 3.6 SDAHER3-D5A1 selectively binds to ErbB3-positive cell line ... 45
Figure 3.7 Competition experiment with confocal microscopy supported the hypothesis that SDAHER3-D5A1 is biparatopic molecule ... 46
Figure 3.8 Flow Cytometry confirmed SDAHER3-D5A1 selectively bind to ErbB3-positive cell line with good binding affinity. ... 47
xii
Figure 3.10 SDAHER3-D5A1 showed growth inhibition to NRG1
stimulated proliferation for ErbB3-positive cell lines selectively ... 49 Figure 4.1 Internalization assay confirmed that SDAHER3-D5A1 bound
to ErbB3 receptors and got internalized after 2 hours incubation at 37 °C ... 60 Figure 4.2 Hyperthermia treatment using SDAHER3-D5A1-AuNP ... 61 Figure 4.3 Proliferation of MCF7 cells, treated with 500 nM SDAHER3
-D5A1, 5 μM Lapatinib, and a combination of protein and the drug ... 62 Figure 4.4 Proliferation of BT474 cells, treated with 500 nM SDAHER3
-D5A1, 5 μM Lapatinib (positive control), 25 nM Lapatinib and a
combination of protein and the drug ... 63 Figure 4.5 Proliferation of ErbB3-negative MDA-MB-231 cells,
treated with 500 nM SDAHER3-D5A1, 5 μM Lapatinib (positive control),
25 nM Lapatinib and a combination of protein and the drug... 64 Figure 4.6 Western blot analysis of SDAHER3-D5A1 and its effect on
the downstream pathways of MCF7 cells ... 65 Figure 4.7 Live imaging results from ASPC1 mouse xenograft models
with SDAHER3-D5A1-IRDye800, for 1 hour, 4 hours and 24
hours after injection. ... 66 Figure 4.8 The change in tumor:muscle ratio after injection of SDAHER3
-D5A1-IRDye800 or SDAHER3-D5A1-IRDye800 with 20 fold excess of unlabeled SDAHER3-D5A1 (as blocking agent) at 1 hours, 4 hours, 24 hours and 48 hours in ASPC1 mouse
xenograft model (Non-blocking: N = 7, Blocking: N =2)... 67 Figure 4.9 The change in tumor:muscle ratio after injection of SDAHER3
-D5A1-IRDye800 or SDAHER3-D5A1-IRDye800 with x 20 fold excess of unlabeled SDAHER3-D5A1 (as blocking agent) at 1 hours, 4 hours, 24 hours and 48 hours in PANC1 mouse xenograft model
xiii
LIST OF ABBREIATIONS
Abl Abelson
ADC antibody-drug conjugate AHC anti-human IgG Fc Capture Akt Protein kinase B (PKB) AR androgen receptor ATP Adenosine triphosphate AuNP gold nanoparticles BCR break point cluster BTC betacellulin
cDNA complementary DNA
CDR complementarity determining region CML chronic myelogenous leukemia CO2 carbon dioxide
Cy5.5 Cyainine 5.5
DAG Diacylglycerol kinase DMSO dimethyl sulfoxide E. coli Escherichia coli
EC50 half maximal effective concentration ECL electrogenerated chemiluminescence EDC extracellular domain
xiv EGFR epidermal growth factor receptor EPGN Epigen
EPR Epiregulin
ERK extracellular signal–regulated kinases FAK Focal Adhesion Kinase
FBS fetal bovine serum Fc fragment crystallizable
FDA Food and Drug Administration FN3 fibronectin type III domain HBGF Heparin-binding growth factor
HER human epidermal growth factor receptor HTS high-throughput screening
IC50 half maximal inhibitory concentration IGF-1R insulin-like growth factor 1
IgG immunoglobulin G
IPTG isopropyl-beta- D-thiogalactopyranoiside KD dissociation constant
kDa kilodalton LB lysogeny broth mAb monoclonal antibody
MAPK mitogen-activated protein kinase MEK Mitogen-activated protein kinase 1
xv mRNA messenger RNA
mTOR Mechanistic target of rapamycin Neu neuregulin
NRG1 Neuregulin-1
NSCLC non-small cell lung cancer OD Optical density
PAGE polyacrylamide gel electrophoresis PBS phosphate-buffered saline
PCR polymerase chain reaction PET positron emission tomography
PI3K Phosphatidylinositol-4,5-bisphosphate 3-kinase PKC Protein kinase C
PTB phosphotyrosine-binding domain PTEN Phosphatase and tensin homolog PTK protein tyrosine kinase
RAF Rapidly Accelerated Fibrosarcoma RAS ras superfamily
RET rearranged during transfection
RT-PCR reverse transcription polymerase chain reaction RTK receptor tyrosine kinase
xvi
Src Proto-oncogene tyrosine-protein kinase
STAT Signal Transducers and Activators of Transcription T-DM1 Trastuzumab emtansine
TCEP·HCl tris(2-carboxyethyl)phosphine, a hydrochloride salt TGF-α Transforming growth factor alpha
TKI tyrosine-kinase inhibitors TM transmembrane
Tm melting point
1
CHAPTER 1
Introduction
Targeted Cancer Therapy
Human cancer carries multiple mutations, including gene amplification,
microsatellite instability, chromosomal aberration and aneuploidy1. Numerous studies have linked such mutations and aberrations with various types of cancers2, which provides some valid background for designing targeted agents for cancer treatment. Targeted cancer therapy uses molecules to interfere specific target that plays a critical role in cancer growth and progression. Some popular targets includes kinases, cancer stem cells, microenvironment and combining targeted therapy with chemotherapy and the agents can be small molecules, antibodies or antisense inhibitors3,4. Among these, kinases are important targets for oncology drug discovery.
There are approximately 518 kinases encoded in human genome and many of them are involved in tumor proliferation and survival, such as ABL-fusion proteins, EGFR, KIT, PDGFR, FMS, VEGFR, FLT3, SRC-family (SFK) or cyclin-dependent
2
kinases inhibitors have already been approved by FDA and have reached the market for cancer treatment. From January 2012 to February 2015, there were 15 new
small-molecule kinase inhibitors approved by FDA8. Glivec (STI1571, imatinib) was the first kinase inhibitor approved by FDA to treat leukemia by targeting BCR-Abl9. Recent examples include Zydelig (Idelalisib), the first PI3K inhibitor, and Lenvima (Lenvatinib) targeting VEGFR family10–12. There have been great successes in kinases inhibitor discovery; however, there are growing concerns regarding the development of drug resistance. Usually, the targeted kinases are very important in cell metabolism survival and carries important functions. Therefore, the genetically unstable cancer cells may undergo compensation processes. Moreover, it may also contribute to the multiple binding surfaces or action through other mechanisms5. For example, some imatinib-resistant CML patients carry overexpressed BCR-ABL13. To overcome this problem, many preclinical studies tried to unveil drug-resistance mechanisms, improve the drug pharmacokinetic/pharmacodynamics properties, develop co-targeting strategies and develop new agents5.
The ErbB family and cancer
Tyrosine kinases are a subclass of protein kinases that transfer a phosphate group from ATP to another protein. Protein tyrosine kinases (PTK) can be categorized into two classes, receptor tyrosine kinases (RTK) and non-receptor tyrosine kinases. Receptor tyrosine kinases regulate many key functions of cells, such as cell growth, survival, organ morphogenesis, neovascularization, tissue repair and tissue
3
oligomeric complex. One RTK from the complex phosphorylates the neighboring tyrosine from another RTK. The phosphorylated tyrosine recruits the downstream signaling proteins later16. The ligand-binding induced dimerization activates multiple cytoplasmic signaling pathways, such as RAS/Raf – MAPK pathway, pI3K/Akt pathway and protein kinase C pathway4. The other mechanism of dimerization for most RTKs includes receptor-mediated or a combination of ligand-mediated and receptor mediated mode16. In normal cells, the activity of RTKs is strictly regulated. However, in many cancers, some RTKs are dysregulated or constitutively activated14. Thus, RTKs attract many attentions from researchers as promising therapeutic targets for cancer therapies.
To become a targeted RTK for cancer treatment, the RTK itself usually is a major regulator of cancer survival and/or proliferation14. EGFR is one of the earliest
discoveries in RTKs and related to cancer as an oncogene. In 1980s, the
overexpression of EGFR was reported in many epithelial tumors, with several deletions and/or point mutations15. EGFR is one of the ErbB receptors. In the search of
4
receptor17. As indicated above, ErbB3 is the only one in the family that does not contain kinase domain in its C-terminal tail18.
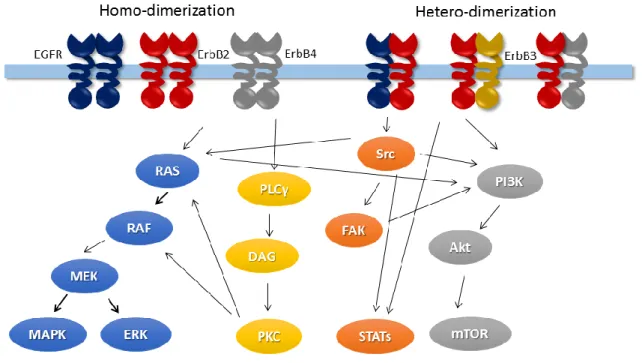
Similar to other protein kinases, ErbB receptors are activated by forming homo-/heterodimers. Dimerized receptors phosphorylate the C terminus and trigger the downstream signaling pathways. Table 1.1 shows the ErbB receptor dimers and their ligands. The dimerization of ErbB receptors suggest an effective approach to block ErbB-mediated transformations by identifying inhibitors disrupting the interactions19. The ErbB family involves in many important signaling pathways, as illustrated by Figure 1.2. For example, ErbB2 and EGFR can stimulate signaling proteins and pathways, including MAPK, PI3K/Akt and mTOR pathways, Src kinase, and STAT transcription factors20. The dysregulation of ErbB signaling pathways, such as mutations and/or overexpression, occurs in various cancers.
The overexpression, gene amplification or mutations of EGFR are found in many cancers, such as breast cancer, lung cancer, head and neck cancers, and highly
5
ErbB3 in cancers are discussed in the later sections. ErbB4 is the least studied ErbB receptor in the family. Some reports suggested its prognostic value in breast cancer25,26. Overall, the ErbB receptor family plays an important role in cancer proliferation and progression.
Targeting ErbB receptors for cancer treatment
The ErbB receptors and its ligands locate in the extracellular domain. There are several approaches targeting ErbB receptors, directly targeting the receptor by
monoclonal antibodies (mAbs) , synthetic small molecule tyrosine kinase inhibitors that inhibit the kinase domain of ErbB receptors and conjugating toxins with mABs18,22. ErbB receptors (except ErbB3) have inducible kinase activities at the C terminus and activate downstream pathways once activated. Even without bounded-ligand, overexpressed receptors may still have enhanced kinase activities. There are reversible and
irreversible inhibitors that target the kinase domains of ErbB receptors. Reversible inhibitors compete with the binding ATPs; while irreversible inhibitors react with a cysteine residue within the ATP-binding pocket and block the kinase activity
6
So far, FDA has approved six kinase inhibitors, five antibody drugs and one ADC targeting EGFR and/or ErbB2, as shown in Table 1.2. Some antibodies targeting ErbB3 are in pre-clinical and clinical trials, including mAbs against ErbB3, bispecific mAbs against ErbB3. Many of the drugs are very successful in treating ErbB2 positive tumors and non-small cell lung cancer (NSCLC) patients. However, there are observations that some patients developed resistance to trastuzumab27 or only responded to Gefitinib or erlotinib for only 6-12 months28. Several mechanisms contribute to the resistance to ErbB related cancer therapies. Gefinitib and erlotinib target the EGFRs with functional mutations in the kinase domain of the C-terminus. During the treatment, the cancer cells may develop drug-sensitive mutations. Trastuzumab cannot block the signaling
pathways of the cells that have autocrine EGFR activation or ligand-induced
dimerization of ErbB2 and its partners. The drug resistance may also develop through activation of other RTKs or the loss of lipid phosphate PTEN, which is a negative regulator of PI3K17,18,28,29. New therapeutic agents or drug combination may be use to overcome the issues with drug resistance.
Targeting ErbB3 and combination therapies
The role of ErbB3 in cancer development has been intensively studied in recent years. Structurally, it is very similar to other family members, except the impaired kinase domain in the C-terminus. The ligands for ErbB3 belong to NRG family, which contains an EGF like C-terminal region and varies in N-terminus30. ErbB3 serves as specialized allosteric activator and signaling substrate of EGFR, ErbB2 and ErbB431. In the
7
of ErbB3, which can bind to SH2 or PTB binding proteins and trigger the downstream pathways later31. Thus, ErbB3 is a potential activator for PI3K/Akt/mTOR pathway through its tyrosine sites on C-terminus, as well as Ras/Raf/MAPK pathways33. The PI3K/Akt/mTOR pathway play important role in tumorigenesis and is considered a major driven factor in drug resistance of cancer treatment34. ErbB3 shows its significance in the ErbB2-driven tumors and the drug resistance by the upregulation of ErbB3. The upregulated ErbB3 then directly or indirectly activates the PI3K signaling pathway in those tumors35. ErbB3 contributes to the drug resistance to EGFR-targeted therapy by the gene amplification of MET36. The upregulation of ErbB3 also shows its connection to acquired resistance to RAF/MEK inhibitors in melanoma and thyroid carcinoma35.
The overexpression of ErbB3 has been observed in primary cancers, including breast, ovarian, prostate, colon, pancreas, stomach, oral cavity and lung cancers30. There are direct and indirect strategies targeting ErbB3 for cancer treatment. The indirect strategies include targeting NRGs, PanHER inhibitors preventing the auto- and trans-phosphorylation of ErbB3 or targeting ErbB3 at transcriptional level37. As
mentioned in the previous section, ErbB3 is the only member in the family that lacks functional kinase domain. Although some small molecule inhibitors were designed to target the ATP-binding region of ErbB338–40, the direct ErbB3 targeting strategy is by using monoclonal antibodies. Patritumab is the first human antibody targeting ErbB3, which inhibits the ligand-induced phosphorylation of ErbB3, and the downstream
8
ErbB343. Other antibodies may promote the degradation of ErbB3 or prevent the
9
Figure 1.1 ErbB family and the ligands, adapted47
10
Figure 1.2 Signaling pathway of ErbB receptors, adapted from cellsignal.com
The ErbB family members activate downstream signaling pathways through homo- or hetero-dimerization. The downstream signaling pathways include MAPK/ERK,
11
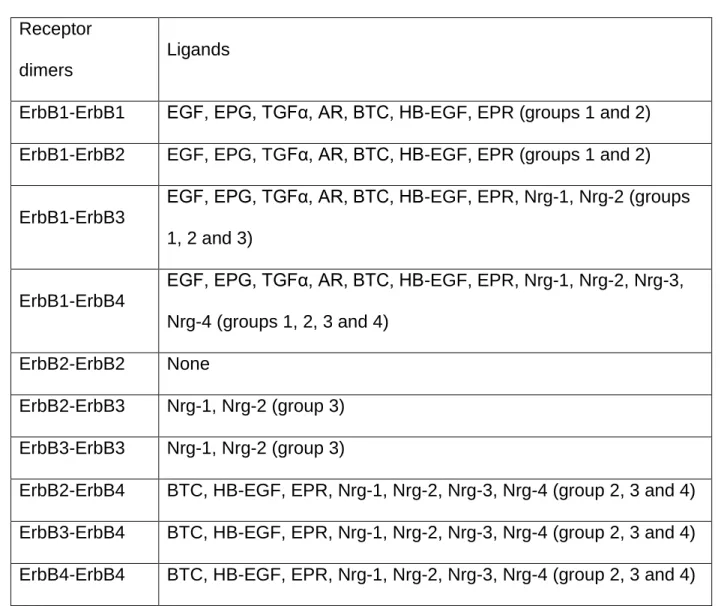
Table 1.1 ErbB receptor dimers and their ligands, adapted18
Receptor dimers
Ligands
ErbB1-ErbB1 EGF, EPG, TGFα, AR, BTC, HB-EGF, EPR (groups 1 and 2) ErbB1-ErbB2 EGF, EPG, TGFα, AR, BTC, HB-EGF, EPR (groups 1 and 2)
ErbB1-ErbB3
EGF, EPG, TGFα, AR, BTC, HB-EGF, EPR, Nrg-1, Nrg-2 (groups 1, 2 and 3)
ErbB1-ErbB4
EGF, EPG, TGFα, AR, BTC, HB-EGF, EPR, Nrg-1, Nrg-2, Nrg-3, Nrg-4 (groups 1, 2, 3 and 4)
ErbB2-ErbB2 None
ErbB2-ErbB3 Nrg-1, Nrg-2 (group 3) ErbB3-ErbB3 Nrg-1, Nrg-2 (group 3)
12
Table 1.2 FDA approved small molecule drugs and antibody drugs targeting EGFR and ErbB2
Drug Company Target Year
Small molecules
Afatinib/Gilotrif® Boehringer Ingelheim EGFR 2013
Erlotinib/Tarceva® Genentech/OSI EGFR 2004
Gefitinib/Iressa® AstraZeneca EGFR 2003
Lapatinib/Tykerb® GlaxoSmithKline EGFR/ErbB2 2007
Vandetanib/Caprelsa® AstraZeneca
EGFR/VEGFR/RET-tyrosine kinases
2011
Osimertinib/Tagrisso® AstraZeneca EGFR 2015
Antibody
Necitumumab/Portrazza® Eli Lilly EGFR 2015
Pertuzumab/Perjeta® Genentech ErbB2 2012
Ado-trastuzumab emtansine/Kadcyla®
Genentech ErbB2 2013
Trastuzumab/Herceptin® Genentech ErbB2 1998
Cetuximab/Erbitux®
ImClone/Eli Lilly/Bristol-Myers Squibb
EGFR 2004
13
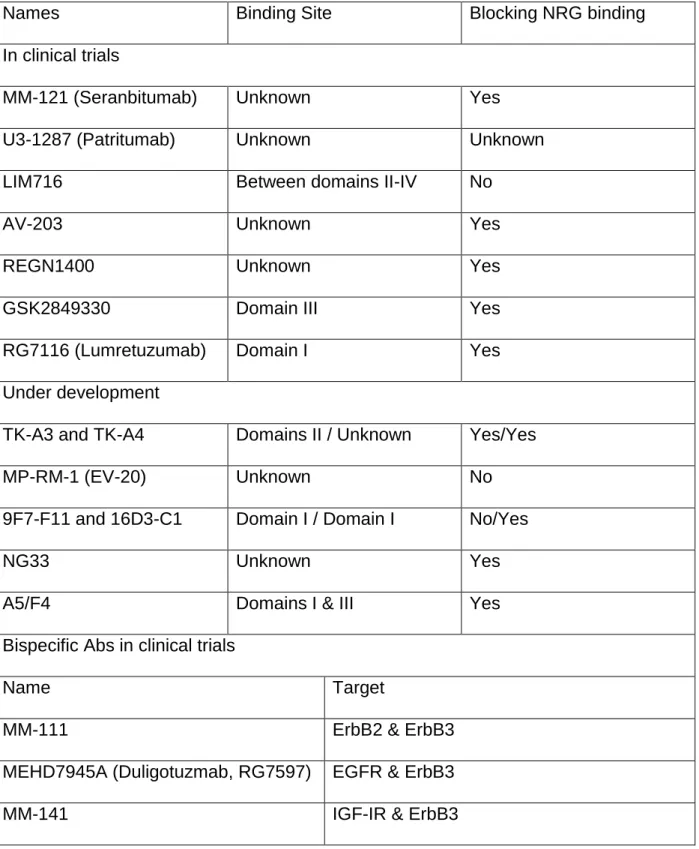
Table 1.3 ErbB3 targeting antibodies in development and clinical trials37
Names Binding Site Blocking NRG binding
In clinical trials
MM-121 (Seranbitumab) Unknown Yes
U3-1287 (Patritumab) Unknown Unknown
LIM716 Between domains II-IV No
AV-203 Unknown Yes
REGN1400 Unknown Yes
GSK2849330 Domain III Yes
RG7116 (Lumretuzumab) Domain I Yes
Under development
TK-A3 and TK-A4 Domains II / Unknown Yes/Yes
MP-RM-1 (EV-20) Unknown No
9F7-F11 and 16D3-C1 Domain I / Domain I No/Yes
NG33 Unknown Yes
A5/F4 Domains I & III Yes
Bispecific Abs in clinical trials
Name Target
MM-111 ErbB2 & ErbB3
MEHD7945A (Duligotuzmab, RG7597) EGFR & ErbB3
14
CHAPTER 2
Characterization of the pre-selected single-domain antibody mimics against
ErbB3
Introduction
Directed evolution is an effective approach to select or improve biomolecules with desired properties. The evolution of protein/peptides in vitro mimics the biological evolution. The steps includes diversify genetic codes, screen and identify the potential candidates48. The current methods for protein selection includes Yeast two-hybrid system, phase display, cell surface display and ribosome display49. mRNA display covalently connect mRNA with its translated protein through puromycin analogue50. Different diversified libraries are used for laboratory evolution. Human fibronectin (FN3) is an extremely abundant extracellular protein that occurs in approximately 2% of all human proteins in cell surface receptors. The tenth type III domain of FN3 appears to be an ideal scaffold for the development of natural ligand competitors by using directed evolution, due to its small size (less than 10 kDa), CDR-like ligand binding surface loops, lack of disulfide bonds, high expression level in bacteria, exceptional
15
16
Materials and Methods
Sequencing the selected FN3 library against ErbB3
The gene coding selected FN3 molecules were sub-cloned into pJET1.2/blunt plasmid (Thermo Scientific). The resulting plasmids were transformed into DH5α Competent E. coli (New England BioLabs). Single clones were picked and grown in 96 well plates with LB media at 37°C overnight. The cells were amplified with PCR. The PCR products were collected and got sequenced (Eton Bioscience Inc.). Unipro UGENE v1.10.1 and ClustalW2 were used for sequence alignment and analysis.
Construction, expression and purification of soluble SDA molecules
The coding genes of the selected SDAHER3s were amplified and assembled to a fusion gene through PCR using primers
(GAGGATCCGTGTCTGATGTTCCGCGTGAT-3’,
5’-GAGCGGCCGCTTACTTGTCGTCGTCGTCCTTGTAGT-3’). The generated products were firstly ligated to pJET1.2/blunt plasmid and then later ligated to the BamH I & Not I (New England BioLabs) sites of pET28b plasmid. The resulting plasmids were further confirmed by DNA sequencing (UNC genome analysis facility) and transformed to E.coli
17
temperature. A molar ratio of 1:10 was used to incubate the SDAs and Alexa-Fluor 555 C2 maleimide (Life technologies) at 4 °C overnight. Illustra NAP-5 Columns (GE
healthcare) were use remove the excessive dyes. The process of the purified SDAs (Wildtype-FN3) labeling with Alexa-Fluor Fluor 555 carboxylic acid, succinimidyle ester (Life technologies) was described in the previous work54.
Kinetic binding analysis of SDAs
ProteOn XPR36TM array system (Bio-Rad) was used for kinetic binding analysis of SDAHER3s. The soluble extracellular domain of human recombinant ErbB3 EDC-Fc and EGFR EDC-Fc were purchased from R&D Systems. SDAHER3 samples were prepared as described above. Each receptor was diluted with 10mM sodium-acetate buffer at pH 5. The immobilization of ErbB3 and EGFR were performed on a GLM sensor chip (Bio-Rad) through amine coupling approach55. Five different SDAHER3 concentration (from 200nM to 12.5nM in two-fold dilution) were injected over the
immobilized Fc-ErbB3 channel and EGFR channel. The dissociation constant (KD) were calculated by the software with 1:1 binding model.
Cell culture
ErbB3-positive ASPC1, MDA-MB-453 and ErbB3-negative MDA-MB-231,
SKOV3 were obtained from UNC Tissue Culture Facility. Each cell line was cultured by serial passage with proper media in 5% CO2 incubator, at 37 °C.
Confocal microscopy
18
19
Result
Pre-selected SDAs with distinct sequences shows good solubility and level of
expression
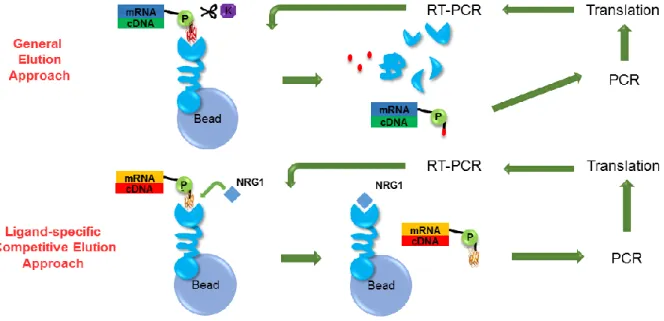
In this study, the FN3 scaffold-based SDAs that bind to the NRG1-binding site on ErbB3 were evolved from an mRNA-displayed human FN3 domain library with a
diversity of 5×10¹³. Two different selections were performed, including the general elution and the ligand-specific elution approach. The selected library members were amplified and sequenced. With simple clustering approach, five classes of SDAHER3s with the following sequences were selected. The selected sequences were amplified and inserted into protein expression vectors containing His-tag for purification. All five proteins were expressed and purified. The expression level of most of the selected SDAHER3s were good and were soluble as well. Initial binding tests against ErbB3 were performed to exclude the weak binders and those with poor solubility (data not shown). Among the five sequences, SDAHER3-A1 was the dominant sequences (~50%) from the general elution approach after eight rounds of selection; while the sequence of
SDAHER3-D5 presented in both of selections and was the major sequence in ligand-specific elution approach after nine rounds of selection. Both the two SDAHER3s, SDAHER3-A1 and SDAHER3-D5, were selected for further characterization.
SDAHER3-A1 and SDAHER3-D5showed great binding affinity to ErbB3 in vitro and
selectively binds to ErbB3-positive cells
SDAHER3-A1 and SDAHER3-D5 were expressed and purified for characterization. For labeling purpose, SDAHER3-A1-Cys and SDAHER3-D5-Cys were constructed,
20
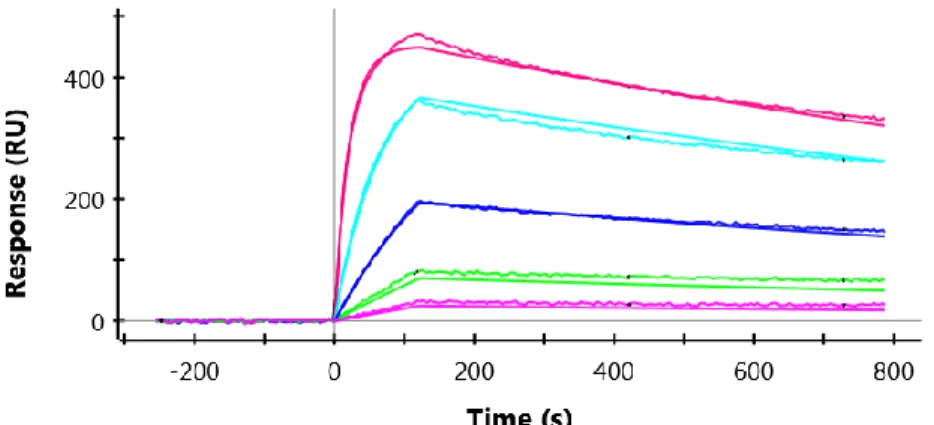
SDAHER3s to ErbB3. Both SDAHER3-A1 and SDAHER3-D5did not bind to immobilized EGFR-ECD-Fc (data not shown). The KD of SDAHER3-A1 and SDAHER3-D5 were 1.50 ± 0.38 nM and 4.14 ± 0.20 nM, respectively (Figure 2.3). The binding mode of the two SDAHER3s may be slightly different. Although the on-rate constants were similar, the off-rate constant of SDAHER3-D5 was greater than that of SDAHER3-A1. Overall, both
SDAHER3s have nanomolar binding affinity to ErbB3 in vitro.
21
Discussion
Most of the known agents that bind to ErbB3 in pre-clinical and clinical
development are based on mAbs37. However, the process of producing mAbs and the properties of antibodies may limit the potentials in modification and further development. Therefore, smaller proteins with high expression and minimum immunogenicity may be great tools for research investigation. Göstring and his colleagues presented an
affibody-based agent that bind to ErbB3 through phage display56,57. Affibody is a
structure based on Z domain of protein A, with three α-helices and a size of approximate 6 kDa. Generally, its binding ability comes from the randomization of 13 amino acids located on the two helices58. The size of the affibody and the limited number of randomization region may be a limitation for its application. In contrast, FN3-based protein has larger size and three loops that can be randomized. Moreover, there is an FN3-based scaffold based drug and it has already been in clinical trials for treatment59. In the present study, the two mRNA-display selections based on FN3 library
22
SDAHER3-A1 from general elution approach has ~ 4 folds higher binding affinity to ErbB3. Interestingly, SDAHER3-A1 has a higher k-on rate and lower k-off rate than those of SDAHER3-D5 in vitro. Regarding the cellular binding, the wt-FN3 protein was used as a control to rule out the backbone structure that contributes to the ErbB3 binding. In confocal microscopy study, both SDAHER3-A1 and SDAHER3-D5 selectively bound to the receptor on the surface of ErbB3-positive cell line in a concentration dependent manner. Overall, the experiment results suggested the selections were successful and we
23
Figure 2.1 Selection strategies by general elution and ligand-specific competitive
elution.
24
Figure 2.2 The Changes in Recovery Percentages Show Enrichment in two
Selections
The change in recovery percentage from general (left) and ligand-specific (right) elution approaches through rounds of selections. The recovery rates reached 33.2% at round 8 in general elution approach and 19.8% at round 9 in ligand-specific elution approach, respectively.
4.9
33.2
1.5 19.8
0 5 10 15 20 25 30 35
R1 R2 R3 R4 R5 R6 R7 R8 R9
% Re
co
v
e
ry
Rounds Total Elution
25
Figure 2.3 The binding affinity of selected SDAHER3s against ErbB3 ECD-Fc in vitro
by ProteOn XPR36
(a) Binding affinity for SDAHER3-A1 against ErbB3 was 1.50 ± 0.38 nM
26
Figure 2.4 The binding of SDAHER3-A1 and SDAHER3-D5 to ErbB3-positive ASPC1
cells were confirmed by confocal microscopy
27
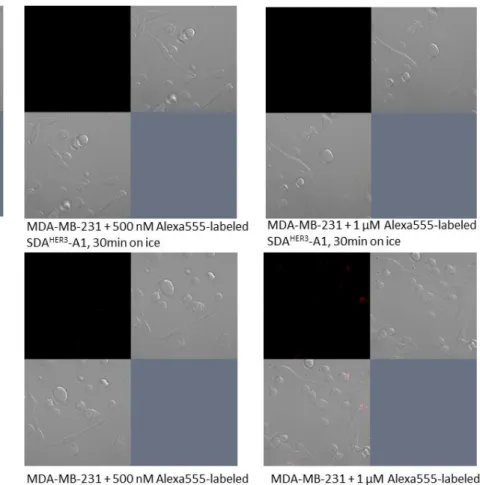
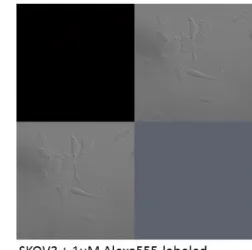
Figure 2.5 Confocal microscopy confirmed that SDAHER3-A1 and SDAHER3-D5 did
not bind to ErbB3-negative MDA-MB-231 cells
28
Figure 2.6 The WT-FN3 showed no binding to ErbB3-positive or ErbB3-negative
cell lines by confocal microscopy
29
CHAPTER 3
Generation and characterization of a biparatopic ErbB3-targeting SDAHER3
Introduction
Cancer is a complex disease, which usually involves multi-factors during the development and progression. Bispecific antibodies draw attention in the field of immunotherapy and oncology. The major interests in bispecific antibodies are to combine two fragments from two different monoclonal antibodies that bind to different antigens. Although it is indeed interesting in engineering a bispecific SDA, in the present study, we focused on developing biparatopic agent that targeting solely against ErbB3. There were a few studies indicated the advantages of biparatopic antibodies/proteins targeting other members of ErbB family or other receptors61–64. Roovers and his
colleagues combined two anti-EGFR nanobodies that improve the efficacy and potently inhibited the EGF-depend cell proliferation64. Li from MedImmune demonstrated an biparatopic ErbB2-targeting antibody-drug conjugate having therapeutic effect in T-DM1 eligible, resistant and ineligible patients during pre-clinical trials61.
30
31
Materials and Methods
Construction, expression and purification of SDAHER3-D5A1 and SDAHER3
-D5A1-Cys
The coding gene of SDAHER3-D5A1 was optimized first. The plasmid for SDAHER3 -D5A1-Cys was synthesized by Genescript. The plasmid was transformed to E.coli DH5α
(New England BioLabs) and amplified. Part of the extracted plasmid was transformed to
E.coli BL21 (DE3) competent cells (New England BioLabs) for protein expression. The other part of the plasmid was digested with Nco I & Sal I (New England BioLabs) and ligated to digested pET28b plasmid (by Nco I & Xho I, New England BioLabs). The ligated plasmid was confirmed by DNA sequencing (Eton BioScience) and transformed to E.coli BL21 (DE3) competent cells (New England BioLabs) as well. Cells were grown in LB media with kanamycin at 37 °C until OD ~0.6 (600 nm) and then induced with 0.3 mM IPTG at 20 °C for 16 h. The purification process was performed as above.
Affinity determination and specificity by Bio-Layer Interferometry (BLI) analysis
The binding affinity and specificity of SDAHER3-D5A1 was determined on an Octet RED384 instrument (Pall Fortbio, UNC Macromolecular Interactions Facility). All
measurements were ran at 30 °C with black 96-well microplates (Greiner Bio-One). Anti-human IgG Fc Capture (AHC) biosensors (Pall Fortbio) were used for
32
forteBio. The acquired data was further processed and analyzed by data analysis software from forteBio. All the binding curves were performed by a 2:1 hetero- binding model.
Labeling SDAHER3-D5A1 for cellular binding
For protein labeling, SDAHER3-D5A1-Cys was used to react with Alexa-Fluor 555 C2 maleimide (Life technologies) following the steps as described previously. SDAHER3 -D5A1 was reacted with Cyanine5.5 NHS ester (Lumiprobe), with the same steps as described previously for SDAs reacting with Alexa-Fluor 555 carboxylic acid. All the labeled proteins were further purified with NAP-5 column (GE healthcare) to remove excess fluorescent dyes.
Cell culture
ErbB3-positive MDA-MB-453, MCF7, BT474 and ErbB3-negative MDA-MB-231, SKOV3, PANC1 were obtained from UNC Tissue Culture Facility. Each cell line was cultured by serial passage with proper media in 5% CO2 incubator, at 37 °C.
Confocal microscopy and competition study
The binding test of SDAHER3-D5A1 was performed similar to what has been described above, except the incubation was 30 min at room temperature. For
competition experiments, the unlabeled SDAHER3-A1, SDAHER3-D5 and SDAHER3-D5A1 were pre-mixed with Alexa-Fluor 555-labled SDAHER3-D5A1-Cys in a ratio of 10:1 (2µM:200nM) before incubating with cells. The sample preparation was the same as previously described. All samples were examined with Zeiss LSM 700 confocal microscopy at UNC Microscopy Services Laboratory (MSL).
33
Cellar binding affinity of SDAHER3-D5A1 was determined by flow cytometry. Approximately 3 x 10⁴ cells were collected. The cells were washed with 1 x PBS first. One set of cells were pre-blocked with 5 µM unlabeled SDAHER3-D5A1 first for 30 minutes at 37 °C to get the non-specific binding signals. Then all cells were incubated with 0, 62.5, 125, 250, 500, 1000 nM SDAHER3-D5A1-Cy5.5 samples on ice for 1 h, followed by 1 x PBS washing twice. The cells were fixed with 2% paraformaldehyde (PFA) for 15 min and washed by 1 x PBS once. The samples were analyzed by a flow cytometry (Cyan ADP analyzer, UNC flow cytometry core). Summit 4.4 (Beckman Coulter) and GraphPad Prism 6 was used for data analysis.
Cell proliferation assay
34
Result
Construction, expression and purification of SDAHER3-D5A1 and SDAHER3
-D5A1-Cys
The genetic code for SDAHER3-D5A1 was optimized for expression. The construction, expression and purification of SDAHER3-D5A1 and SDAHER3-D5A1-Cys were successful. The biparatopic SDAHER3-D5A1 has increased level of expression, as well as with improved stability and solubility. The Figure 3.1 showed the purified
products of SDAHER3-D5A1 and SDAHER3-D5A1-Cys on SDS-PAGE gel. The size of the two products were consistent with design and the purities were satisfying. The
generated SDAHER3-D5A1-Cys provided modification sites for conjugation and applications.
SDAHER3-D5A1 binds to ErbB3 with picomolar affinity and specificity in vitro, and
it selectively binds to ErbB3-positive cells
The biparatopic molecule usually has greater binding affinity than its
35
16.5±6.8 nM (Figure 3.4), which is almost 200 fold weaker than its binding to ErbB3. The binding of SDAHER3-A1, SDAHER3-D5 and SDAHER3-D5A1 against ErbB4 with the same concentration was also tested as shown in Figure 3.5. The result supported the hypothesis that the binding of SDAHER3-D5A1 against ErbB4 may related to the NRG1 binding sites since only SDAHER3-D5 that may compete with NRG1. However, the binding affinity of the SDAHER3-D5A1 against ErbB4 is much higher than SDAHER3-D5. Overall, SDAHER3-D5A1 selectively bind to the extracellular domain of ErbB3 with picomolar binding affinity in vitro.
The binding of SDAHER3-D5A1 to ErbB3 receptors on cell surface was confirmed by confocal microscopy as shown in Figure 3.6. MDA-MB-453 is a breast cancer cell line with ErbB3 overexpressed and SKOV3 is an ovarian cancer cell line with
no/minimum ErbB3 expression. The labeled SDAHER3-D5A1 showed cellular binding when incubated with MDA-MB-453 cells and did not bind to SKOV3 cells. It suggested that SDAHER3-D5A1 selectively bind to ErbB3 overexpressed cancer cells.
Competition assay supported that SDAHER3-D5A1 is a biparatopic molecule and
binds to ErbB3
The availability of SDAHER3-D5A1 made it possible to check whether SDAHER3-A1 and SDAHER3-D5 bind to different sites on the extracellular domain of ErbB3. A
36
unlabeled SDAHER3-D5A1 was used as a positive control. After being mixed together with labeled SDAHER3-D5A1, and the binding of labeled SDAHER3-D5A1 was totally blocked. However, when mixed with 10 x concentrated SDAHER3-A1 or SDAHER3-D5, the labeled SDAHER3-D5A1 still showed cellular binding to MCF7 cells. Only when mixing with 10 x concentrated SDAHER3-A1 and SDAHER3-D5 together, the binding of labeled SDAHER3-D5A1 was then attenuated. The results implied that SDAHER3-A1 and SDAHER3 -D5 did not compete with each other when binding to ErbB3, and the new SDAHER3 -D5A1 molecule is indeed a biparatopic molecule.
Cellular binding affinity of SDAHER3-D5A1 to ErbB3-positive cell line
The cellular binding affinity of SDAHER3-D5A1 was determined by flow cytometry. Cells were pre-blocked with 5 µM SDAHER3-D5A1 to induce the internalization of the surface ErbB3 receptors. Therefore, the results from the pre-blocked samples can be considered as the non-specific binding. After the subtraction the background and normalization, the data was fitted by the one-site specific binding in GraphPad Prism. The KD of SDAHER3-D5A1 to positive MCF7 cells is 35.61 ± 17.07 nM. For ErbB3-negative PANC1 cells, the fitting curve for SDAHER3-D5A1 did not converge, and the binding signal before normalization was much smaller than that with MCF7 cells. The result suggested that SDAHER3-D5A1 selectively binds to ErbB3-positive cells with ~30 nM cellular binding affinity.
SDAHER3-D5A1 inhibited the NRG1 induced proliferation
37
tumorigenesis in cancers45. Two ErbB3-positive breast cancer cells, MCF7 and BT474, as well as ErbB3-negative MDA-MB-231 cells, were used to perform the proliferation assay. The SDAHER3-D5A1 did not show any inhibition effect on any of the cell lines alone (as shown in Figure 3.9 for BT474 cell line). However, after the stimulation by 10 nM NRG1, SDAHER3-D5A1 inhibited the ligand-induced proliferation of MCF7 and
BT474. Different concentrations of SDAHER3-D5A1 were applied and the results showed a dose-dependent inhibition effect. To calculate the growth inhibition, the readings from stimulated cells were subtracted by the readings from unstimulated ones according to different treatments. The final readings were normalized and fitted by (logged)
concentration vs. normalized response curves. The EC50 of the inhibition to the ligand-induced proliferation are 52.72 ± 12.44 nM and 178.8 ± 64.7 nM with SDAHER3-D5A1 for BT474 and MCF7 cells, respectively, as shown in Figure 3.10. The ErbB3-negative PANC1 cells did not stimulated by NRG1, thus the SDAHER3-D5A1 showed no inhibition effect. In all, SDAHER3-D5A1 did not inhibit the normal cancer cell growth; however, it inhibits the NRG1-induced cell proliferation in cancers that are ErbB3-driven or through ErbB2-ErbB3 dimerization. SDAHER3-D5A1 may be a good candidate for cancer
38
Discussion
In the present study, we constructed a biparatopic molecule SDAHER3-D5A1 that targets the extracellular domain of ErbB3 from SDAHER3-A1 and SDAHER3-D5. SDAHER3 -D5A1 has an improved level of expression, solubility and stability. Similar to the
biparatopic anti-VEGFR nanobody reported by Fleetwood and his colleagues62, the generated SDAHER3-D5A1 has picomolar binding affinity to ErbB3 with specificity in vitro, which makes SDAHER3-D5A1 a good candidate for further development. Cellular binding of SDAHER3-D5A1 was confirmed by confocal microscopy and a KD was determined by flow cytometry. SDAHER3-D5A1 selectively binds to ErbB3-positive cell lines. However, the cellular binding affinity is much weaker than the binding affinity determined by Octet Red. It may due to the limitation of the fluorescence molecules or the flow cytometry machine. The enriched ErbB3 concentration on the surface of the anti-Fc sensors by immobilization may artificially increase the binding affinity. It is also because of the conjugation of the dye that effect the cellular binding affinity. The result from the
competition assay by confocal microscopy supported the assumption that SDAHER3-A1 and SDAHER3-D5 bind to different site of ErbB3 and does not compete with each other, and the constructed SDAHER3-D5A1 is indeed a biparatopic molecule. Once we
confirmed the binding of SDAHER3-D5A1, the next step was to evaluate the cellular effect of SDAHER3-D5A1. Lee-Hoeflich and her colleagues explored the role of ErbB3 in
39
40
Figure 3.1 Purification of SDAHER3-D5A1 and SDAHER3-D5A1-Cys
41
Figure 3.2 The binding affinity of SDAHER3-D5A1 to ErbB3 ECD-Fc
42
Figure 3.3 Selectivity of SDAHER3-D5A1 to ErbB receptor family
43
Figure 3.4 Binding affinity of SDAHER3-D5A1 against ErbB4
44
Figure 3.5 The binding curve of SDAHER3-A1, SDAHER3-D5 and SDAHER3-D5A1 to the
extracellular domain of ErbB4
45
Figure 3.6 SDAHER3-D5A1 selectively binds to ErbB3-positive cell line
46
Figure 3.7 Competition experiment with confocal microscopy supported the
hypothesis that SDAHER3-D5A1 is biparatopic molecule
47
Figure 3.8 Flow Cytometry confirmed SDAHER3-D5A1 selectively bind to
ErbB3-positive cell line with good binding affinity.
The binding affinity of Cy5.5 labeled SDAHER3-D5A1 to ErbB3-positive MCF7 is 35.61 ± 17.07 nM. The same molecule did not show concentrated dependent binding to PANC1 cells and the values of MFI were very small (data not shown).
M C F 7
S D AH E R 3- D 5 A 1 - C y 5 .5 c o n c e n t r a t i o n ( n M )
N o r m a li z e d M F I
0 2 0 0 4 0 0 6 0 0 8 0 0 1 0 0 0
0 .0 0 .5 1 .0
P A N C 1
S D AH E R 3- D 5 A 1 - C y 5 .5 c o n c e n t r a t i o n ( n M )
N o r m a li z e d M F I
0 2 0 0 4 0 0 6 0 0 8 0 0 1 0 0 0
48
Figure 3.9 SDAHER3-D5A1 does not stimulate or inhibit the normal cell growth
while it inhibits the NRG1 stimulated cell proliferation
Different concentrations of SDAHER3-D5A1 were applied to the BT474 cells and
incubated for 48 hours. The protein did not stimulate or inhibit the cell growth of BT474 cells without the stimulation of NRG1. However, with the stimulation from NRG1, SDAHER3-D5A1 showed a dose-dependent inhibition to the NGR1 stimulated cell proliferation.
B T 4 7 4 w it h S D AH E R 3- D 5 A 1 4 8 h r s
S D AH E R 3- D 5 A 1 ( n M )
N o r m a li z e d A b s @ 4 8 5
0 1 0 0 2 0 0 3 0 0 4 0 0 5 0 0
0 .0 0 .5 1 .0
C o n tr o l
49
Figure 3.10 SDAHER3-D5A1 showed growth inhibition to NRG1 stimulated
proliferation for ErbB3-positive cell lines selectively
Different concentration of SDAHER3-D5A1 were used to test the proliferation stimulated by 10 nM NRG1 of three different cancer cell lines, BT474 and MCF7 as ErbB3-positive cell lines, and PANC1 as ErbB3-negative cell line. The EC50 of the inhibition to the ligand-induced proliferation are 52.72 ± 12.44 nM and 178.8 ± 64.7 nM for BT474 and MCF7 cells, respectively. PANC1 did not stimulated by NRG1 and SDAHER3-D5A1 showed no inhibition effect.
G r o w t h in h ib it io n o f S D AH E R 3- D 5 A 1 , 4 8 h r s
S D AH E R 3- D 5 A 1 ( n M )
% G r o w th i n h ib it io n
1 00 1 01 1 02 1 03
0 2 0 4 0 6 0 8 0
1 0 0 B T 4 7 4
M C F 7
50
CHAPTER 4
Biparatopic ErbB3-targeting SDAHER3 as a theranostic agent
Introduction
Antibody-based drugs become a major new class of drugs in the recent years70. The mAbs with high affinity against important receptor targets have been proved very efficient and selective in clinical trials and treatments. Antibodies can be used as therapeutic agents, drug-delivery agents, or conjugated with imaging agents. It is well known that antibodies can be protein-based therapeutic agents for treatment. ADC with toxins71 and targeted system for cancer therapy72 attracts attentions in both academia and industry. Antibodies that targeting cell surface biomarkers can be used for
51
ADC, trastuzumab was labeled with imaging agents such as IRDye800 and used for imaging purpose in mice xenograft models78.
In most of the pre-clinical and clinical trials, the ErbB3 targeting antibodies were used as a combination of other agents for treatment37. ErbB3 is also a good candidate for targeted drug delivery79. Terwisscha van Scheltinga and Rosestedt presented their studies in utilizing ErbB3 targeting antibody and affibody in PET imaging,
52
Materials and Methods
Cell culture
ErbB3-positive ASPC1, MCF7, BT474 and ErbB3-negative MDA-MB-231, SKOV3, PANC1 were obtained from UNC Tissue Culture Facility. Each cell line was cultured by serial passage with proper media in 5% CO2 incubator, at 37 °C.
Confocal microscopy and internalization assay
The SDAHER3-D5A1-Cys was conjugated with Alexa-Fluor 555 C2 maleimide as previously described. The internalization test of SDAHER3-D5A1 was performed similar to what has been described above, except the incubation was 2 hours at 37 °C. The
sample preparation was the same as previously described. All samples were examined with Zeiss LSM 700 confocal microscopy at UNC Microscopy Services Laboratory (MSL).
AuNPs-mediated hyperthermia treatment with cancer cells
The conjugation of SDAHER3-D5A1-Cys with AuNPs followed the steps as
described in the previous work53. The quantification was performed with Bradford Assay Reagent (Thermo Scientific). ErbB3-positive MCF7 and MDA-MB-231 cells were
seeded on the glass coverslides. After the treatment53, the cells were stained by LIVE/DEAD® Viability/Cytotoxicity Kit, for mammalian cells (Life Technologies). After washing by 1 x PBS 3 times and fixed, the samples were examined by Zeiss LSM 700 at UNC Microscopy Services Laboratory (MSL).
Cell proliferation assay
53
chapter. The Lapatinib (Sigma) was dissolved in DMSO. Different concentration and combination of SDAHER3-D5A1 and Lapatinib was used according to the IC50 of
Lapatinib (BT474 ~ 25 nM, MCF7 ~ 6 µM, MDA-MB-231 ~ 6 µM)82–84 and incubated for 48 hours at 37°C. The MTS assay followed the manual provided by the manufacture and the absorbance at 485 nm was recorded using a HTS 7000 bioassay plate reader (PERKin Elmer). GraphPad Prism 6 was used for data analysis.
Western blot analysis
Cells were seeded to 6 well plates and grew overnight. Cells were starved for 24 hours with media containing 1% FBS. Cells were stimulated with 10 nM NRG1 and different combinations of agents (200 nM SDAHER3-D5A1, 2 µM Lapatinib) for 10
minutes. Cell lysates were quantified by DC Protein Assay (Bio-Rad) and separated by 12% SDS-PAGE gel. After transferred to the membrane, the corresponding strips were cut and incubated with antibodies, including phosphor-HER3/ErbB3 (21D3) Rabbit mAb (Cell Signaling), HER3/ErbB3 (1B2E) Rabbit mAb (Cell Signaling), phosphor-Akt
(Ser473) XP Rabbit mAb (Cell Signaling), Akt(pan) (C67E7) Rabbit mAb (Cell Signaling), Phospho-p44/42 MAPK (ERK1/2) (Thr202/Tyr204) Rabbit mAb (Cell Signaling), p44/42 MAPK (ERK1/2) (137F5) Rabbit mAb (Cell Signaling), respectively, in a ratio of 1:2500 for 16 hours at 4 °C. ECL anti-rabbit IgG (GE healthcare) was used as secondary antibody.
Synthesis of IRDye 800-SDAHER3-D5A1 and imaging study
54
NanoDrop 1000 (Thermo Fisher Scientific). The excessive dye was removed by NAP-5 column (GE healthcare).
A total of fifteen 4-6 weeks BALB/c nude mice (obtained from UNC animal study facility) were used for the present study. For each mouse, 5 million cells were injected to the shoulder. Ten mice were injected with ErbB3-positive ASPC1 cells and five mice were injected with ErbB3-negative PANC1 cells. After the tumor grew to a size of 200-500 cm3, the mice were injected with labeled agents for imaging purpose. Mice
anesthesia was conducted with 2-5% isoflurane in oxygen with a flow rate of 2L/min. Each mice was injected with 100 µL labeled agents. The time points for imaging were 1 hour, 4 hours, 12 hours and 24 hours. IVIS Kinetic (Caliper Life Sciences) was used to acquire quantitative fluorescence signals. The emission filter was ND3, and the excitation
filter was 745. The result was analyzed by Living image software and the data was
processed with GraphPad Prism.
55
Result
SDAHER3-D5A1 got internalized and selectively targeted ErbB3-positive cells in
hyperthermia treatment.
In the previous section, we confirmed the binding of SDAHER3-D5A1 to the receptor ErbB3 on the surface of cancer cells. In this experiment, as shown in Figure 4.1, at 37 °C for 2 hours, the labeled SDAHER3-D5A1 entered the cells. To validate the targeting effect of SDAHER3-D5A1, SDAHER3-D5A1-Cys was conjugated with gold nanoparticles and used for hyperthermia treatment. The result in Figure 4.2 illustrated that the SDAHER3-D5A1-AuNP was selectively delivered into the ErbB3-positive MCF7 cells. With laser irradiation, the cancer cells were killed by the heating effect from the internalized AuNPs. However, using SDAHER3-D5A1-AuNP did not have toxicity to the cells, and SDAHER3-D5A1-AuNP did not target ErbB3-negative cells. Moreover, the AuNP without targeting ligands did not internalized into the normal cells. Therefore, SDAHER3-D5A1-AuNP showed improved targeting efficiency of biomaterials and demonstrated biomarker-dependent killing effect to cancer cells.
A combination of SDAHER3-D5A1 and Lapatinib showed improved inhibition
efficiency in proliferation assay with ErbB2 and ErbB3 overexpressed cells
56
MDA-MB-231 have some EGFR expressed85 on the cell surface, they are not very sensitive to Lapatinib83,84; In contrast, Lapatinib efficiently inhibits the proliferation of BT474. The results were described in Figure 4.3 for MCF7 cell line, Figure 4.4 for BT474 cell line, and Figure 4.5 for MDA-MB-231 cells. Overall, when adding Lapatinib with a concentration near the IC50 value, the drug itself did not effectively inhibit the proliferation, but a combination of SDAHER3-D5A1 and Lapatinib further inhibit the cell proliferation in ErbB2 and ErbB3-positive cell line (BT474) as an addition effect, which is consistent with the result from the previous chapter. However, it did not show effect with statistical significance with MCF7 cells. Therefore, it may be useful in developing
combination therapy with Lapatinib in treating ErbB2 and ErbB3-positive cancers.
SDAHER3-D5A1 inhibited the ligand-induced activation of the downstream
pathways
PI3K/Akt and MAPK/ERK pathways are important downstream pathways of ErbB3 and the whole ErbB family. To check the activation and inhibition of the
57
may explain the synergistic effect observed in the proliferation assay as mentioned above.
SDAHER3-D5A1-IRDye800 conjugate as fluorescence imaging probe for
ErbB3-expressing cancers
SDAHER3-D5A1-IRDye800 was conjugated, purified and quantified before
injecting to the ASPC1 or PANC1 mouse xenograft mice. Non-blocking and blocking of unlabeled SDAHER3-D5A1 were used to eliminate the signals from non-specific binding. In ErbB3 expression ASPC1 tumors, SDAHER3-D5A1-IRDye800 showed an increase in tumor:muscle ratio during the time course in the experiment. It may due to the
accumulation in the circulation after injection. After the blocking, the fluorescence signal decreased a lot. On the other hand, a blocking treatment did not decrease the
58
Discussion
Although the results listed in this chapter are mostly from preliminary data, all the experiments showed promising results in translate SDAHER3-D5A1 into theranostic applications. Targeted delivery with nanoparticles may be useful in reducing the
cytotoxicity and overcome the drug resistance72,86. Such proof of concept can be easily validated by conjugating the targeting ligand with gold nanoparticles and use
nanoparticle-mediated hyperthermia for cancer treatment87. A similar work was presented by the previous work from our lab53. SDAHER3-D5A1 is able to carry the conjugated nanoparticles and selectively target the ErbB3-expressing cells. It is
possible to expand this application to many other targeted nanoparticle delivery systems with toxins or other therapeutic agents72. Many of the ErbB3 targeting antibodies in clinical trials are used together with other antibodies or small molecule drugs37. Thus, Lapatinib was selected to treat cancer cells together with SDAHER3-D5A1. As expected, treatment of a combination of the two agents demonstrated better inhibition effect than using the agents separately in the ErbB2 and ErbB3 positive cell line. The western blot analysis helped understand the mechanism of the inhibition. SDAHER3-D5A1 is able to inhibit the ligand-induced activation of the downstream pathways, including the
59
regression as described in similar works with anti-ErbB3 antibodies61,88. In order to validate the binding ability of SDAHER3-D5A1 in mouse xenograft models, as well as its potential in live animal imaging, SDAHER3-D5A1 was conjugated with IRDye800CW. The result suggested that SDAHER3-D5A1-IRDye800 conjugate targeted the
ErbB3-overexpressed ASPC1 tumor and accumulated in tumor through the course of time. A blocking experiment with excessive amount of unlabeled SDAHER3-D5A1 confirmed that non-specific binding did not contribute to the entire observed fluorescence signal. In contrast, PANC1 tumor did not have any similar properties as ASPC1 after the injection of the conjugate, and the blocking did not show any effect in decrease the fluorescence signals. However, PANC1 mouse xenograft models had a higher tumor:muscle ratio after injection. It may due to the vascular permeability of different tumors89. The
fluorescence signals from IRDye800 may also be influenced by the tumor position, size and other factors. Thus, it is difficult to directly quantify and compare the imaging results among different mice and types of tumors. In some reported experiments, PET imaging was used with several of isotopes, such as (111)In78, (89)Zr80, (68)Ga90 and
60
Figure 4.1 Internalization assay confirmed that SDAHER3-D5A1 bound to ErbB3
receptors and got internalized after 2 hours incubation at 37 °C
61
Figure 4.2 Hyperthermia treatment using SDAHER3-D5A1-AuNP
The cells were incubated with 200 nM SDAHER3-D5A1-AuNP at 37 °C for 2 hours to promote internalization. NIR laser (800 nm, 1W) was used for 8 minutes. Live/Dead cell staining kit was used to visualize living (green) and dead cells (red). Only
62
Figure 4.3 Proliferation of MCF7 cells, treated with 500 nM SDAHER3-D5A1, 5 μM
Lapatinib, and a combination of protein and the drug
MCF7 is an ErbB3-overexpressed cell line but with low expression of ErbB2. The addition of 500nM SDAHER3-D5A1 inhibited the NRG1 stimulated proliferation. 5 μM Lapatinib did not inhibit the proliferation significantly. A combination of SDAHER3-D5A1 and Lapatinib may show some further inhibition of the cell proliferation, however, the difference is not statistically significant.
M C F 7 4 8 h r s
A b s o r b a n c e PB S 50 0n M SD A HE R3-D
5A 1
5u M L
ap ati nib 50 0n M SD A HE R3-D
5A 1+
5u M L
ap ati nib 0 .0 0 .5 1 .0
C o n tr o l
1 0 n M N R G 1
p < 0 .0 0 0 1
p < 0 .0 0 0 1
63
Figure 4.4 Proliferation of BT474 cells, treated with 500 nM SDAHER3-D5A1, 5 μM
Lapatinib (positive control), 25 nM Lapatinib and a combination of protein and the
drug
BT474 is an ErbB2 and ErbB3-overexpressed cell line. The addition of 500nM SDAHER3 -D5A1 inhibited the NRG1 stimulated proliferation. 5 μM Lapatinib almost completely inhibit the growth of the cell. 25 nM Lapatinib did not show good inhibition to the ligand-induced proliferation, but in combination with SDAHER3-D5A1, the inhibition effect was greatly improved.
B T 4 7 4 4 8 h r s
A b s o r b a n c e PB S 50 0n
M S DA
HE R3-D
5A 1
5u M L
ap ati nib 25 nM La pa tin ib 50 0n M SD A HE R3-D
5A 1+ 25 nM La pa tin ib 0 .0 0 .5 1 .0 1 .5
C o n tr o l
1 0 n M N R G 1
p = 0 .0 0 6
64
Figure 4.5 Proliferation of ErbB3-negative MDA-MB-231 cells, treated with 500 nM
SDAHER3-D5A1, 5 μM Lapatinib (positive control), 25 nM Lapatinib and a
combination of protein and the drug
MDA-MB-231 is with no/minimum ErbB3 expression. It does not response to NRG1 stimulation and SDAHER3-D5A1 showed on effect on proliferation. With 3 uM Lapatinib, the cell growth was slightly inhibited and an combination of the protein and drug did not show difference with significance.
M D A - M B - 2 3 1 4 8 h r s
A b s o r b a n c e PB S 20
0 n
M S
DA
HE R3-D
5A
1
3u
M L
ap
ati
nib
20
0n
M S
DA
HE R3-D
5A
1+
3u
M L
ap ati nib 0 .0 0 .2 0 .4 0 .6 0 .8
65
Figure 4.6 Western blot analysis of SDAHER3-D5A1 and its effect on the
downstream pathways of MCF7 cells
66
Figure 4.7 Live imaging results from ASPC1 mouse xenograft models with
SDAHER3-D5A1-IRDye800, for 1 hour, 4 hours and 24 hours after injection.
67
Figure 4.8 The change in tumor:muscle ratio after injection of SDAHER3
-D5A1-IRDye800 or SDAHER3-D5A1-IRDye800 with 20 fold excess of unlabeled SDAHER3
-D5A1 (as blocking agent) at 1 hours, 4 hours, 24 hours and 48 hours in ASPC1
mouse xenograft model (Non-blocking: N = 7, Blocking: N =2)
The tumor:muscle ratio from the ASPC1 tumor increases over the time course. With blocking of unlabeled SDAHER3-D5A1 proteins, the tumor:muscle ratio decreased
significantly, which suggested the SDAHER3-D5A1 bind to tumor with specificity in mouse xenograft models.
1 h r
4 h r 24 hr 48 hr 0 1 2 3
A s P C 1
A s P C 1 + b lo c k in g
T im e
T u m o r :M u s c le R a ti o
p < 0 .0 0 0 1
68
Figure 4.9 The change in tumor:muscle ratio after injection of SDAHER3
-D5A1-IRDye800 or SDAHER3-D5A1-IRDye800 with x 20 fold excess of unlabeled SDAHER3
-D5A1 (as blocking agent) at 1 hours, 4 hours, 24 hours and 48 hours in PANC1
mouse xenograft model (Non-blocking: N = 3, Blocking: N = 2)
The tumor:muscle ratio from the PANC1 tumor increases over the time course. With blocking of unlabeled SDAHER3-D5A1 proteins, the tumor:muscle ratio did not decrease, instead, all tumors with pre-blocking showed slightly increased in signals. No
observation of increased tumor:muscle ratio during the experiment as observed in ASPC1 mouse xenograft model.
T im e
T u m o r :M u s c le R a ti o
1 h r
4 h r 24 hr 48 hr 0 1 2 3 4
P A N C 1