Gender of Interviewer Effects in a
Multi-topic Centralized CATI Panel Survey
Oliver Lipps & Georg Lutz
Swiss Centre of Expertise in the Social Sciences (FORS)
Abstract
This paper is motivated by two recent articles which show that numerous studies which an-alyzed gender of interviewer effects did not take interviewer nonresponse selection effects into account. For example, interviewers may be more successful at recruiting respondents with characteristics similar to themselves and who give answers that are similar to their own, and this may result in spurious gender of interviewer effects. Our research is novel because it uses data from a large panel survey in which the same respondent is asked the same questions repeatedly by interviewers of random genders using the centralized tele-phone mode. We use the panel design to show the importance of checking for all relevant variables in models where selection may cause bias. To this end, we use respondent fixed effects models as a reference to yield unbiased coefficients.
We find gender of interviewer effects that are in line with social desirability theory on gen-der issues such as female discrimination. However, not all gengen-der-related questions are af-fected by gender of interviewer effects and, in addition, we do not find any effects on politi-cal and (factual) household task related questions. In line with the notion of social distance, there is a higher likelihood that answers respondents are less comfortable with are given to interviewers of the same gender regarding (sensitive) health questions.
Keywords: Research of gender of interviewer effects; selection effects; social desirability; social role; social distance; fixed effects
Direct correspondence to
Oliver Lipps, FORS, c/o University of Lausanne, 1015 Lausanne E-mail: [email protected]
Introduction
Gender of interviewer effects may cause severe answer bias (Groves et al., 1992; Davis et al., 2010). For example, in interviewer-based surveys, people may give more liberal answers to questions on women’s rights to female interviewers than to male interviewers due to a wish to ensure a good atmosphere during the interview by providing answers that are assumed to be preferred by the interviewer. In addi-tion, the nature of the answers given may depend on the match in characteristics between interviewer and respondent (e.g., Catania et al., 1996). Measurement errors may not be the only source of gender of interviewer effects, as even if interviewers are assigned to respondents at random, female interviewers may interview different sample members than male interviewers so that their respondent sample is differ-ent (Groves & Couper, 1998). Two recdiffer-ent articles addressed this issue: one focused on telephone surveys (West & Olson, 2010) and the other on face-to-face surveys (West et al., 2013). Each found that large parts of the interviewer variance were actually due to nonresponse error variance in addition to measurement error vari-ance. However, to distinguish these error sources in cross-sectional surveys which are typically analyzed (West & Olson, 2010) is very difficult.
Compared with existing studies on gender of interviewer effects (see Table 2.2 in Davis, 2008), to the best of our knowledge our approach is the first to use a panel survey with a random assignment of interviewers of both sexes to respon-dents across waves to study gender of interviewer effects. In this model, the same respondent answers the same questions repeatedly, sometimes to male, sometimes to female interviewers, a design that guarantees that interviewers of both genders interview the same sample so that there is no gender of interviewer nonresponse effect. In addition, we use a large sample that is representative of a national resi-dential population, and a large number of socio-demographically heterogeneous interviewers. This means the study is not a simple experimental low N-study with a highly selective use of respondents.
on sensitive or embarrassing topics with which the respondent is less comfortable with. After introducing the models used, we present and discuss the results and offer our conclusion.
1 Theory and Empirical Findings
There are different reasons why people give different answers to male or female interviewers (Atkin & Chaffee, 1972; Cosper, 1972; Fowler & Mangione, 1990).
According to social desirability theory (DeMaio, 1984; Paulhus, 2002),
respon-dents reflect on what might be considered the mainstream views in a society on a given topic and then adapt their answer to this view. The likelihood of respondents giving a response which they think is more accepted by society may depend on interviewer characteristics, such as their gender. That men and women hold sys-tematically different attitudes on a wide range of issues is widely known: men are typically more traditional and women are more liberal and more in favor of social welfare programs and equal rights (Blekesaune & Quadagno, 2003; Eagly & Stef-fen, 1984; Eagly et al., 2004; Pratto et al., 1997).
Differences are, however, not likely to be enough to produce interviewer effects, because most attitudes do not have a clear gender dimension. Some have argued that we should find interviewer effects only on issues that are based on social role theory (Diekman & Schneider, 2010). Social role theory asserts that interviewer gender effects occur when attitudes are linked to expectations about gender roles and gender equality. Gender stereotypes and expectations of gender roles are still widely present in western societies despite some signs of a decline (Wilde & Diekman, 2005), and Diekman & Goodfriend (2006) state that women still typically occupy social roles of care takers for others while men are assumed to take the role of leadership and power. Another theory states that communica-tion is more comfortable over a smaller social distance (Groves et al., 1992; Liu & Stainback, 2013; Snell Dohrenwend et al., 1968; Tu & Liao, 2007). Respondents, when answering sensitive questions, may feel more at ease with interviewers with whom they have something in common, including the same gender. As a conse-quence, respondents give more valid or honest responses to such questions.
women to a different extent, depending on the sensitivity of the question in the cultural context (Becker et al., 1995; Benstead, 2013). For example, Flores-Macias & Lawson (2008) find that interviewer gender is more likely to affect men living in (rather liberal) Mexico City than women regarding gender-sensitive questions, while Lueptow et al. (1990) find that male interviewers have more influence on the response variance of women in a Midwestern metropolitan area. In general, however, gender of interviewer effects are rather weak and sometimes inconsistent (see the review in Davis et al., 2010), especially concerning interviewer-respondent gender interaction effects. For example, Fuchs (2009) finds both opposite-gender and same-gender effects in a German CASI experiment, which contradicts social distance theory. And although Liu and Stainback (2013) find gender of interviewer effects on questions regarding the happiness of married persons compared to unmarried persons in a Chinese survey, they do not find differences according to respondents’ gender.
Recently some scholars have investigated whether interviewer-specific non-response bias causes significant portions of “gender of interviewer” effects. Using factual questions, West and his colleagues analyzed how much of the interviewer effect is due to measurement error and how much is due to selection error. While West and Olson (2010) found substantial selection effects in a cross-sectional tele-phone survey, West et al. (2013) report selection effects in a cross-sectional face-to-face survey. The surveys used in the two articles were matched with administration data which contained the “true” values. Without the availability of such auxiliary data, the identification of the two interviewer error variances is not possible. In addition, interviewer effects can only be examined for factual variables, not atti-tudes. However, the latter may be more fruitful when analyzing gender of inter-viewer effects.
In the light of these inconclusive findings and weak data sources, Davis et al. (2010) argue for more research which uses designs in which respondents are randomly assigned to interviewers (Gillikin, 2008), and which utilze a large num-ber of interviewers. Davis et al. (2010) complain that “[t]hese ideal study quali-ties may be difficult to achieve [...] However, even if lacking perfect design, the repeated investigation and reporting of interviewer effects, whether significant or null, will contribute to a significantly enhanced understanding of the magnitude and frequency of interviewer effects” (p. 24). In addition Davis (2008) calls for more telephone-administered studies (p. 28, 29). We have thus accommodated this by measuring gender of interviewer effects in different topic domains and done so more accurately by using panel data as it seems particularly suitable for this pur-pose. Specifically we test the following hypotheses:
specific dimension such as female rights or discrimination. Questions on more general topics such as general political questions are not sufficient even if diffe-rent attitudes between the genders are present.
H2: In terms of the direction of effects, we expect that female interviewers prompt more liberal views, while male interviewers prompt more traditional opinions from respondents of both genders. We do not expect gender of interviewer-respondent matching effects
H3: We expect gender of interviewer-respondent matching effects on questions the answers to which may be embarrassing for respondents, even if they are not related to gender specific social roles. We expect more valid answers if the interviewer and the respondent have the same gender.
To test these hypotheses, we used data from Switzerland. Though gender equal-ity is a constitutional norm and legislation to prohibit gender discrimination came into force in 1995 (Federal Authorities, 2013), some people still hold the view that women should play a more important role in the home while men should be the primary earner (Bernardi et al., 2013; Makarova & Herzog, 2015). Although female labor force participation is increasing (SFSO, 2015), this expansion is evident pre-dominantly through part-time jobs, especially in lower-pay sectors with less respon-sibility (Bernardi et al., 2013), and wage differences are still substantial (Murphy & Oesch, 2015). While this has contributed to more heterogeneous life trajectories for women, men’s life trajectories still correspond to the classical breadwinner model (Widmer et al., 2003). To explore if gender of interviewer effects are limited to gen-der related issues or whether this is a broagen-der phenomenon, we included answers to questions in additional domains: politics (Huddy et al., 1997; Hutchinson & Wegge, 1991; Lipps & Lutz, 2010), the role of performing different household tasks (Ballou & DelBoca, 1980; Grimes & Hansen, 1984; Kane & Macauley, 1993, Klein & Küh-hirt, 2010), and health (Davis et al., 2010).
2 Data
reducing the risk of confusing area effects and interviewer effects as is often the case in face-to-face surveys (O’Muircheartaigh & Campanelli, 1998; West et al., 2013). Roberts et al. (2006) find that telephone respondents are more likely to give socially desirable responses than face-to-face respondents. Davis (1997), however, argues that telephone surveys should produce smaller effects because of the greater social distance inherent in using a phone line (also Fowler & Mangione, 1990).
We used data from the Swiss Household Panel (SHP; Voorpostel et al., 2015) which is an annual, centrally conducted and nationwide CATI panel survey, using a stratified random sample of the Swiss residential population. Starting in 1999 with more than 5,000 households, the SHP added two refreshment samples, one in 2004 with more than 2,500 households, and one in 2013 with about 4,000 households. In their respective first waves, the 1999 original sample household level response rate amounted to 64%, that of the 2004 refreshment sample was 65%, and that of the 2013 refreshment sample was 60% (RR1; AAPOR, 2015). Fieldwork is conducted each year between September and January using about 100 interviewers, and each year, the household reference person is asked to first complete the household grid questionnaire and then the household questionnaire, which includes among other questions the share of household tasks between the partners of a household. Finally, all household members aged 14 or over are interviewed using the individual ques-tionnaire. The SHP contains a wide range of questions about health, well-being, attitudes, social networks and economics. Gender of interviewer information is available for almost all interviewers in 2000, and from 2003 on. Since not all ques-tions investigated have been asked in all the years (2000, 2003-2014), the sample size is different according to the question analyzed. Interviews from 18,555 respon-dents interviewed by 605 interviewers with given gender are used. While about a third of the respondents report, respectively, one, two to four, and five to 13 waves, 65% of the interviewers work only one wave, 20% two waves, and about 15% work more than two waves. A third of the 605 interviewers are men. To rule out selec-tion effects due to a different response rate, we analyzed response rate differences between male and female interviewers and ran two cluster robust logit models, using pooled data from the first contacts on the household grid level and on the individual questionnaire level, respectively. First contacts are crucial determinants of final cooperation and are well suited to investigate interviewer performance in centralized CATI surveys (Lipps, 2009), although about 60% of the households and individuals needed more than one contact to be finalized. After checking the sur-vey year, whether the first contact occurred during the normal or the refusal
con-version1 field phase, the number of contacts, and the number of unsuccessful calls,
results show that the predicted cooperation probabilities of male (female) inter-viewers amount to 82.1% (81.6%) on the household grid level and to 78.7% (78.9%)
on the individual questionnaire level respectively. Both gender of interviewer dif-ferences are insignificant on the 1% level.
We selected questions where we found clear differences in the response behav-ior of men and women. Table 1 gives an overview of the different questions, the number of observations, and the mean values of men and women in relation to these questions. Four questions are gender specific, five questions are related to general politics attitudes, five questions ask about the distribution of household tasks, and five questions about health issues. The question wording and their exact answer categories are listed in the appendix.
Table 1 Means of dependent variables by sex and t-tests of differences.
N(obs.) Women Men P(|T| >| t|) GENDER
Women in Switzerland are sometimes penalized
(0=no-10=yes) 52212 5.41 4.96 0.000
There should be more measures to support
women in Switzerland (0=no-10=yes) 51776 6.00 5.34 0.000 To have a job is the best guarantee for women
and men to be independent (0=no-10=yes) 49821 8.26 8.01 0.000 A pre-school child suffers, if his or her mother
works for pay (0=no-10=yes) 49205 5.25 6.18 0.000
POLITICS
In favor of a strong Swiss army
(0=no, 1=neither nor, 2=yes) 47802 0.97 1.08 0.000 Foreigners should have the same opportunities
as Swiss (0=no, 1=neither nor, 2= yes) 51171 1.32 1.41 0.000 Environment should be more important than
economic growth
(0=no, 1=neither nor, 2=yes) 51248 1.41 1.25 0.000 Switzerland should continue to have nuclear
energy (0=no, 1=neither nor, 2=yes) 50315 0.52 0.87 0.000 Switzerland should increase social expenses
(0=no, 1=neither nor, 2=yes) 49465 1.25 1.13 0.000 HOUSEHOLD TASKS
In our Household it is mostly me who does the
cleaning (0=no, 1=yes) 43009 0.79 0.29 0.000
In our Household it is mostly me who does the
laundry (0=no, 1=yes) 43009 0.88 0.25 0.000
In our Household it is mostly me who manages
the finances (0=no, 1=yes) 43009 0.30 0.35 0.000
In our Household it is mostly me who handles
administration (0=no, 1=yes) 43009 0.62 0.66 0.000 Hours of housework (per week) 70561 14.71 5.87 0.000 HEALTH
Body weight (kg) 60405 63.91 78.42 0.000
Suffering from headaches during the past four
weeks (0=no, 1=yes) 60933 0.40 0.27 0.000
Physical health bad
(1=very good, …, 5=not well at all) 72414 2.00 1.89 0.000 Having the blues (0=never-10=always) 72371 2.35 1.69 0.000
Sadness (0=never-10=always) 48109 3.73 3.05 0.000
3 Variables and Modeling
Our independent research variables are interviewer gender and interviewer gender
interacted with respondent gender. We used female as a reference gender category. A significant interviewer male coefficient b means that there is a difference by b between survey answers to a female and a male interviewer. A significant interac-tion coefficient b’ (interviewer and respondent male match) means that a man, when interviewed by a man, exhibits a difference by b’ to the situation, when interviewed by a woman (the main effects are controlled).
Our target is to estimate random effects (RE) models the gender of interviewer coefficients of which are close to those of the respective fixed effects (FE) models.
Only then can we be sure that we have included the relevant respondent time
invari-ant variables (Morgan & Winship, 2014) which we suspect are responsible for a
great deal of possible selection effects. For example, the “naïve” mean difference to the first question between male and female interviewers amounts to 0.43 units, which is almost as high as the differences between male and female respondents (0.45) and which suggests that despite our design there are some selection effects. We aim to control for all variables which may have effects on the gender of inter-viewer sample selection, due to a selective accessibility and/or a selective coopera-tion (Groves & Couper, 1998). To decide which variables to include as controls for gender of interviewer sample selection effects, we tested mean differences between the samples of male and female interviewers for the following variables by means of T-tests. Respondent gender itself is not affected by gender of interviewer sample selection (P(|T| >|t|) = .257 (.053) on the household (person) level (but included in the RE model).
Respondent is the household reference person (P(|T| >|t|) = .000)
Household needed refusal conversion (P(|T| >|t|) = .026)
Language region: Swiss-German speaking part (reference), French speaking
part (P(|T| >|t|) = .000), Italian speaking part (P(|T| >|t|) = .000)
Respondent’s highest education (P(|T| >|t|) = .115)
Respondent has a partner (P(|T| >|t|) = .077)
Respondent is employed (P(|T| >|t|) = .000)
Respondent lives in a city (P(|T| >|t|) = .071)
Day of first contact: Monday (P(|T| >|t|) = .019), Tuesday (P(|T| >|t|) = .494),
Wednesday (P(|T| >|t|) = .127), Thursday (P(|T| >|t|) = .580), Friday (P(|T| >|t|) = .073), Saturday (P(|T| >|t|) = .064).
Time of first contact: before 2 pm (P(|T| >|t|) = .003), between 2 pm and 6 pm:
(P(|T| >|t|) = .164), between 6 pm and 8 pm: (P(|T| >|t|) = .324), after 8 pm: (P(|T| >|t|) = .249)
Number of unsuccessful calls (calls with no contact) (P(|T| >|t|) = .031).
Age of youngest child in the household: no child (reference), between 0 and 6
years: (P(|T| >|t|) = .029), between 7 and 17 years: (P(|T| >|t|) = .324)
Survey wave to control for panel conditioning (Warren & Halpern-Manners,
2012): first (reference), second (P(|T| >|t|) = .428), third or higher (P(|T| >|t|) = .000)
Survey year to account for time effects and for different interviewer
composi-tions across different years: 2000 (reference), 2003, 2004, 2005, 2007, 2009, 2011-2012, 2014 (P(|T| >|t|) = .000), 2006 (P(|T| >|t|) = .013), 2008 (P(|T| >|t|) = .039), 2010 (P(|T| >|t|) = .014), 2013 (P(|T| >|t|) = .46)
Age group: 14-25 years (reference), 26-35 years (P(|T| >|t|) = .035), 36-45 years
(P(|T| >|t|) = .000), 46-55 years (P(|T| >|t|) = .000), 56-65 years (P(|T| >|t|) = .287), 66+ years (P(|T| >|t|) = .251)
Based on these findings we decided to control for all variables apart from educa-tion, partner, living in a city, age of youngest child in the household, day and time of first contact, number of contacts or unsuccessful calls, and whether the house-hold needed refusal conversion (the latter five variables come from the CATI call data and are available only from 2005 on). Before we dropped the call data vari-ables, we tested their joint significance in a linear regression of the residual of the dependent variables (see Table 1) on all other variables. As it turns out, these call data variables have little additional explanatory power. Exceptions are significant (1%) F-values in two gender models, two household tasks models, and two health
models. However, all models have a McFadden Pseudo R2 smaller than .003. Using
the research and the control variables, we ran Hausman tests to test the differences between the coefficients of the (consistent but less efficient) FE model and the coef-ficients of the (more efficient) RE model.
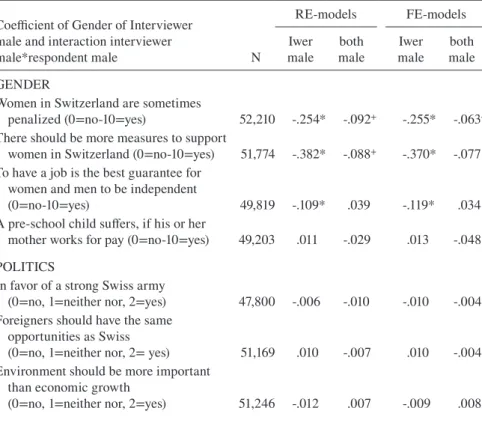
4 Results
The Hausman tests of all models are significant on the 1% level. This means that for all issues there are time invariant respondent specific omitted variables which cause biased gender of interviewer effects in RE models. Nevertheless, the size of the coefficients of the FE gender of the interviewer are very similar to those of the RE gender of the interviewer for most dependent variables (see Table 2). As an example of our success in controlling for some relevant gender of interviewer selection variables, the mean difference between male and female interviewers to answers on the first question is now reduced to about 0.25 units. Interaction gender of the respondent * gender of the interviewer coefficients show a greater difference between the FE and the RE models. Since the FE models yield consistent parameter estimates (Morgan & Winship, 2014) we rely on these modeling results to interpret the gender of interviewer effects even if we lose some statistical precision. For the sake of completeness, however, we list both the FE and the RE coefficients. Since all Hausman tests are significant on the 1% level we do not list the respective sig-nificance separately.
Table 2 Random and fixed linear effects model coefficients of interviewer male and interaction interviewer male*respondent male.
Coefficient of Gender of Interviewer male and interaction interviewer male*respondent male
RE-models FE-models
N maleIwer maleboth maleIwer maleboth GENDER
Women in Switzerland are sometimes
penalized (0=no-10=yes) 52,210 -.254* -.092+ -.255* -.063+
There should be more measures to support
women in Switzerland (0=no-10=yes) 51,774 -.382* -.088+ -.370* -.077
To have a job is the best guarantee for women and men to be independent
(0=no-10=yes) 49,819 -.109* .039 -.119* .034
A pre-school child suffers, if his or her
mother works for pay (0=no-10=yes) 49,203 .011 -.029 .013 -.048 POLITICS
In favor of a strong Swiss army
(0=no, 1=neither nor, 2=yes) 47,800 -.006 -.010 -.010 -.004 Foreigners should have the same
opportunities as Swiss
(0=no, 1=neither nor, 2= yes) 51,169 .010 -.007 .010 -.004 Environment should be more important
than economic growth
Coefficient of Gender of Interviewer male and interaction interviewer male*respondent male
RE-models FE-models
N maleIwer maleboth maleIwer maleboth Switzerland should continue to have
nuclear energy
(0=no, 1=neither nor, 2=yes) 50,313 -.002 -.015 -.009 -.013 Switzerland should increase social
ex-penses (0=no, 1=neither nor, 2=yes) 49,463 -.032* .005 -.033* .007 HOUSEHOLD TASKS
In our Household it is mostly me who
does the cleaning (0=no-1=yes) 43,008 -.000 -.007 -.000 -.006 In our Household it is mostly me who
does the laundry (0=no-1=yes) 43,008 -.002 .005 -.001 .005 In our Household it is mostly me who
manages the finances (0=no-1=yes) 43,008 .002 .004 .001 .009 In our Household it is mostly me who
does administration (0=no-1=yes) 43,008 .001 .001 .000 .006 Hours of housework (per week) 70,559 -.149+ .183 -.132 .167
HEALTH
Body weight (kg) 60,403 -.264* .434* -.279* .452*
Suffering from headaches during the
past four weeks 60,931 -.017* .019* -.019* .020*
Physical health bad
(1=very good, …, 5=not well at all) 72,412 -.037* .016 -.035* .011 Having the blues (0=never-10=always) 72,369 -.103* .063+ -.111* .071*
Sadness (0=never-10=always) 48,109 -.089* .018 -.091* .007
Data: Swiss Household Panel 2000, 2003-2014. Mean number of observations by respon-dent between 3.287 (Sadness) and 3.904 (bad health). Models controlled for reference person (all but Household Tasks), respondent male (RE Models), language region, being employed, age, respondent wave (first, second, third or later), year dummies. *=signifi-cant on 1% level += signifi*=signifi-cant on 5% level.
In the following we briefly describe the gender of interviewer effects across the dif-ferent domains and discuss if our hypotheses are confirmed or not.
Gender
match effects. We find no gender of interviewer effects on the question whether a pre-school child suffers if his or her mother works for pay. An explanation for the lack of interviewer effects for this question about child suffering could be that unlike the first three questions in this domain, the job related question for a mother with a small child is interesting only for those concerned. We run the model about child suffering for the sample of people who work and have a child under the age of 7 years at home. For this sample, we find a positive interviewer=male effect for women and a zero effect for men. It is possible that the three (more general) initial questions are less deeply reflected upon, and more socially desired answers are mechanically provided in response to these questions.
Politics
With one exception (“Switzerland should increase social expenses”), items on polit-ical attitudes are not affected by the interviewer gender.
Household Tasks
There are no gender of interviewer effects on household task items.
Health
For health issues, we find evidence that men, and even more so women, report bet-ter physical and mental health when inbet-terviewed by a man. This shows that health issues are potentially sensitive and women are trusted more. Interestingly, both genders, and especially women, report lower body weight when interviewed by an interviewer of the opposite sex: women report .279 kg less, men a significant (1%) .452 kg - .279 kg = .173 kg less. Reporting a high body weight to an interviewer of the opposite sex may be embarrassing. The same holds for headaches and in parts for having the blues, where interviewers of the same sex “admit” worse health conditions. For example, in terms of headaches, the main effect of -.019 from male interviewers means that women report 1.9 % points less occurrences to male than to female interviewers, while men report the same amounts to interviewers of both genders (-.019+.020 is insignificant). Similarly, while women report .111 less often having the blues to male interviewers, men again show no gender of interviewer effect (-111+.071 is insignificant). Male interviewers receive reports of better physi-cal health and less levels of sadness by respondents of both genders.
Before concluding, we compare our findings with our hypotheses:
H1 (effects if answers differ between men and women and if questions have a
gen-der specific social role): We find that answers on general gender issues are
H2 (male interviewers produce more traditional answers and interaction effects): When significant, the sign of the interviewer=male effect is in the expected direction. Interaction effects occur only on health questions. Hypothesis H2 is in parts confirmed.
H3 (gender of interviewer effects on sensitive questions if the interviewer and the respondent have the same gender): We find gender of interviewer effects on health issues, especially for female respondents: Women in particular feel em-barrassed to disclose bad mental or physical health to men, although there is not a social role involved with health issues. Men, as representing the “strong sex”, are reported better health, by both genders. For some issues, interviewers of the same gender are trusted more. This shows that for sensitive questions like health, social distance may play a role. Our hypothesis H3 is partly con-firmed.
5 Conclusion
The motivation for this article comes from two recent articles which show that omitted interviewer nonresponse selection effects may have resulted in spuri-ous gender of interviewer effects in a number of studies, even if interviewers are
assigned to sample members at random. To examine gender of interviewer effects,
this article uses data from the Swiss Household Panel (SHP), a large centralized CATI panel with randomly assigned interviewers to respondents. The same sur-vey questions are answered repeatedly by the same respondent to interviewers of both genders. When designing the models, we remained concerned about selection effects because even in the SHP, interviewers of a certain gender may select respon-dents with omitted characteristics. If these characteristics are correlated with the dependent variable, the gender of interviewer coefficient will be biased. FE models eliminate this error if the characteristics are time-invariant. A careful choice of control variables yielded very similar gender of interviewer estimates in RE and FE models. This makes us confident that we have included the relevant variables in the models.
We find the expected effects of gender of interviewer on general gender
small children at home. We do not find effects on political and on (factual) house-hold task related questions. (Sensitive) health questions are affected by the gender of the interviewer. In particular, women report better physical and mental health to male interviewers, while, on the contrary, respondents report a higher body weight to interviewers of the same gender. This points to social desirability effects and the impact of social role theory on gender-related questions and the theory of social distance on health questions.
For researchers who work with cross-sectional data and who like to esti-mate unbiased gender of interviewer effects, our research shows the importance of including all variables which have an effect on interviewer sample selection and the dependent variable. Suppose a researcher analyzes gender of interviewer effects on the female discrimination question (our first dependent variable). If the survey was conducted in a country with regions of different cultural contexts with different distributions of male and female interviewers and with different gender of inter-viewer effects, these contexts (in our case the language regions) must be controlled for. This sounds trivial but may be ignored by a number of researchers who are less familiar with the design of the survey at hand. Omitting the language region in a simple pooled OLS model would result in an interviewer=male coefficient of -.356, and this estimate would amount to -.260 if region is controlled. The latter comes very close to our estimate of -.254 in a RE model and -.255 in a FE model. Of course FE models are not without problems: FE models yield biased gender of interviewer coefficients if a changed interviewer gender goes with a parallel change of a related (unobserved) variable. For example, if men tend to interview at differ-ent times than women and these differdiffer-ent times are correlated with attitudes of the then recruited respondents, the gender of the interviewer coefficient will be biased. However we believe that our random respondent-interviewer assignment and our control variables yield sufficiently unbiased gender of the interviewer coefficients for the variables analyzed.
Literature
Adenskaya, L., & Dommeyer, C. (2011). Can perfume increase the response rate to a face-to-face survey? International Business and Economics Research Journal, 3(2), 37-43. Atkin, C.K., & Chaffee, S.H. (1972). Instrumental response strategies in opinion interviews.
Public Opinion Quarterly, 36(1), 69-79. doi: 10.1086/267976
Ballou, J., & DelBoca, F.K. (1980). Gender interaction effects on survey measures in tele-phone interviews. Paper presented at the 35th annual meeting of the American
Associa-tion of Public Opinion Research, Mason, Ohio.
Benstead, L. (2013). Effects of interviewer-respondent gender interaction on attitudes to-ward women and politics: Findings from Morocco. International Journal of Public Opinion Research Online publication date: 27-Sep-2013. doi: 10.1093/ijpor/edt024 Bernardi, L., Ryser, V.-A., & Le Goff, J.-M. (2013). Gender role-set, family orientations,
and women’s fertility intentions in Switzerland. Swiss Journal of Sociology, 39(1), 9-31. Blekesaune, M., & Quadagno, J. (2003). Public attitudes toward welfare state policies a comparative analysis of 24 nations. European Sociological Review, 19(5), 415-427. doi: 10.1093/esr/19.5.415
Callegaro, M., De Keulenaer, F. Krosnick, J.A., & Daves, R.P. (2005). Interviewer effects in a RDD telephone pre-election poll in Minneapolis 2001. An analysis of the effects of interviewer race and gender. Proceedings of the American Statistical Association, 60th Annual Conference of the American Association for Public Opinion Research,
3815-3821.
Catania, J.A., Binson, D., Canchola, J., Pollack, L.M., Hauck, W., & Coates, T.J. (1996). Effects of interviewer gender, interviewer choice, and item wording on responses to questions concerning sexual behavior. Public Opinion Quarterly, 60, 345-375. doi: 10.1086/297758
Cosper, R. (1972). Interviewer effect in a survey of drinking practices. The Sociological Quarterly, 13, 228-236. doi: 10.1111/j.1533-8525.1972.tb00806.x
Davis, D.W. (1997). Nonrandom measurement error and race of interviewer effects among African Americans. Public Opinion Quarterly, 61, 187-207.
Davis, D.W., & Silver, B.D. (2003). Stereotype threat and race of interviewer effects in a survey on political knowledge. American Journal of Political Science, 47(1), 33-45. doi: 10.1111/1540-5907.00003
Davis, R.E. (2008). “Whatever it means to you”: Ethnicity, language, and the survey respon-se in telephone administered health surveys of African Americans. PhD disrespon-sertation, University of Michigan.
Davis, R.E., Couper, M., Janz, N., Caldwell, C., & Resnicow, K. (2010). Interviewer effects in public health surveys. Health Education Research, 25(1), 14-26. doi: 10.1093/her/ cyp046
DeMaio, T. (1984). Social desirability and survey measurement: A review. In C.F. Tur-ner and E. Martin (Eds.), Surveying Subjective Phenomena (pp. 257-282), New York: Russell Sage.
Diekman, A.B., & Goodfriend, W. (2006). Rolling with the changes: A role congruity perspective on gender norms. Psychology of Women Quarterly,30(4), 369-383. doi: 10.1111/j.1471-6402.2006.00312.x
Diekman, A.B. & Schneider, M.C. (2010). A social role theory perspective on gender gaps in political attitudes. Psychology of Women Quarterly, 34(4), 486-497. doi: 10.1111/j.1471-6402.2010.01598.x
Eagly, A.H., Diekman, A.B., Johannesen-Schmidt, M.C., & Koenig, A.M. (2004). Gender gaps in sociopolitical attitudes: a social psychological analysis. Journal of Personality and Social Psychology, 87(6), 796-816. doi: 10.1037/0022-3514.87.6.796
Eagly, A.H., & Steffen, V.J. (1984). Gender stereotypes stem from the distribution of women and men into social roles. Journal of personality and Social Psychology, 46(4), 735-754. doi: 10.1037/0022-3514.46.4.735
Flores-Macias, F., & Lawson, C. (2008). Effects of interviewer gender on survey responses: Findings from a household survey in Mexico. International Journal of Public Opinion Research, 20(1), 100-110. doi: 10.1093/ijpor/edn007
Fowler, F., & Mangione, T. (1990). Standardized survey interviewing: minimizing intervie-wer-related error. Newbury Park: Sage.
Fuchs, M. (2009). Gender-of-interviewer effects in a video-enhanced web survey: Results from a randomized field experiment. Social Psychology, 40, 37-42. doi: 10.1027/1864-9335.40.1.37
Gillikin, J. (2008). Interpenetrated design. In P. Lavrakas (Ed.), Encyclopedia of Survey Research Methods, Sage. doi: http://dx.doi.org/10.4135/9781412963947
Grimes, M., & Hansen, G. (1984). Response bias in sex-role attitude measurement. Sex Ro-les, 10(1-2), 67-72. doi: 10.1007/BF00287747
Groves, R., Cialdini, R., & Couper, M. (1992) Understanding the decision to participate in a survey. Public Opinion Quarterly, 56(4), 475-495. doi: 10.1086/269338
Groves, R., & M. Couper. (1998). Nonresponse in household interview surveys. New York: Wiley.
Groves, R., & Fultz, N.H. (1985). Gender effects among telephone interviewers in a sur-vey of economic attitudes. Sociological Methods and Research, 14, 31-52. doi: 10.1177/0049124185014001002
Groves R., & Magilavy, L. (1986). Measuring and explaining interviewer effects in centra-lized telephone surveys. Public Opinion Quarterly, 50, 251–266. doi: 10.1086/268979 Warren, J.R., & Halpern-Manners, A. (2012). Panel conditioning in longitudinal social
sci-ence surveys. Sociological Methods & Research, 41(4), 491-534.
Huddy, L., Billig, J., Bracciodieta, J., Hoeffler, L., Moynihan, P.J., & Pugliani, P. (1997). The effect of interviewer gender on the survey response. Political Behavior, 19(3), 197-220. doi: 10.1023/A:1024882714254
Hutchinson, K.L., & Wegge, D.G. (1991). The effects of interviewer gender upon response in telephone survey-research. Journal of Social Behavior and Personality, 6(3), 573-84. Kane, E.W., & Macaulay, L.J. (1993). Interviewer gender and gender attitudes. Public
Opi-nion Quarterly, 57(1), 1-28. doi: 10.1086/269352
Klein, M., & Kühhirt, M. (2010). Sozial erwünschtes Antwortverhalten bezüglich der Tei-lung häuslicher Arbeit („Social desirability and Response Bias in case of the division of household labor“). Methoden-daten-analysen, 4(2), 79-104. PID: http://nbn-resolving. de/urn:nbn:de:0168-ssoar-210124.
Lipps, O. (2009). Cooperation in centralised CATI household panel surveys - a contact-based multilevel analysis to examine interviewer, respondent, and fieldwork process effects. Journal of Official Statistics, 25(3), 323-338.
Lipps, O., & Lutz, G. (2010). How answers on political attitudes are shaped by interviewers: Evidence from a panel survey. Swiss Journal of Sociology, 2, 345-358.
Liu, M., & Stainback, K. (2013). Interviewer gender effects on survey responses to marria-ge-related questions. Public Opinion Quarterly, nft019.
Lueptow, L.B., Moser, S.L., & Pendleton, B.F. (1990). Gender and response effects in tele-phone interviews about gender characteristics. Sex Roles, 22 (1/2), 29-42. doi: 10.1007/ BF00288152
Makarova, E., & Herzog, W. (2015). Gender roles within the family: A study across three language regions of Switzerland. Psychology of Gender through the Lens of Culture
Morgan, S.L., & Winship, C. (2014). Counterfactuals and causal inference. Cambridge Uni-versity Press.
Murphy, E., & Oesch, D. (2015). The feminization of occupations and change in wages: A panel analysis of Britain, Germany and Switzerland. SOEP papers, 731.
OECD (2006). Women and men in OECD countries. Accessed Jan 20, 2014: http://www. oecd.org/std/37962502.pdf.
O’Muircheartaigh, C., & Campanelli, P. (1998). The relative impact of interviewer effects and sample design effects on survey precision. Journal of the Royal Statistical Society: Series A (Statistics in Society), 161(1), 63-77.
Paulhus, D. (2002). Socially desirable responding: The evolution of a construct. In H. Braun, D. Jackson, & D. Wiley (Eds.), The role of constructs in psychological and educational measurement (pp. 49-69). Mahwah: Erlbaum.
Pratto, F., Stallworth, L.M., & Sidanius, J. (1997). The gender gap: Differences in political attitudes and social dominance orientation. British Journal of Social Psychology, 36(1), 49-68. doi: 10.1111/j.2044-8309.1997.tb01118.x
Roberts, C., Jäckle, A., & Lynn, P. (2006). Causes of mode effects: Separating out interview-er and stimulus effects in comparisons of face-to-face and telephone surveys. AAPOR - ASA Section on Survey Research Methods, 4221-4228.
SFSO (Swiss Federal Statistical Office) (2015). Gender equality – Economic activity of mo-thers. Accessed Oct 26, 2015: www.bfs.admin.ch/bfs/portal/en/index/themen/20/05/ blank/key/Vereinbarkeit/01.html.
Snell Dohrenwend, B., Colombotos, J., & Dohrenwend, B. (1968). Social distance and inter-viewer effects. Public Opinion Quarterly, 32(3), 410-442.
Tu, S., & Liao, P. (2007). Social distance, respondent cooperation, and item nonresponse in sex survey. Quality and Quantity, 41, 177–199. doi: 10.1007/s11135-007-9088-0 Voorpostel, M., Tillmann, R., Lebert, F., Kuhn, U., Lipps, O., Ryser, V.-A., Schmid, F.,
An-tal, E., Monsch, G.-A., & Wernli, B. (2015). Swiss Household Panel user guide (1999-2014), Wave 16, December 2015. Lausanne: FORS.
Wilde, A., & Diekman, A.B. (2005). Cross-cultural similarities and differences in dynamic stereotypes: A comparison between Germany and the United States. Psychology of Women Quarterly, 29(2), 188-196. doi: 10.1111/j.1471-6402.2005.00181.x
West, B., Kreuter, F., & Jaenichen, U. (2013). “Interviewer” effects in face-to-face surveys: A function of sampling, measurement error, or nonresponse? Journal of Official Statis-tics, 29(2), 277-297. doi: 10.2478/jos-2013-0023
West, B., & Olson, K. (2010). How much of interviewer variance is really nonresponse error variance? Public Opinion Quarterly, 74(5), 1004-1026.
Widmer, E., Levy, R., Pollien, A., Hammer, R., & Gauthier, J. A. (2003). Entre standardisa-tion, individualisation et sexuation: une analyse des trajectoires personnelles en Suisse.
Appendix
Dependent variable questions with number observations, means
and standard deviations
The questions are asked in German, French or Italian, depending on the language of the respondent. Details of the wording in the different languages (including Eng-lish), for example in wave 13, can be found at: http://www.swisspanel.ch/IMG/pdf/ QuestionML-P-W13.pdf
Gender
‒ Do you have the feeling that in Switzerland women are penalized compared with men in certain areas? (0=not at all penalized, …, 10=strongly penalized) ‒ Are you in favor of Switzerland taking more steps to ensure the promotion of
women? (0=not at all in favor, …, 10=totally in favor)
‒ To have a job is the best guarantee for a woman as for a man to be independent. (0=completely disagree, …, 10=completely agree)
‒ A pre-school child suffers, if his or her mother works for pay. (0=completely disagree, …, 10= completely agree)
Politics
‒ Are you in favor of Switzerland having a strong army or for Switzerland not hav-ing an army? (2=strong army, 1=neither nor, 0=no army)
‒ Are you in favor of Switzerland offering foreigners the same opportunities as those offered to Swiss citizens or in favor of Switzerland offering Swiss citizens better opportunities? (2=same opportunities, 1=undecided, 0=in favor of better opportunities for Swiss citizens)
‒ Are you in favor of Switzerland being more concerned with protection of the environment than with economic growth, or in favor of Switzerland being more concerned with economic growth than with protection of the environment? (2=in favor of stronger protection of the environment, 1=undecided, 0=in favor of stronger economic growth)
‒ Are you in favor of Switzerland having nuclear energy, or are you in favor of Switzerland not having nuclear energy? (2=in favor of Switzerland having nuclear energy, 1=undecided, 0=in favor of Switzerland not having nuclear energy)
Household Tasks
‒ Generally, who takes care of the cleaning or tiding up in your household? (1=mostly me, 0=another person)
‒ Generally, who takes care of the washing or ironing in your household? (1=mostly me, 0=another person)
‒ Generally, who manages the finances in your household? (1=mostly me, 0=another person)
‒ Generally, who does the administration in your household? (1=mostly me, 0=another person)
‒ On average, how many hours do you spend on housework (washing, cooking, cleaning) in a normal week?
Health
‒ How much do you weigh (in kg without clothes)?
‒ During the last 4 weeks, have you suffered from headaches? (0=not at all, 1=somewhat or very much)
‒ How is your health in general? (scale reversed to 4=very bad, 3=bad, 2=fair, 1=good, 0=very good)
‒ Do you often have negative feelings such as having the blues, being desperate, suffering from anxiety or depression? (0=never, …, 10=always)