*Corresponding author: Naga Swetha C ISSN: 0976-3031
Research Article
PARTIAL SHADING CONDITION DETECTION WITH SMOOTH MAXIMUM POWER
POINT TRACKING OF PV ARRAYS USING INCREMENTAL CONDUCTANCE METHOD
AND FUZZY LOGIC
Naga Swetha C., Sujatha P* and Bharath Kumar P
Department of Electrical and Electronics Engineering, JNTUA, Anantapur, AP, India
DOI: http://dx.doi.org/10.24327/ijrsr.2018.0905.2098
ARTICLE INFO ABSTRACT
An improved analysis of maximum power point tracking by using incremental conductance method and fuzzy logic of solar photovoltaic array under partial shaded condition is proposed in this paper. Maximum Power Point Tracking can minimize the system cost and maximize the array efficiency. The proposed system is simple and cost effective. When the PV array is under PSC, there may be many peak points in the P-V characteristic of PV arrays. Out of these only one peak point will be global maximum power point. Though there are many conventional maximum power point tracking (MPPT) methods, these methods are unable to extract maximum power under this condition. In this paper, a two-stage MPPT method is presented to overcome this drawback. In the first stage, a method is proposed to determine the occurrence of Partial Shading Condition(PSC), and in the second stage, by using a new algorithm that is based on the ramp change of the duty cycle and continuous sampling from the P-V characteristic of the array, global maximum power point of array is reached. Since open loop operation is used, the implementation of the proposed method is cheap and simple. The IC algorithm and fuzzy logic controller are designed to control the duty cycle of Buck Boost converter and to ensure the MPPT work at its maximum efficiency. These methods are robust in the context of changing environmental conditions and array characteristics, and have minimum negative impact on the connected power system. By using the simulation results we can analyze the proposed methods.
INTRODUCTION
As the demand of energy is increasing day by day it is more desirable to switch to the renewable energy sources and solar photovoltaic system is ideal source of green energy. These PV systems can be operated by either connecting to the grid or as stand-alone structures. The major disadvantage of PV power generation systems is that the amount of electric power generated by PV module varies with the change in the weather conditions, i.e., irradiation level. Under Partial shading condition [2] it is important to extract maximum power in PV-fed applications. Hence it is really crucial to use a maximum power point tracking (MPPT) control method to achieve maximum power (MP) output in real time in PV generation systems. Till now many maximum power point tracking (MPPT) methods have been presented [4-21] and used. Most of these consist of two step techniques. In one of the methods [4] after the PSC is detected the load line is moved based on short circuit current and open circuit voltage of the array. In order to obtain GMPP But none of them is able to track the Maximum
Power Point accurately. The conventional and most popular methods used are as follows Perturb and Observe
(P&O), Incremental conductance, Fractional Short Circuit
Current, Fractional Open Circuit Voltage, Fuzzy Control, Neural Network Control etc. [1]. In [5] the method is unable to track GMPP. In [6] P&O method is used and by using the dividing of rectangles method the voltage step sizes are determined. In [7] neural network training under different PSCs is presented, in which the measurement of solar irradiance level and temperature are required. In [9] a distributed maximum power point DMPP is proposed where the current of each module is compensated by regulating its voltage at respective maximum power point. A current transformer (CCT) is used in [10]. In [11], when the PV power changes beyond the threshold then P&O method starts sampling the P-V characteristic of array in 60-70% of open circuit voltage of the module. In [12] P&O method is proposed based in [11] which is similar to [13]. The method in [14] has the good performance but the voltage must be measured at each module which is difficult and time
Available Online at http://www.recentscientific.com
International Journal of
Recent Scientific
Research
International Journal of Recent Scientific Research
Vol. 9, Issue, 5(C), pp. 26653-26662, May, 2018
Copyright © Naga Swetha C., Sujatha P and Bharath Kumar P, 2018, this is an open-access article distributed under the terms of the Creative Commons Attribution License, which permits unrestricted use, distribution and reproduction in any medium, provided the original work is properly cited.
DOI: 10.24327/IJRSR
CODEN: IJRSFP (USA)
Article History:
Received 16th February, 2018
Received in revised form 12th
March, 2018
Accepted 20th April, 2018
Published online 28th May, 2018
Key Words:
consuming. The method in [15] is based on IC and sampling is done in the PV characteristic curve of the array. But it limits the search area as in [11] and also requires high sampling number. In references [16-21] the MPPT is studied as an optimization problem +using PSO method, simulated annealing method and colony of flashing fire flies method. These methods are successful but the sampling number used is so high. It is known from references [22,23] that boost converters undergo some transients to settle the PV array. In [1, 19] a typical PSO method is used which has the low speed. In [18] the PSO method is modified to improve in complexity and speed. In [20] a method based on the firefly algorithm is proposed. This method has the better speed and efficiency
compared to the PSO method. The main purpose of this paper
is to study and compare two maximum power point tracking (MPPT) methods in a photovoltaic simulation system. The methods used are Incremental Conductance method and Fuzzy Logic Controller.
The main element of a Photo Voltaic system is PV array that constitutes a set of PV modules connected in series and parallel. There is a non linear relation between voltage and current in a PV array, where maximum power is generated under only one operating voltage. Therefore, extracting maximum power from a Photo Voltaic system in all operating conditions is the main target of its control. Partial Shading Condition (PSC) is the phenomenon in which all the modules of an array do not receive the constant solar irradiance level [2]. Conventional MPPT techniques are not able to detect the global maximum power point (GMPP) under PSC; these methods normally track local peaks.
Usually, a good MPPT algorithm that is able to detect PSC should have the following properties:
1. Should be able to track the MPP rapidly to get high efficiency,
2. The implementation must be with a low computational load,
3. The use of sensors must be less and the cost must be user friendly (removing current sensors of boost converter reduces the cost drastically),
4. The disturbance to the connected grid must be minimum.
In this paper, two new MPPT algorithms are presented which are based on ramp change of the duty cycle and continuous sampling from the P-V characteristic of the array. The advantages of these methods are that: these methods are simple and implementation is cheap due to the open loop operation, though the speed is high it is of adjustable speed, in all conditions the performance is robust and guaranteed, and imposing minimum disturbance to the connected power system. Also these methods have the performance superiority over the currently using methods.
Most of the techniques that are currently in use consist of two steps to attain Global Maximum Power Point. In the first step, the point where the GMPP is present is determined. After the PSC is detected, the load line is moved depending on the short circuit current and open circuit voltage of the array, thus the operating point comes closer to the GMPP, and in the second step, the operating point converges to it. It can be understood
that this technique is unable to track the GMPP under all conditions. These techniques do not guarantee reaching the GMPP. In one of the methods, the MPPT uses a controllable current transformer (CCT) disposed at the terminal of each PV module, this CCT permits the required amount of current in the series path of a PV string. By using a dependent current source the CCT output current can be regulated. Though these methods have high accuracy and they decrease the effect of PS on the array power, their implementation is expensive.
In the above methods, GMPP is obtained by sampling different points of the P-V characteristics of the array. Though these methods are successful, their sampling number is high. As the GMPP can occur in a wide range of the P-V characteristic, initial sampling must cover the entire curve. The proposed method has good performance, but it is required to measure the voltage of each module.
PV Array: Characteristics
Uniform Irradiance Condition
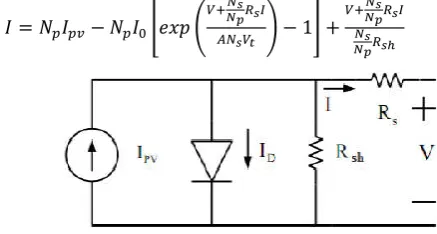
The solar cell is the main element for the implementation of any method. Solar cells are presented in different models in various contexts. Among these models, single-diode model that is shown in Fig. 1 is used in this paper. Based on this model, relation between voltage (V) and current (I) of a PV module is expressed as follows:
= − − 1 − - (1)
Where the equivalent photocurrent of module is denoted by Ipv,
the reverse saturation current of the equivalent diode is denoted by Io, A is the ideal factor, and VT (nskT/q) is the thermal
voltage of module. Rs is the equivalent series and shunt resistance is given by Rsh. For an array with parallel strings,
each consisting of series modules, I-V characteristic under UIC is shown below.
= − − 1 + - (2)
Fig 1 Single-diode electrical model of a PV module
In this work the following symbols are used. Open circuit voltage of PV module is given by Voc-mod, open circuit voltage
of PV string is given by Voc-str, open circuit voltage of PV array
is given by Voc-arr, the voltage of MPP is given as Vmpp, the
voltage of module at its MPP is given as Vmpp-mod, the voltage
of string at its MPP at UIC is given as Vmpp-str, and array
International Journal of Recent Scientific Research Vol. 9, Issue, 5(C), pp. 26653-26662, May, 2018
a
b
c
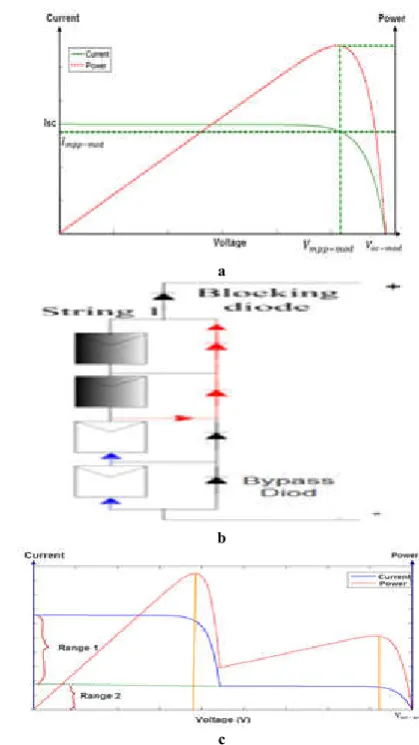
Fig 2 (a) P-V and I-V characteristics of a typical PV module. (b) Structure of a
sample shaded string. (c) P-V and I-V characteristics of the shaded string
In fig 2(a), I-V and P-V characteristics of a typical solar module under UIC are given. The maximum module current is obtained at V=0 and is known as short circuit current (Isc). The
negative current will be flowing for voltages above Voc-mod, but
by using a blocking diode it is forced to zero. In UIC, the maximum power point of module and array are unique and are achieved at Vmpp-mod = αVoc-mod and Vmpp-arr = αVoc-arr = NsV mpp-mod respectively, here α is assumed as a coefficient which is
dependent on model parameters of the solar module.
Partially Shaded Condition
For example if a PV array is subjected to two different irradiance levels, then the modules that get high radiance(HS) level are known as insolated modules and the modules that get very low irradiance(LS) level are known as shaded modules. Generally the insolated modules generate the current in the string. The string current generated in the insolated modules is greater than the current generated in shaded modules. This current passes through the parallel resistance of the shaded modules and generates a negative voltage across them. Hence the shaded modules consume energy instead of generating energy which leads to the drop of the overall efficiency of the string and the development of the hot spots around the shaded modules which may get damaged due to these hot spots. To overcome this problem a bypass diode is connected in parallel to each module so that it will carry the extra current of the
string to pass through it so that the modules may not get damaged. Simultaneously, the module voltage will be about -0.7V and also the string efficiency will improve. The sample shaded array structure is shown in the fig 2(b).
Observations under Partially Shading Condition
Fig 2(b) and 2(c) show the structure and P-V and I-V characteristics of a partially shaded string containing of Ns=4
series modules, nsh=2 shaded modules, and nin=2 insolated
modules in it. For currents that are greater than Isc of the shaded
modules in Range 1, their bypass diodes conduct extra current and cause the voltage across them to be about -0.7 to -1V . During this situation the voltage across the string is divided equally among the insolated modules only. For currents that are less than Isc of the shaded modules in Range 2, insolated
modules operate in approximately constant voltage area, and therefore, the voltage across each of these modules will be more than Vmpp-mod and close to Voc-mod. The P-V characteristic
of the string has two MPPs. Vmpp-1 = ninVmpp-mod - nsh * 0.7 is the
first one and second one Vmpp-2 is at when the voltage of the
shaded module becomes Vmpp-mod. The string voltage in this
local MPP is bound as follows:
< < + - (3)
As the irradiance ratio (IR=HS/LS) decreases, then Vmpp-2 gets
close to the lower bound of (3), and when it increases then Vmpp-2 comes closer to the upper limit. Also, when K = nsh / nin
is very high, then the upper limit of (3) approaches the lower limit, and Vmpp-2 gets close to it. From above it can be known
that in a string the minimum difference of the two local MPP voltages is higher than Vmpp-mod.
Boost Converter Control
A two-stage grid connected solar system is shown in fig (3). In the first stage, DC/DC boost converter plays the important role by controlling its voltage to absorb power from the PV array. In the second stage, to control the output voltage of the DC/DC converter and to generate AC voltage to connect the solar system to the grid an inverter is used. There is little coupling between the two stages because of the DC link capacitor between the boost converter and the inverter, and this helps to study these stages separately.
Fig 3 Overview of a two-stage grid connected PV system structure.
negative value. As the dynamic response of system depends on environment and operating point, this makes it difficult to operate in closed loop condition by using single loop PI voltage controller. To get the desired dynamic response another inner loop is used. This two-loop control method needs two PI controllers and an expensive current sensor.
Where as in open loop control, which is a comm
method for boost converters control, there is no feedback, and the required input voltage is generated, the relation between the input voltage and output voltage of the converter as shown below.
= = (1 − )
In this method, an expensive current sensor is saved as it is not necessary to measure the boost converter inductor current. Although there might be some steady state error and more transients in the system response than in the close loop method. Sampling time is one of the important parameters in MPPT of a PV system. After applying a new command voltage (v the converter, sampling from the array voltage and current must be done after settling the system transient r
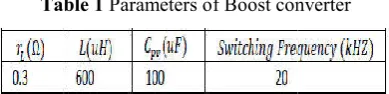
instability and disruption in MPPT, sampling. Therefore, sampling time period must be more than this settling time. For further analysis, response of a PV array connected to a boost converter with open loop control is studied through simulation in Matlab/Simulink environment. Converter parameters are presented in Table I. Output voltage of the boost converter is taken as constant at 250V. Simulated PV array has Voc-arr = 130V and Isc = 8A.
Fig 4 Response of switching and averaged state space models of boost
converter in PV system to step and ramp commands
Table 1 Parameters of Boost converter
The switching and averaged state space models of the system are simulated and their responses to step and ramp command signals by open loop control are shown in Fig. 4. Following conclusions are made from the system response:
1. The responses of the accurate switching model and the averaged state space model are almost identical.
negative value. As the dynamic response of system depends on environment and operating point, this makes it difficult to op condition by using single loop PI voltage controller. To get the desired dynamic response another inner loop control method needs two PI
Where as in open loop control, which is a commonly used method for boost converters control, there is no feedback, and the required input voltage is generated, the relation between the input voltage and output voltage of the converter as shown
- (4) In this method, an expensive current sensor is saved as it is not necessary to measure the boost converter inductor current. Although there might be some steady state error and more n the close loop method. Sampling time is one of the important parameters in MPPT of a PV system. After applying a new command voltage (vinref) to
the converter, sampling from the array voltage and current must be done after settling the system transient response to prevent instability and disruption in MPPT, sampling. Therefore, sampling time period must be more than this settling time. For further analysis, response of a PV array connected to a boost converter with open loop control is studied through mulation in Matlab/Simulink environment. Converter parameters are presented in Table I. Output voltage of the boost converter is taken as constant at 250V. Simulated PV array has
e space models of boost converter in PV system to step and ramp commands
Boost converter
The switching and averaged state space models of the system are simulated and their responses to step and ramp command signals by open loop control are shown in Fig. 4. Following conclusions are made from the system response:
e switching model and the averaged state space model are almost identical.
2. There is some steady state error in the system response to step and ramp command signals. As the MPPT methods are based on sampling from specific points of the array’s P-V characte
operation.
3. Oscillation, overshoot and settling time of the system to step commands is high, especially when the operating point is in the constant current region of the PV array, which impose higher switching stress and
contrast, the ramp response has negligible transient. 4. Settling time of the system step response is about 15ms.
Thus, for MPPT application, sampling time must be more than 15ms. It is noteworthy that r
high, while in practice, for and results in higher settling time.
MPPT is a time varying optimization problem, in which the objective function evaluation is done physically; i.e. by applying specific voltages to the array, its output power is measured after settling its voltage, whereas in the numerical optimization problems, function evaluation is done numerically and imposes calculation burden on the processor. This settling time depends on the design and operating point of PV array. Maximum settling time of the boost converter used in experiment and simulations of this paper is about 20ms.
According to Sec. II, under PSC, the GMPP is in the following voltage region that must be searched for GMPPT:
< <
A straight solution for GMPPT with minimum steps is that sampling from P-V characteristic of the array be done only in specific points. In practice, these methods rely on approximations and cannot guarantee the GMPP
According to the above discussion, two important facts inspire using ramp voltage as the command signal of converter to search the voltage region of (11) for GMPPT:
1. In contrast to the response of the boost converter to step commands, settling time an
boost converter to ramp command is nearly zero(Fig. 4).
2. PV arrays do not have considerable dynamics and can be assumed static. Unlike dynamic systems, then, the measured power at each moment is related to the array voltage at the same m
on the P-V characteristic of the array. Thus, the concept of scanning I
with adjustable high speed ramp command voltage (or ramp change of duty cycle) is proposed in this paper. Along with this ramp input, the array voltage and current is sampled continuously with proper rate.
Partial Shading Condition Detection
An algorithm for PSC detection is presented in this section, which is based on three criteria. The performance of the final algorithm is evaluated in various PS patterns.
PSI index as Partial Shading Condition Detection Criterion
The first proposed criterion is based on a new index that is defined as follows:
There is some steady state error in the system response to step and ramp command signals. As the MPPT methods are based on sampling from specific points of V characteristic, this error can affect their Oscillation, overshoot and settling time of the system to step commands is high, especially when the operating point is in the constant current region of the PV array, which impose higher switching stress and losses. In contrast, the ramp response has negligible transient. Settling time of the system step response is about 15ms. Thus, for MPPT application, sampling time must be more than 15ms. It is noteworthy that rL is considered
high, while in practice, for better efficiency, it is lower and results in higher settling time.
MPPT is a time varying optimization problem, in which the objective function evaluation is done physically; i.e. by applying specific voltages to the array, its output power is after settling its voltage, whereas in the numerical optimization problems, function evaluation is done numerically and imposes calculation burden on the processor. This settling time depends on the design and operating point of PV array. time of the boost converter used in experiment and simulations of this paper is about 20ms. According to Sec. II, under PSC, the GMPP is in the following voltage region that must be searched for GMPPT:
(5) A straight solution for GMPPT with minimum steps is that V characteristic of the array be done only in specific points. In practice, these methods rely on approximations and cannot guarantee the GMPPT.
According to the above discussion, two important facts inspire using ramp voltage as the command signal of converter to search the voltage region of (11) for GMPPT:
In contrast to the response of the boost converter to step commands, settling time and transient of the boost converter to ramp command is nearly zero(Fig. PV arrays do not have considerable dynamics and can be assumed static. Unlike dynamic systems, then, the measured power at each moment is related to the array voltage at the same moment, corresponding to a point
V characteristic of the array.
Thus, the concept of scanning I-V characteristic of the array with adjustable high speed ramp command voltage (or ramp change of duty cycle) is proposed in this paper. Along with this ramp input, the array voltage and current is sampled continuously with proper rate.
Partial Shading Condition Detection
An algorithm for PSC detection is presented in this section, which is based on three criteria. The performance of the final
is evaluated in various PS patterns.
PSI index as Partial Shading Condition Detection Criterion
International Journal of Recent Scientific Research Vol. 9, Issue, 5(C), pp. 26653-26662, May, 2018
= ∆
∆ . = . =
( )
. =
+
. (6)
The above criterion is the normalized derivative of the PV array power respect to the array voltage at Vmpp-arr = NsVmpp-mod
= Vmpp-str, which is similar to the criterion used in Incremental
Conductance method for MPPT. At UIC, because of the constant radiance PSI is zero. But under PSC, as the local MPP voltage changes from Vmpp-arr, hence the PSI is not zero and
depends on the shading pattern. According to Sec. II, when a PV string is under PSC, the voltage across the shaded module (Vmod-shaded) at Vmpp-str = NsVmpp-mod is bound as follows:
< < (7)
From (7) two cases may arise for :
) >
Under the above condition, Vmod-shaded is positive and the
absolute value of is less than its value in UIC, the local MPP of the string is in V>Vmpp-arr, and positive PSI is
obtained.
) <
In this case the shaded modules are bypassed with the bypass diodes. The insolated modules operate in the constant voltage region. Therefore,
(Change in current wrt to voltage in array) is much bigger than its value in UIC; PSI is negative and local MPP of the string is in V<Vmpp-arr.
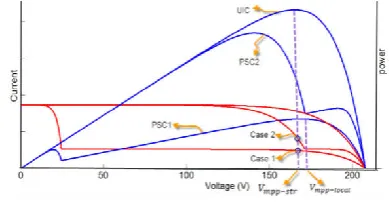
Fig 5 I-V and P-V characteristics of PV string in different PSCs.
A sample of string is taken instead of the entire array and it is tested for the effectiveness of PSI index in PSC detection under different PS patterns. i.e, for simple understanding only two irradiance levels are considered in PSs.
From the results of Sec. II and (3), it can be easily shown that in a shaded string, when the irradiance ratio (IR) is too low or K=nsh/nin is too high; the second local MPP (Vmpp-2) will be
nearer to Vmpp-str. i.e., the PSI index may be near to zero and it
fails to detect partial shading condition. Although the proposed algorithm may rarely mistake in detection of PSCs in the above-mentioned situations, but the main objective, which is
GMPPT, is not lost. To prove this fact, a sample string under PSC (such as the PSCs in Fig. 5) is considered that has two local MPPs; the first one is in the range and has, and the next one is in with the following power relation:
= ≈ . >
( + 1) . = ( + 1) (8)
It is known that when IR is too low or K is too high (the same situation that PSI index may be near zero, e.g. PSC1 in Fig. 5), Pmpp-2 will be much greater than Pmpp-1. Hence, if the PSI does
any mistake in detection of this PSC, then the conventional P&O algorithm used in the UICs tracks the second MPP which is the GMPPT.
Updating Vmpp-arr and Final PS Detection Criteria
Till now, it is understood that Vmpp-arr is available for PSI
evaluation. Generally, Vmpp-arr and Vmpp-mod are dependent on
the type of modules and temperature as in (7); and also, there is some difference between the temperatures of the shaded and insolated modules.
= ∗ 1 − ( − 25) =
∑ ∗∗ 1 − ( − 25) (9)
Where Vmpp-arr-sc and Vmpp-mod-sc are in shaded condition and
Vmpp-arr is under standard condition where (S=1kW/m2, T=25c),
respectively. T is temperature and and are the temperature dependent coefficients of Vmpp-arr and Vmpp-mod,
respectively. It is known that under UIC, the operating voltage of the array is Vmpp-arr. Hence, Vmpp-arr is available continuously.
As it is slightly dependent on irradiance level, it can be updated easily, by using the array current at Vmpp-arr. Under the Partial
Shading Condition, the operating voltage is not Vmpp-arr.
Consequently, Vmpp-arr that is dominantly dependent on the
temperature of the array is not available.
When the relatively fast transient phenomena like the passing clouds is the reason for partial Shading, then the change in temperature is not rapid, and hence, the temperature is almost identical in all modules. Or else, the temperatures of the shaded and insolated modules are different; and this temperature difference is proportional to the difference of the radiation levels. Therefore to update Vmpp-arr, temperatures of all modules
must be measured, this method is not economical. Hence, in the proposed algorithms only the temperature of one sample module is used for updating Vmpp-arr. To update these parameters
and are used. In this situation, it is not clear whether the sample module is insolated or shaded. Accordingly, three cases may be fronted as follows:
1. Here the whole array is assumed to be in UIC, and the temperature of all modules is the same as the sample module temperature. Thus, there will be no error in updating in this case, and UIC can be detected using the PSI index.
2. In this case, the array is in PSC and the sample module is insolated. In this case because of the negative value of for all types of modules and in (7), the updated value of Vmpp-arr will be less than its real value.
Therefore, the calculated value of PSI and the difference between the real local MPP voltage and the updated Vmpp-arr (named∆⃓Vmpp − arr) will be greater than its
3. In this case the array is in PSC and the sample module is shaded. In this case, as the value of is negative, the updated value of Vmpp-arr is greater than its real value.
Hence, the calculated value of PSI and the difference between the local MPP voltage and the updated Vmpp-arr
will be smaller than its real value and may be even zero. Therefore, success of the proposed algorithms may be affected. In this situation, voltage of the sample module is measured while the array voltage is at updated value of Vmpp-arr. Clearly, voltage of the sample module at this
point is quite different from the updated value of V mpp-arr(named∆|Vmpp − mod|) when the array is under PSC.
Otherwise, their difference will be nearly zero. This modification ensures success of the proposed algorithm for PS detection.
Based on the above discussion, the PSI index criterion is dependent on two other criteria. These two criteria are defined based on normalized values of and that are defined in the above. Finally, the criteria for PS detection will be as follows.
| | > 0.001
∆
> 0.02 (10)
∆
> 0.02
The thresholds that are specified in (10) are determined according to the simulations of many PS scenarios on various structures of PV array. If at least one of the above criterions is met then the array is said to be under PSC. The flow chart for the proposed algorithms for PS detection is shown in the fig.6. The proposed PSC detection does not impose any considerable disturbance on the system, since PSI is evaluated at Vmpp-arr. It
can be observed that and may be non-identical because there may be a difference in the module models in the array. Here the following variablesVmpp-arr-sc, Vmpp-mod-sc, may
change due to aging. Nevertheless, they can easily be updated online when the array is under UIC. The effectiveness of the algorithm is independent from uniformity of modules and their aging.
Fig 6 Flow chart for the proposed algorithms for PS detection
A string of series modules is used to study the proposed algorithms. In (6), it is understood that PSI of an array is the weighted average PSI of individual strings and for the detection of PSC in any array, the PSI and two other criteria in (8) are used.
= ∆
∆ . | =
∑ ∆
∆ .∑ = ∑ ∑ (11)
Where Pi and ΔPi are the power of string i and it’s differentiate,
respectively.
Incremental Conductance Method
In incremental conductance method the array terminal voltage is always adjusted according to the MPP voltage i.e., incremental conductance is compared with the instantaneous conductance of the PV array.
= - (12) If the above equation is true then the array voltage is equal to the MPP voltage and the controller maintains the same voltage till the irradiation value changes and this process is repeated. This method is based on the observation of the maximum power point.
Here we assume that
= 0 - (13)
= ( . )= + - (14)
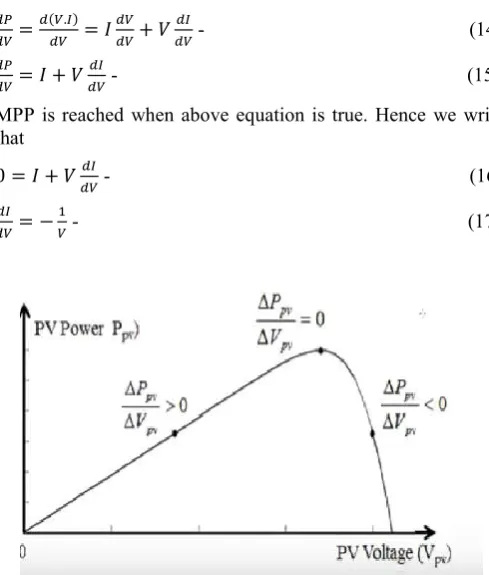
= + - (15) MPP is reached when above equation is true. Hence we write that
0 = + - (16) = − - (17)
Fig 7 Incremental conductance method on a P-V Curve of solar module
Fig-6 shows that the slope of the P-V array power curve is zero at The MPP, increasing on the left of the MPP and decreasing on the Right hand side of the MPP. The basic equations of this method arementioned below.
= −1
> −1
< − ℎ (18)
International Journal of Recent Scientific Research Vol. 9, Issue, 5(C), pp. 26653-26662, May, 2018
incremental conductance of P-V module and the right hand side represents the instantaneous conductance. When the ratio of change in output conductance is equal to the negative output conductance, the solar array will operate at the maximum power point.
Incremental Conductance MPPT Algorithm
The algorithm works as follows
In the first step the voltage of the PV array is read and then the current of the array are taken by the controller at some operating point k. Let us assume the values as Vk and Ik. Then
after giving some delay the same readings are taken at the operating point Vk-1 and Ik-1. The difference in both the voltages
and currents are calculated by the controller ΔVk and ΔIk . Now
there may be two different situations i.e., if ΔVk =0 then the
controller calculates the difference between the currents i.e., ΔIk as shown in step 5. If the difference of the currents ΔIk < 0
then the present value of current is less than the previous value, in this case we have to increase the duty cycle because the voltage of PV array is less than the Vmpp i.e., the operating point
is on the left side of the PV curve. The process is repeated after increasing the duty cycle.
Now let us assume that ΔVk ≠ 0 then it checks whether +
= 0, if the condition is true then the voltage is Vmpp , if the
condition is not true then the controller either increases the duty cycle or decreases accordingly till the condition is true. Then the process is repeated.
Here the peak power of the module will be above 98% of its incremental conductance. The Flow chart of incremental conductance MPPT is shown below.
Fig 8 Flow chart for Incremental conductance method
Fuzzy Logic Controller
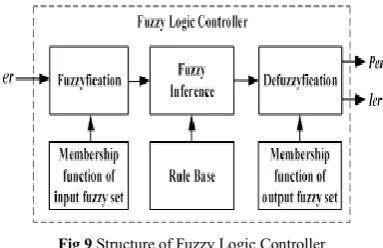
Fuzzy logic can be defined in many ways.In other terms this can be explained as the logical system that is a mutilate logic extension. The structure of fuzzy logic controller is shown in the fig.9. The fuzzification block is used to process input signals and assign a fuzzy value to the input signals. The interpretation of data by taking certain set of rules and their membership functions into consideration is done by the interface mechanism. Then the defuzzification block is responsible for the conversion of the fuzzy information coming from the interface system to the non-fuzzy information. In this work a fuzzy controller is used with two input variables error in voltage (E) and change in error in voltage (CE) and the output (D).
The triangular membership function is used for the fuzzification process.For the inputs E, CE, and output D seventriangle membership functions are used. The membership functions for the above variable can be seen in the fig 10 (a), (b), (c) below.
Fig 9 Structure of Fuzzy Logic Controller
The 7 membership functions for all three variables are expressed by linguistic variables positive big(PB), positive medium (PM), positive small (PS), zero (ZE), negative small (NS), negative medium (NM), negative big (NB). A rule in the rule base can be expressed in the form: If (e is NB) and (de is NB), then (cd is PB). The rules are setbased upon the knowledge of the system and the working of the system. In table 2 the 49 rules can be viewed that are applied to the controller. The two inputs E and ΔE are represented by rows and columns. The intersection of both is the output D.
Fig 10(a) Membership Function of Input1
Fig 10(c) Membership Function of Output
Table 2 Rule base for Fuzzy Logic Controller
e/Δe NB NM NS ZE PB
NB PB PB PB PM PM
NM PB PB PM PM PS
NS PB PM PS PS ZE
ZE PB PM PS ZE NS
PB PM PS ZE NS NM
PM PS ZE NS NM NM
PS ZE NS NM NM NM
SIMULATION RESULTS
In this section, performance of the methods proposed for tracking of GMPPunder PSC is evaluated in various aspects using simulations and experiments.
Simulation Results
The methods that are compared are the P&O method, Incremental Conductance method and by
controller method. In the below graph the characteristics for PV curve are shown under UIC condition and two different PSC conditions.
Fig 12 P-V characteristics of array in UIC and two different PSCs
Simulation results are presented in the fig (13) and fig (14), and the efficiency of the proposed MPPT algorithm is compared with the P&O method and incremental conductance method and fuzzy logic. In the simulation of the proposed methods, analog to digital conversion time of processor i
voltage and current of the array is considered 0.5ms, which is achievable by a low-speed micro controller. Also, the voltage ramp for searching the GMPP is set to 4000 V/s. The proposed algorithm tracks the GMPP in all cases rapidly in lowe 70ms.
Here by giving the ramp inputthe array voltage is varied; bythis process the speed of tracking increases and also the transients and stress on the converter is reduced.This type of input also has extra benefits in terms of interaction with t
grid (Fig. 3)i.e., in the system, the inverter must deliver all generated PV power to the grid rapidly for regulating the voltage of the output capacitor of boost converter. Therefore, changing the array power leads to changing the injected po
Membership Function of Output
Controller
PM PS
PS ZE
ZE ZE
NM NB
NM NB
NB NB
NB NB
NB NB
section, performance of the methods proposed for tracking of GMPPunder PSC is evaluated in various aspects
The methods that are compared are the P&O method, Incremental Conductance method and by using fuzzy logic controller method. In the below graph the characteristics for PV curve are shown under UIC condition and two different PSC
y in UIC and two different PSCs
in the fig (13) and fig (14), and the efficiency of the proposed MPPT algorithm is compared with the P&O method and incremental conductance method and fuzzy logic. In the simulation of the proposed methods, analog to digital conversion time of processor in measuring the voltage and current of the array is considered 0.5ms, which is speed micro controller. Also, the voltage ramp for searching the GMPP is set to 4000 V/s. The proposed algorithm tracks the GMPP in all cases rapidly in lower than
Here by giving the ramp inputthe array voltage is varied; bythis process the speed of tracking increases and also the transients and stress on the converter is reduced.This type of input also has extra benefits in terms of interaction with the connected grid (Fig. 3)i.e., in the system, the inverter must deliver all generated PV power to the grid rapidly for regulating the voltage of the output capacitor of boost converter. Therefore, changing the array power leads to changing the injected power
to the grid, and it yields voltage transients at the point of grid connection. Step changes in the array voltage, and consequently, the array power impose greater voltage transients, while changing the array voltage with ramp yields lower transients and much better power quality.
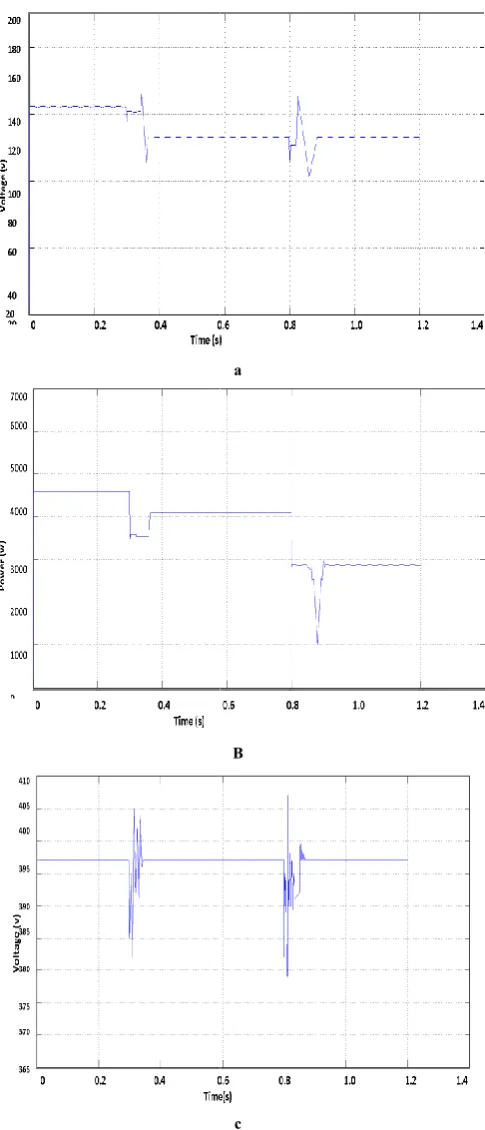
Fig 13 MPPT process with the Incremental Conductance Method.
(a) array voltage, (b) array power, and (c) grid voltage.
to the grid, and it yields voltage transients at the point of grid connection. Step changes in the array voltage, and consequently, the array power impose greater voltage transients, while changing the array voltage with ramp yields
d much better power quality.
a
B
c
International Journal of Recent Scientific Research
a
b
c
Fig14 MPPT process with the Fuzzy Logic Method.
(a)array voltage, (b) array power, and (c) grid voltage.
l Journal of Recent Scientific Research Vol. 9, Issue, 5(C), pp. 26653-26662
MPPT process with the Fuzzy Logic Method.
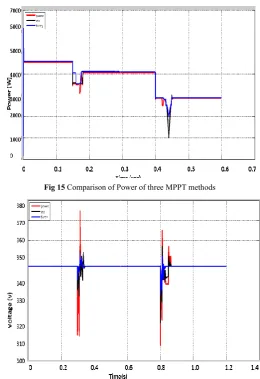
Fig 15 Comparison of Power of three MPPT methods
Fig 16 Comparison of Voltage of three MPPT methods
Since sampling from of the array P
methods are done with specific intervals which depend on the model of modules, non-identical modules in the array affect their Efficiency. In contrast, the proposed MPPT algorithm is completely independent from the modules make and model.
CONCLUSION
In this work a partial shading detection algorithm was implemented. There are placing a simple and fast algorithm which is denoted as the increment condition of MPPT under PSC that operates as direct control method and needs no feedback control of current and voltage. And another algorithm based on the fuzzy Logic controller. Simulation results validate the performance of the proposed method in speed and accuracy. This work was aimed to explore the p
maximum power point tracking system which implements Incremental Conductance (IC) method and Fuzzy Logic Control method. The comparison shows a promising performance for the proposed reconfigurable PV array compared to the conventional PV a
inverters approaches. Also from the comparison graphs shown in the fig (13) and fig (14) compares the power and voltage of the P&O method, IC method, and Fuzzy Logic Controller method. It can be observed that the output from t
method has fewer distortions compared to P&O method and IC method. According to the performance of the proposed
26662, May, 2018
of Power of three MPPT methods
Comparison of Voltage of three MPPT methods
Since sampling from of the array P-V characteristic in these methods are done with specific intervals which depend on the identical modules in the array affect their Efficiency. In contrast, the proposed MPPT algorithm is
ndependent from the modules make and model.
GMPPT method (fuzzy logic) we have following advantage which is given below: (i) It is simple and can be implemented with a cheap microcontroller like AVR; (ii) It has a high adjustable speed; (iii) Because of the smooth change of power in comparison with other methods (P&O method and IC method), it has minimum negative impact on the connected power system; and (iv) Its efficiency is guaranteed and is not dependent to the model of modules.
References
1. T. Esram and P. L. Chapman, "Comparison of Photovoltaic Array Maximum Power Point Tracking Techniques," Energy Conversion, IEEE Transactions on, vol. 22, pp. 439-449, 2007
2. Y.-J. Wang and P.-C. Hsu, "An investigation on partial shading of PV modules with different connection configurations of PV cells," Energy, vol. 36, pp. 3069-3078, 2011.
3. D. Kun, B. XinGao, L. HaiHao, and P. Tao, "A MATLAB-Simulink-Based PV Module Model and Its Application Under Conditions of Nonuniform Irradiance," Energy Conversion, IEEE Transactions on, vol. 27, pp. 864-872, 2012.
4. J. Young-Hyok, J. Doo-Yong, K. Jun-Gu, K. Jae-Hyung, L. Tae-Won, and W. Chung-Yuen, "A Real Maximum Power Point Tracking Method for Mismatching Compensation in PV Array Under Partially Shaded Conditions," Power Electronics, IEEE Transactions on, vol. 26, pp. 1001-1009, 2011.
5. E. Koutroulis and F. Blaabjerg, "A New Technique for Tracking the Global Maximum Power Point of PV Arrays Operating Under Partial-Shading Conditions," Photovoltaics, IEEE Journal of, vol. 2, pp. 184-190, 2012.
6. N. Tat Luat and L. Kay-Soon, "A Global Maximum Power Point Tracking Scheme Employing DIRECT Search Algorithm for Photovoltaic Systems," Industrial Electronics, IEEE Transactions on, vol. 57, pp. 3456-3467, 2010.
7. Syafaruddin, E. Karatepe, and T. Hiyama, "Artificial neural network-polar coordinated fuzzy controller based maximum power point tracking control under partially shaded conditions," Renewable Power Generation, IET, vol. 3, pp. 239-253, 2009.
8. Abdalla, J. Corda, and L. Zhang, "Multilevel DC-Link Inverter and Control Algorithm to Overcome the PV Partial Shading," Power Electronics, IEEE Transactions on, vol. 28, pp. 14-18, 2013.
9. P. Sharma and V. Agarwal, "Exact Maximum Power Point Tracking of Grid-Connected Partially Shaded PV Source Using Current Compensation Concept," Power Electronics, IEEE Transactions on, vol. 29, pp. 4684-4692, 2014.
10. C. Woei-Luen and T. Chung-Ting, "Optimal Balancing Control for Tracking Theoretical Global MPP of Series PV Modules Subject to Partial Shading," Industrial Electronics, IEEE Transactions on, vol. 62, pp. 4837-4848, 2015.
11. H. Patel and V. Agarwal, “Maximum power point tracking scheme for PV systems operating under
partially shaded conditions,” IEEE Trans. Ind.Electron., vol. 55, no. 4, pp. 1689-1698, Apr. 2008.
12. Y. Wang, Y. Li, and X. Ruan, “High accuracy and fast speed MPPT methods for PV string under partially shaded conditions,” IEEE Trans.Ind. Electron., vol. PP, p. 1, 2015.
13. A. Kouchaki, H. Iman-Eini, and B. Asaei, “A new maximum power point tracking strategy for PV arrays under uniform and non-uniform insolation conditions,” Sol. Energy, vol. 91, pp. 221-232, 2013.
14. C. Kai, T. Shulin, C.Yuhua, and B. Libing, “An improved MPPT controller for photovoltaic system under partial shading condition,” IEEE Trans. Sustainable Energy, vol. 5, no. 3, pp. 978-985, Jul. 2014. 15. T. Kok Soon and S. Mekhilef, “Modified incremental conductance algorithm for photovoltaic system under partial shading conditions and load variation,” IEEE Trans. Ind. Electron., vol. 61, no. 10, pp. 5384-5392, Oct. 2014.
16. L. Yi-Hwa, H. Shyh-Ching, H. Jia-Wei, and L. Wen-Cheng, “A particle swarm optimization-based maximum power point tracking algorithm for PV systems operating under partially shaded conditions,” IEEE Trans. Energy Convers., vol. 27, no. 4, pp. 1027-1035, Dec. 2012.
17. K. Ishaque, Z. Salam, M. Amjad, and S. Mekhilef, “An improved particle swarm optimization (PSO)-based MPPT for PV with reduced steady-state oscillation,” IEEE Trans. Power Electron., vol. 27, no. 8, pp. 3627-3638, Aug. 2012.
18. K. Ishaque and Z. Salam, “A deterministic particle swarm optimization maximum power point tracker for photovoltaic system under partial shading condition,” IEEE Trans. Ind. Electron., vol. 60, no. 8, pp. 3195-3206, Aug. 2013.
19. M. Miyatake, M. veerachary, F. Toriumi, N. Fujii, and H. Ko, “Maximum power point tracking of multiple photovoltaic arrays: A PSO approach,” IEEE Trans. Aerospace Electron. Syst., vol. 47, no. 1, pp. 367-380, Jan. 2011.
20. K. Sundareswaran, S. Peddapati, and S. Palani, “MPPT of PV systems under partial shaded conditions through a colony of flashing fireflies,” IEEE Trans. Energy Convers., vol. 29, no. 2, pp. 463-472, Jun. 2014.
21. S. Lyden and E. Haque, “A simulated annealing global maximum power point tracking approach for PV modules under partial shading conditions,” IEEE Trans. Power Electron., vol. PP, p. 1, 2015.
22. G. Petrone, G. Spagnuolo, R. Teodorescu, M. Veerachary, and M. Vitelli, “Reliability issues in photovoltaic power processing systems,” IEEE Trans. Ind. Electron., vol. 55, no. 7, pp. 2569-2580, Jul. 2008. 23. X. Weidong, W. G. Dunford, P. R. Palmer, and A.
Capel, “Regulation of photovoltaic voltage,” IEEE Trans. Ind. Electron., vol. 54, no. 3, pp. 1365-1374, Jun. 2007.