Analyzing Land Use and Change Detection in Eastern
Nigeria Using GIS and Remote Sensing
E. C. Merem1,*, Y. Twumasi2, J. Wesley1, M. Alsarari1, S. Fageir1, M. Crisler1, C. Romorno1, D. Olagbegi1,
A. Hines3, O. S. Mwakimi4, E. Nwagboso5, S. Leggett6, D. Foster1, V. Purry1, J. Washington1
1Department of Urban and Regional Planning, Jackson State University, Jackson, MS, USA 2Department of Urban Forestry and Natural Resources, Southern University, Baton Rouge, LA, USA 3Department of Public Policy and Administration, Jackson State University, Jackson, MS, USA 4Institute of Resource Assessment, University of Dares Salam, Dares Salam, Tanzania 5Department of Political Science, Jackson State University, Jackson, MS, USA
6Department of Behavioral and Environmental Health, Jackson State University, Jackson, MS, USA
Abstract
The pace and pattern of various forms of land use change and degradation continues at alarming proportion in several areas in Sub-Saharan Africa. Given the emergent risks, recurrent subsidence and erosions rank as permanent features in some areas of the continent like Nigeria. This exacerbates natural constraints on agricultural production and poor soil quality with damage to natural areas. The severity of gullies in all that, drive the destruction of vast areas in Eastern Nigeria due to intense farming and other elements. All these types of degradation cause declines in the productive capacity of land through reduced yields. For policy makers, the problem is difficult to determine precisely due to limited access to geo-spatial assessment as a decision support tool. Accordingly, there is an urgent need for regular use of such devices in assessing the severity of land degradation and change. To fill that void, this study analyzes land degradation issues in Eastern Nigeria with the latest advances in GIS and remote sensing technologies. Emphasis is on the issues, impacts, factors, efforts and remedies. In terms of methodology, the paper adopts a mix scale approach involving descriptive statistics coupled with geo-spatial technologies of GIS and remote sensing. The results from the use of these techniques point to widespread changes involving gains, declines and degradation in the region’s landscape over the years. While the size of land types devoted to agriculture, bare soil, forest and urban land surged in the study area, bushland, grassland and areas covered by water declined from 2000 to 2017. The region also experienced greater threats from the exposure to recurrent land degradation as manifested with the occurrence of erosion hazards across various sites. The emergent spatial patterns not only revealed concentration of agricultural land class along the upland northern axis of the region along Ebonyi and Enugu and clusters of forest cover on the lower south part (Imo and Abia). GIS mappings showed the dispersion of erosion hazards in some of the states. With change attributed to a host of factors raging from competing land use made up of mining, agriculture, ineffective policy, poor conservation and environmental and physical elements. The paper suggested the need for education, effective policy, local participation, soil conservation and the design of regional land use information system as remedies.Keywords
Land Degradation, Land Use Assessment, GIS, Remote Sensing, Soil Erosion1. Introduction
In the past decades, the pressures from unsustainable arable land use, urban development and degradation continues to take a toll on natural systems. From the risks, soil erosion remains the biggest environmental problem globally creating mishaps in developing nations [1]. The pace and patterns of various forms of land use change and
* Corresponding author:
[email protected] (E. C. Merem) Published online at http://journal.sapub.org/ajgis
Copyright©2019The Author(s).PublishedbyScientific&AcademicPublishing This work is licensed under the Creative Commons Attribution International License (CC BY). http://creativecommons.org/licenses/by/4.0/
degradation have now reached alarming proportions in Sub-Saharan African nations [2, 3]. Realizing the hazards, recurrent droughts not only raise the vulnerability levels in critical ecosystems, and landscapes in the continent, but changing climatic parameters intensifies stress levels on land uses from agriculture to wildlife. Accordingly, land degradation forms including erosion and depletion of soil nutrients, salinization, agrochemical pollution, vegetative cover clearance from overgrazing and farm induced deforestation threaten ecosystem stability in West Africa, including Eastern Nigeria [4, 5]. The ecological peril from erosion constitutes a serious calamity ravaging Nigeria’s changing landscape. Being a nation where more than 6,000 km2 of the land base suffer from erosion with almost
ample agricultural land degradation resulting in output drops of around 30% to 90%, and 5% deficit on farm GDP. Erosion also inflicts overwhelming impacts on community livelihoods known to obliterate the critical structures driving development. In the South East where ecological damages of gully erosion are over $100 million annually, the region is burdened by systematic removal of soil particles, including plant nutrients and the destruction of lives and properties in many localities [6, 7].
In Nigeria, evidence indicates a deteriorating human-land interface and relationship in which negative changes in landscape quality keeps lowering both the productivity and aesthetic quality of the natural environment, with serious effects on the economy due to erosion [8]. Seeing that declining soil fertility and erosion threaten the ability to produce enough food in rural areas. Current efforts to meet the demand for new settlements in urban environments via competing land uses, have quickened the conversion of arable land to urban development [9, 10]. Besides, earth materials like sand and gravels required for urban development often came from widespread landscape destruction [11]. In such settings, the expansions of urban areas into sensitive natural areas are jeopardizing the carrying capacity of the environment. As a result, the impact of the most common form of human-induced soil degradation caused by land use activities in the case of Nigeria, consist of deforestation, bush burning and biodiversity depletion [12]. Given the impacts on natural habitats, deforestation in the Eastern rainforest zone opens the land to forces driving soil degrading catalysts (water erosion and flooding) in a way that accelerates the washing away of the fertile topsoil and leaching. Clearly, the Eastern zone is a typical gully region in Nigeria [13]; where over 90% of the land area suffer from sheet, rill and gully erosion. The presence of gully sites is one of the hazard features that characterize this zone and the adjoining states [14]. Accordingly, Eastern Nigeria has been experiencing severe land degradation that is constraining farm production through poor soil quality and damage to natural areas [15]. From the threats posed by various forms of erosion and their sites spread across the region amidst improper land management, erosion creates serious production problems due to loss of topsoil and declining soil nutrients [16-18].
Up till now, studies on the area have been confined to select single sites instead of multi appraisal of vulnerable spots. In previous work, Ofomata [19]; classified degradation variables of soil erosion solely in Anambra into multi areas tagged mild, moderate and severely gullied. For policy makers, the issues in multi scales is difficult to determine due to limited access to geo-spatial information techniques as decision support tool. Evaluating the potentials for sustainable land management in the region in these settings, requires feasible analytical tools in tracking changes in landcover and degradation in multi sites [20, 21]. The availability of Landsat data has created the opportunity to use GIS and remote sensing technology to map and monitor temporal-spatial diffusion of land degradation from
poor land use practices [22-25]. So, there is an urgent need for regular use of geo-spatial technology in undertaking change detection analysis in land cover and degradation problems in the East. GIS and remote sensing are vital and assists in integrating land information in a way that helps managers understand and address most pressing problems of degradation [26]. They provide the basis for making timely decisions by helping organize data on the problems and to understand their spatial relationships [27, 28]. Considering this, fitting policies are required to ensure viable land-protection strategies and better management, if Eastern Nigeria is to meet the needs of its citizens.
This study analyzes change detection in land use and degradation issues in Eastern Nigeria with the latest advances in GIS and remote sensing technologies. Emphasis is on the issues, impacts, factors, and remedies. In terms of methodology, the paper adopts a mix scale approach involving descriptive statistics coupled with geo-spatial technologies of GIS and remote sensing. The first objective of the paper is to provide information for proper land use planning while the second objective aims to generate a tool for effective environmental management and soil conservation. The third objective is to design a framework to aid decision makers in advancing the use of geospatial information technologies in the protection of land resources in a tropical environment and the fourth objective is to contribute to the literature. The paper has five sections. The first part consists of the introduction. Section two covers the methods and materials while section three describes the results, impacts, and the factors associated with land degradation and efforts. Sections four and five highlight the discussions, conclusions and recommendations.
2. Methods and Materials
erosion. The most seriously affected areas include Nanka, Agulu and Oko all in Anambra State, some parts of Abia, Imo and Enugu States in the study area. Even though gully erosion types are the most visible forms of erosion in Nigeria mainly because of the notable imprint they leave on their path. More than 1.6% of the entire land area of Eastern Nigeria is occupied by gullies [34]. That is quite substantial in the zone considering that it has the largest population concentration of 500 people per km2 in Nigeria [34]. Prior to
the 1980’s, the usual gully sites in the region were those in Agulu, Nanka, Ozuitem and Oko in Aguata area, Isuikwuato and Orlu [34]. With the rising development activities, the magnitude escalated, forcing governments at the helm in the region to set up soil erosion control measures in different states. Even as the governments intervened through mitigation measures, more erosion spots resurfaced with impunity [35]. Undoubtedly, the Southeastern zone of Nigeria ranks high as an epicenter of gully erosion.
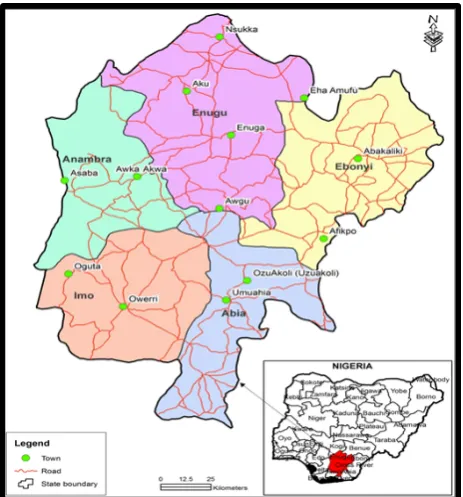
Figure 1. Study area location of South Eastern Region
Table 1. The Distribution of Population in the South East
States Population
Abia 3,727,300
Anambra 5,271,800
Ebonyi 2,800,400
Enugu 4,411,100
Imo 5,408,800
Total 21,619,400
With soil erosion as one of the prominent natural disasters that has negatively affected people, their property and environment such as land, farms, crops and income. The major dilemma in all these, stems from the land use system in which most of the land in rural Nigeria are zoned
for Agriculture. The communities in such places who depend on the environment currently besieged by land erosion for their livelihoods face harsher times. The occurrence of land degradation in such settings over the years resulted in gullies at more than 1000 sites. The effects of these gullies are currently spread over five Eastern states (Anambra, Abia, Imo, Enugu, and Ebonyi states) [9]. Amongst the five Eastern states, Anambra state stands as the worst hit as a result of the topography and the nature of soil with over 700 erosion sites located in the state alone. The most severe cases are found in the Amankwa, Ekwulobia, Nnewi, Agulu, and Ideani areas where human induced gullies exacerbate soil erosion by turning the sites into deeper and wider channels for run off waters. Just as the phenomena of gully erosion come mainly from human activities caused by deforestation, unsustainable farming practices, path and road construction and poorly designed drainage systems. Gully erosion takes place when wear and tear on the land surface forces rainwater to accumulate on one area causing loss of vegetation cover, localized erosion and the formation of gullies [16-18]. The problem grows as interconnecting systems of gullies spread across the land surfaces. The resulting run off from the hillsides often pollutes the water supply, while landslides threaten villages and highway travellers. Since the severity of gullies resulted in the destruction of vast areas in Eastern Nigeria, soil degradation in terms of loss of nutrients and breakdown of structure persists largely, due to intense farming and other variables [10, 34, 35]. During the rainy seasons in some of the affected areas like Anambra state, large areas of agricultural lands, residential areas and human lives are lost in certain cases to the spreading of gullies. Thus, the Udi area in Enugu offers an example of where communities in fragile ecosystems struggle to survive the menace of degradation prompted by competing landuse (coal mining) and others. In the process, vast farm lands in the area have become erosion alleys due to mining. Whereas the heavy precipitation in the Eastern zone produces thriving terrain for disastrous soil erosion in the area. Thus, the biggest danger to the ecology of Southeastern Nigeria is the gradual but constant fragmentation of the land through erosion by water. This must be analyzed using a mix-scale model of descriptive statistics, as well as GIS and remote sensing.
2.1. Method and Materials
Environment. While the regional, state and federal geographic identifier codes of the country were used to geo-code the info contained in the data sets. This information was processed and analyzed with basic descriptive statistics, and GIS and Remote Sensing techniques with attention paid to the temporal-spatial trends at the state and regional levels in the South Eastern region of Nigeria. The relevant procedures consist of quartet of steps listed below.
2.2. Step 1: Identification of Variables, Data Gathering and Study Design
The first step involves the identification of the variables needed to assess environmental change at the regional level. The variables consist of socio-economic and environmental information, including population, spectral signature, path row, erosion, eroded soils, number of erosion sites, erosion depth, length, width, the percentage of erosion and sites. The others cover severity of erosion, soil loss volume, and land cover types, percentage of land use types, land cover change, agricultural land, bare soil size, bushland, forest type area, and amount of grassland, water bodies and urban areas (Table 2). This process continued with the design of data matrices for variables covering the various periods from 2000 to 2017. In addition to the design stage, access to databases and abstracts that are presently available within the Federal archives in Nigeria, The United States National Aeronautical and Space Agency (NASA), the University of Maryland free Online Data Services and host of other organizations helped facilitate the search process. The spatial data acquired from NASA consists of six Satellite images for the multiple periods of 2000, 2001, 2003, 2016 and 2017. The process continued with the design of data matrices for socio-economic and environmental variables covering the periods from 1979, 1987, 2005, 2009 and 2016. The design of spatial data for the GIS analysis required also the delineation of national and regional boundary lines. With boundary lines unchanged, a common geographic identifier code was assigned to each of the units to ensure analytical coherency. In line with the task at hand, the geo-spatial aspects of the land cover change assessment were performed based on the following phases made up of 1) image acquisition and pre-processing, 2) classification and collection of the training signatures, 3) post-classification processing, and 4) land cover change analysis and cross tabulation.
2.3. Step 2: Geospatial Image Procurement and Pre-processing
Under the image and preprocessing phase, temporal analyses of land cover change required a proper selection and preparation to ensure the compatibility of the Landsat images. In this study, where the images were selected from the same season (July-September) with minimal cloud cover (<10%), they came from a different sensor with similar spectral resolution 1.e. 30metres. While the images used were from the Landsat Enhanced Thematic Mapper (ETM)
and Landsat Operational Land Imager (OLI) for year 2000 and 2017 respectively. With time, the other images were downloaded from freely available United States Geological Surveys (USGS) and Earth Explorer websites via https://earthexplorer.usgs.gov/website. In the process, the study area was covered by Landsat scenes with path and row numbers listed as follows: p188r055, p188r056, p189r055 and p189r056 (Table 2). Among the other components, on the one hand, the Landsat Ecosystem Disturbance Adaptive Processing System (LEDAPS) comes under a NASA project to map disturbance, regrowth, and permanent forest conversion across the continent. On the other, the LEDAPS processes Landsat imagery to ensure surface reflectance required using atmospheric correction routines developed for the Terra MODIS instrument for analytical purposes [36].
2.4. Step 3: Classification and Collection of the Training Signatures
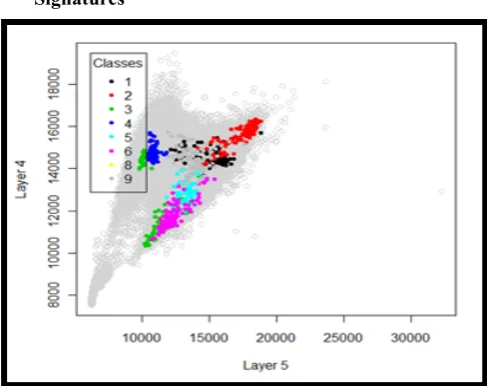
Figure 2. Spectral Signature Plot Generated by the RF Classifier (path 188 raw 56)
has several advantages when compared with other image classification methods. It is non-parametric, easy to be parameterized, not sensitive to over-fitting; good at dealing with outliers in training data, and it is able to calculate useful information about errors, variable importance and other data outliers. This information can be used to evaluate the performance of the model in a way that makes changes to the training data if necessary.
Table 2. Landsat scenes with Path and Rows Numbers
Scene number Sensor Date of acquisition
P188r056 Landsat 8(OLI) 04/01/2016
Landsat ETM 08/01/2003
P188r055 Landsat 8(OLI) 06/01/2017
Landsat ETM 04/03/2000
P189r056 Landsat 8(OLI) 15/03/2016
Landsat ETM 09/01/2001
2.5. Step 4: Post-classification Processing, Land Cover Change Analysis and Cross Tabulation
To improve classification accuracy and reduction of misclassifications, post-classification refinement was therefore used for simplicity and effectiveness of the method [38]. Post classification has been successfully used by various researchers in urban environment due to its efficiency in detecting the location, nature and rate of changes [39]. Post-classification processing included recoding, majority filtering, clumping, elimination and mosaicking. The classified images were recoded to the seven classes, i.e. bare soil, bushland, agriculture, grassland, urban area, water and forest. Then a 3 by 3 majority filter was employed to the recoded image to reduce the salt and paper effect and lastly the classes where filtered to a minimum mapping unit of about 0.5 ha to conform to the forest definition, i.e. minimum size is 0.5 ha. Change detection is one of the most important applications of remote sensing techniques due to its capability of repetitive acquisition of imageries with consistent image quality, at short intervals, on a global scale, and during complete seasonal cycles. The Land cover change detection was done using Arc GIS10.3 software. The two classified Land cover layers i.e. Land cover 2000 and 2017 were used. The spatial analytical tool using the zonal tabular area function was applied to generate land cover change matrix. The function calculates cross-tabulated areas between two datasets and produces a table. The table displays a record for each unique value of the zone dataset and a field for each unique value of the class dataset. The calculated geometry was used to calculate the areas (in hectares) of each land cover in the matrix. The land cover classified scenes were finally vectorised to a shapefile format. The remaining procedure involves spatial analysis and output (maps-tables-text) covering the study period, using Arc GIS 10.3. The spatial units of analysis consisted of the states located in the Eastern region (Table 1). Outputs for
the region were mapped and compared cross time. This process helped show the extent of temporal-spatial evolution of ecological change of land degradation induced by human activities in the selected areas of South Eastern region of Nigeria (Table 3).
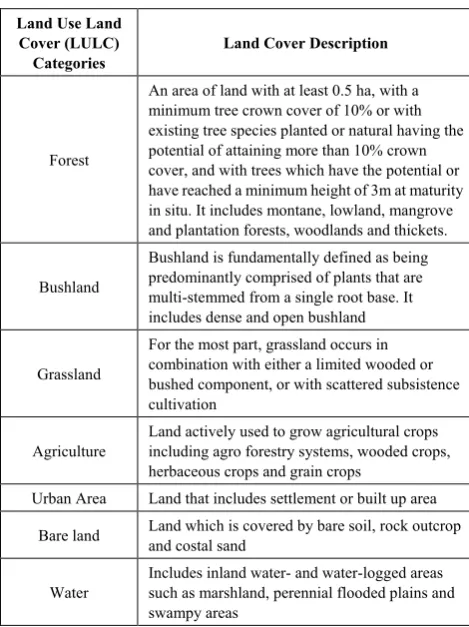
Table 3. Land Use Cover Types
Land Use Land Cover (LULC)
Categories Land Cover Description
Forest
An area of land with at least 0.5 ha, with a minimum tree crown cover of 10% or with existing tree species planted or natural having the potential of attaining more than 10% crown cover, and with trees which have the potential or have reached a minimum height of 3m at maturity in situ. It includes montane, lowland, mangrove and plantation forests, woodlands and thickets.
Bushland
Bushland is fundamentally defined as being predominantly comprised of plants that are multi-stemmed from a single root base. It includes dense and open bushland
Grassland
For the most part, grassland occurs in combination with either a limited wooded or bushed component, or with scattered subsistence cultivation
Agriculture Land actively used to grow agricultural crops including agro forestry systems, wooded crops, herbaceous crops and grain crops
Urban Area Land that includes settlement or built up area
Bare land Land which is covered by bare soil, rock outcrop and costal sand
Water Includes inland water- and water-logged areas such as marshland, perennial flooded plains and swampy areas
3. The Results
This portion of the paper presents the results of the data and environmental analysis of the land use and change detection. There is an opening focus on the analysis and distribution of land use and land cover change, and the impacts of land degradation (erosion) in the study area. This is followed by GIS mapping of the patterns and erosion dispersion coupled with the identification of factors and efforts of institutions.
3.1. Land Use/Land Cover Change in South Eastern Nigeria 2000-2017
areas under its cover as it dropped from 0.7% to 0.3%. The urban area land type as 1% of the total area at one time, posted a 3.9% increase in size at another period. Note also that forest area ranged from 19.19% to 20.5%. Other aspects of the change involve the agriculture class increasement of 32.8% to 35.9% followed by the slow uptick in bare soil total share from 0.8% to 1.3%. The comparison of each class (2000 and 2007) showed that there has been a marked land use and land cover change during the study period of 17 years. From the 2000-2017 periods, the percentage area covered by agriculture in the study area rose by 9.45% (Table 4). Such increasing pattern pertaining to the rate of land cover/land use variation in the area indicates that economic forces have major influence on change. Along with these developments, there is always an inclination towards the construction of new pavements, highways, roads and other structures to ensure access to common amenities. It has also been observed that the urban settlements are mostly surrounded by agricultural areas. This means that the adjoining sites near the major population centers have been cleared to produce crops to serve the necessities of life [40].
The area covered by water class has also witnessed a decrease from 2000 to 2017. The percentage decrease in land area covered by this class was -36%. The land cover/land use changes observed in all other classes affected the water class during the two decades. Easy access to water resulted in the depletion of water and ended in dried up tributaries and its replacement by either compact surfaces or barren land. Increases in agricultural activities especially along the water areas also results in the decline of water and hydrological stress. Another reason for the shrinkage was an increased rate of surface runoff due to lack of plant roots to withhold the water. As the runoff exceeded recharge capacity of ground water, it resulted in the lowering of water table. Increased rate of green cover loss especially in the bushland class also contributed to the increases in surface runoff. The major accelerators of vegetation decline within bushland in the area are human activities like illegal forest wood cutting due to high market value and the rigorous use of forest wood for meeting household requirements like cooking and heating and for timber production. In addition to these, ineffective management of forests and plant diseases also played an important role in bushland decline (Table 4).
3.2. The GIS/RM Analysis
The GIS and Remote Sensing analysis of land use and cover involves spatial distribution of the various land classes from agriculture to bushland and their patterns of change between 2000 to 2010 throughout the states. The other components of the analysis encompass the mappings and geo-visuals pinpointing the spread and concentration of erosion hazards in the South Eastern region as well.
Not surprisingly, based on the maps, forest landscapes appeared much more ticker in distribution along the lower
southern edge of both maps. This seems to be the prevailing trends in both Imo and Abia axis of the study area of Eastern Nigeria. Another notable feature of importance that characterize the distribution of land cover areas from agricultural landscape to areas under water stems from the vast presence of agriculture land cover represented in yellow color. Being fully concentrated along the states on upper side of the regional map from Anambra in the West to Enugu in the North and the farm rich Ebonyi state in the North Eastern side of the map, affirms the dominance of farms in these areas. Looking at the first map images in the 2000 fiscal year, the intense presence of agricultural land space did stretch through robustly from the upper left side of the map to the right-hand corner representing the upland states of Anambra, Enugu and Ebonyi. Thus, the notable presence of farm lands in the three upland states as the map indicates, surpassed the available agricultural space in the two (southerly) low-lying states of Imo and Abia. Considering their location in the vicinity of the moist rainforest ecozone of the country, the two southernmost states on the lower edge of the study area had notable clusters of areas covered with forest land in greater volumes in the 2000 fiscal year. This coincides also with sketchy appearance of bare soil coupled with the minor patches of bush land in central Imo and Abia as well as the upper side of Anambra. The other places in space where such spatial patterns surfaced amidst the substantial spread, involves the upper sides of Enugu and small portions of Ebonyi state in comparison to the other states in the zone. With more grassland visible in the Savannah belts of Enugu and Ebonyi states, urban land area showed more coverage in the Enugu area followed by a relatively fewer patches in built up environments in Anambra, Abia, and Imo. In 2000, the image further revealed more land cover areas under water in the Anambra North west axis (Figure 3).
clusters of that land cover are visible in the two lowland states of Imo and Abia. Lastly, the hydrological dimensions of the land cover change show that it stayed firm in the Anambra area while grassland seemed very minuscule in space. Also, the patterns of bare soil coverage were quite meagre among the areas in the south Eastern zone based on the 2017 image (Figure 3).
Further look on the threats from gully erosion among the five South Eastern states reflects images of multiple configurations differentiated in the colors of light blue, light green, yellow and light red under the varying scales of 10 to over 30% clustered in the adjoining areas. Of these states, Anambra in the red color along the western part of the south east region and Enugu in the northern zone (represented in yellow) experienced higher rates more than the other states with 20.1-30% to more than 30% of the reported gully erosion hazards ravaging the South East. The trio of other states, Imo and Abia state in the lower south and Ebonyi in the north east zone also had their share of gully erosion problems estimated at 15.1-29% to 10-15% (Figure 4).
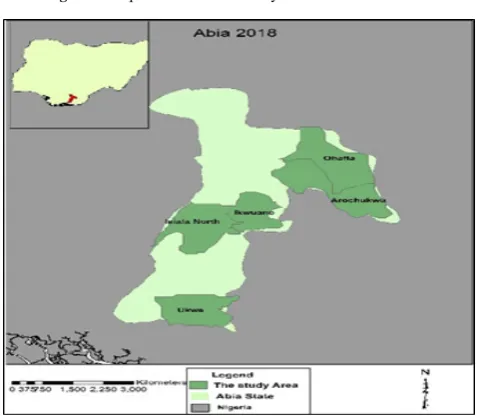
In the case of Anambra state, all the major gully erosion sites of the state are fully concentrated in the southern part compared to the northern and western zones. The gravity of the hazards stems from the close spread of the sites from Akpo to Umuchi. This means that cities and towns within the vicinity of the threats are not spared of the emergent impacts in the form of damages and the discomfort which gully erosion leaves on its path (Figure 5). The spatial distribution of the gully sites in Abia, showed an even spread across the state with some of that in the North east areas of Ohafia and Arochukwu and the central local government areas of Ikwuano and and Isalla Ngwa followed by Ukwa in the Southern part of the state (Figure 6).
Figure 3. Land Cover Change in the South East, 2000 and 2017
Figure 4. The Distribution of Gully Erosion Hazards
Figure 5. Spatial Clusters of Gully Sites in Anambra State
3.3. Erosion Impact Assessment in Eastern Nigeria
Considering the problems of soil erosion within the South East Zone, the analysis of the effect of erosion on soil structure during 2012 period in four localities in Abia state under different scales reveals there was considerably enough silt in eroded soils compared to non-eroded soils. This could be attributed to the damage or disappearance to biological binding materials by torrential storm events, resulting to the loss of better-quality soil elements moved aside by the power unleashed from erosion and inundation.
The collective steadiness of soils appears diminished by erosion, particularly at 2.0mm. Normally, silt and clay structure in battered soils shrank remarkably while sand composition grew bigger, signifying major impacts on surface water movement that degraded the nimbler silt and clay in the soils analyzed. The comparisons of collective strength of both eroded and non-eroded soils, also point to numerical variance at 0.6 mm and 1.0mm respectively, nonetheless there exists an extremely substantial drop of cumulative stability in battered soils at 2mm collective mass (Table 5).
The display of gully erosion threats in the Anambra axis of the South Eastern region of Nigeria in 2012 involves about 11 localities at various sites. The Table highlights their physical attributes in terms of elevation, depth, length, width and state. Of the 11 active sites listed across Anambra state, the elevation levels varied from Umuchuinana area to Ekwulobia from the medium and high scales of 278, 290, mm to 749 mm followed by the lower elevations of 144 mm 190 mm at Agulu-ezechukwu and Agulu.
Based on the erosion forms as denoted by v and u shapes spread across the communities, site 4 at Nanka not only surpassed the others nearby in every statistical indicator associated with gully erosion, but it accounted for the highest levels in terms of depth, length and width estimated at 66m, 2900m, and 349m. In other words, the situation at Nanka remains overly grave compared to the depth, length and width levels of 60 m, 1010m and 42m at Ekwulobia and the other localities in the state. The trio of other communities most notably Umuchu, Nkpologu, Agulu-ezechukwu and Agulu saw threatening exposures of gully erosion during the same period with notable sizes (depth, length and width) running from 10, 1550, and 12mm, to 25,1800 to 73m. The other visible measures of gully erosion in Anambra include the remaining ones (12 m, 1200m, 23m to 20m, 1200m, 86m) for Agulu-ezechukwu and Agulu areas of the state (Table 6).
Regarding the erosion problems based on info on the table, out of the 2,300 gully erosion sites at an average of 460, among the states in the study area, Anambra and Enugu led the way with 700 to 600 sites which represents some 30.43 to 26.08%. On the second-tier group of states comes Imo, Abia and Ebonyi with many sites (450, 300 to 250) representing 19.56, 13.04 to 10.86 percentage points. With little or no success towards remediation, the state of these sites ranged from active to dormancy (Table 7). The distribution of gully
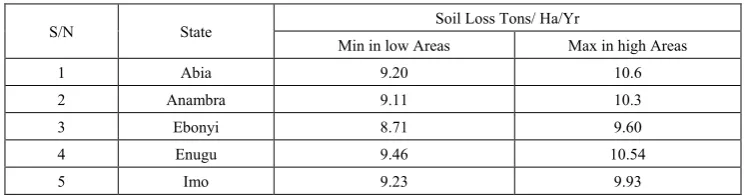
sites severity in 2008 in the region along three categories (mild and moderate and severe) shows the patterns in Anambra to be relatively identical (at 35.1 to 27.8 and 37.1) while Abia and Ebonyi vacillated between 79.4 to 20.6% and 47.4 to 52.6% respectively. Elsewhere both Enugu and Imo states had slightly identical values (80.8 to 19.2 and 88.1 to 11.9) regarding gully sites severity (Table 8). Aside from the stability in soil loss volumes per year along low and high lying areas among the states in the South Eastern region, both Abia Enugu and Imo accounted for similar levels (9.20- 10.16 tons, 9.46-10.54, 9.23-9.93 tons) in soil depletion at minimum and maximum levels in the area (Table 9).
3.4. Other Aspects of the Impacts of Land Degradation in the South East Region
In putting this into perspective, it has been appraised that more than 90 percent of the land suffer from sheet, rill and gully erosion. For that, many communities in southern Nigeria have faced countless sufferings due to the land degradation risks in the form of severe gullying, disappearance of agricultural land areas, river silting, dislocation of villages and towns, menace to green cover, destruction of homes and assets, as well as livelihoods and personal misery. Being in a zone which experiences the risk of landslides, which is common in places with high levels of rainfall, soil erosion and deforestation due to unsustainable land management [41]. Soil erosion, especially the gully type, remains an advanced level of land degradation that has irreversibly affected the soil productivity potentials in southern Nigeria.
In this area of the nation, about 3,000 gullies run through a 10 km land mass along with numerous slices spread onto the rural or urban lands. Within the South Eastern region, gullies and areas exposed to erosion has increased. The total part impacted by rill, sheet or gully erosion did rise by nearly 1.33% (1,021 km2) in 1976 to roughly 3.7% (2,820 km2) in
2006 [42]. In the face of the recurrent problems, the geo environmental hazards linked to gully erosion in southern Nigeria as a common nightmare for communities, has resulted in the dislocation of millions of citizens in the Eastern zone.
Table 4. Land Cover/land Use Classes and Areas in Hectares
Land Use/ Cover Types Coverage Land Cover Change
2000 2017 2000-2017
Ha % Ha % Ha %
Agriculture 936,587 32.8 1,025,152 35.9 88,565 9.45
Bare Soil 22,240 0.8 37,125 1.3 14,885 66.92
Bushland 816,077 28.6 659,166 23.1 -156,911 -19.22
Forest 566,924 19.9 585,348 20.5 18,424 3.2
Grassland 459,988 16.1 421,700 14.8 -38,288 -8.3
Water 19,945 0.7 12,595 0.4 -7,350 -36
Urban Area 29,867 1.0 110,542 3.9 80,675 270
Total 2,851,628 100. 2,851,628 100. NA NA
Table 5. Effects of Erosion on Aggregate Stability in Soils of Abia state
Location 0.6mm 1mm 2mm
E NE E NE E NE
Isikwuato 5.8 4.5 4.0 4.3 3.6 5.8
Ohafia 7.2 6.7 3.0 2.3 3.1 5.9
Ukwa 6.9 7.6 5.6 4.8 4.1 4.5
Ikwuanno 4.1 4.3 4.1 5.7 3.3 6.5
Lsd 1.9 1.4 0.9
Source: Umuanurichi, 2012.
Table 6. Gully Erosion in Anambra State, South East Nigeria
S/N Gully Site Elevation Depth (m) Length (m) Width (m) State /Geometry
1 Umuchiana 278 18 1010 70 Active/U-shaped
2 Achina 290 10 155 2 Active/V-shaped
3 Umuchu* 222 10 1550 12 Active/V-shaped
4 Nanka 249 66 2900 349 Active/U-shaped
5 Nkpologu* 210 25 1800 73 Active/U-shaped
6 Agulu-ezechukwu 144 12 1200 23 Active/V-shaped
7 Eziniffite 260 3 900 8 Active/V-shaped
8 Akpo 200 17 25 18 Active/V-shaped
9 *Agulu 190 20 1200 86 Active/V-shaped
10 Umuchu -B 200 12 165 12 Active/V-shaped
11 Ekwulobia 749 60 1010 42 Active/V-shaped
Source: Oboadi, 2011
Table 7. The Problems of Gully Erosion
S/N State No of Gully Sites % State
1 Anambra 700 30.43 Mostly active
2 Abia 300 13.04 Some active/some dormant
3 Ebonyi 250 10.86 Mostly minor gully sites
4 Enugu 600 26.08 Some active/some dormant
5 Imo 450 19.56 Some active/some dormant
Total/Avg NA 2300 100 Avg/460
Table 8. The Distribution of Gully Sites Severity by States
S/N State Mildly Gullied areas Moderately Gullied areas Severely Gullied areas
1 Anambra 35.1 27.8 37.1
2 Abia 79.4% 20.6% na
3 Ebonyi 47.4% 52.6% na
4 Enugu 80.8 19.2 na
5 Imo 88.1 11.9 na
Source: Igbokwe, 2008.
Table 9. The Distribution of Gully Sites Severity by States
S/N State Soil Loss Tons/ Ha/Yr
Min in low Areas Max in high Areas
1 Abia 9.20 10.6
2 Anambra 9.11 10.3
3 Ebonyi 8.71 9.60
4 Enugu 9.46 10.54
5 Imo 9.23 9.93
3.5. Factors Responsible for Changing Land Use
Pertaining to the elements influencing land use variations and rising degradation, they do not operate in isolation. They are associated with land use practices of sand mining and agriculture, policy and poor conservation, environment and technology as well as settlement patterns, development and population. These elements are noted in detail in the following paragraphs.
3.5.1. Sand Mining and Agricultural Land Use Practices The indiscriminate roadside excavation of soil to meet the demands of new developments in built up areas has been identified as part of the variables associated with land degradation in the study area. Being among the most lucrative crafts in South Eastern Nigeria, sand excavations are continually carried out by individuals along the existing road sides with impunity. In some of these unsustainable land use sites, the action of flood water from rains, accelerates the washing off of the land surface as it moves with sand deposits leading to road blockages at times. Seeing the poorly regulated nature of the activities, unauthorized excavations of sands commercially, eventually develops into huge gullies where rainwater inflicts extensive damages. For that, sand mining, which is often seen as a development activity, constitutes a major ecological problem in various parts of Eastern Nigeria. With the dominance of agriculture in these areas, it has the greatest concentration of poverty-stricken landless workers, small tenant farmers and the rural unemployed who toil miserably daily to eke out a living. In the search for survival including the use of fuel wood since they cannot afford fossil fuel, large portions of vegetation cover are cleared for farming purposes, thereby exposing the top soil to erosion. With the soil exposed in that way, it is no longer capable of resisting the erosive actions of
rainwater. The continuing action of the rain favours high rate of infiltration, enough to lubricate the underlying strata. Such practices of peasant farmers bring further destruction to landscape biodiversity and forest conservation, hence the linkages to degradation in the zone.
problems amounts to limited allocation of resources for conservation programs, the gaps in environmental education of the public continues to fuel land degradation [43]. 3.5.3. Environment, Physical Variables and Technology
Both rainfall and runoff factors, soil types, vegetation and technology must be considered in assessing land use issues prompted by water erosion. In most of the states, the soil is typically wobbly and quite permeable. The soil elements are not consolidated and therefore separate without difficulty when affected by flood. This really accelerates the expansion of deep and wide gullies seen in the region. The impact of raindrops on the soil surface can break down soil aggregate materials such as very fine sand, silt and clay quickly. In those conditions, organic matter can be easily removed by raindrop splash and runoff water. Heavy raindrop energy in the region not only move considerable amount of sand and gravel particles, but soil erodibility as an estimate of the ability of soils to resist erosion based on the physical characteristics of each soil seems limited in the East. In the South East where soil is made of fine red sand, these attributes tend to intensify the propensity to erosion during runoffs. The loss of green cover due to unsustainable landuse practices in the study area has been quite rampant over the years with grave repercussions for soil quality and land preservation. This is further compounded by limited access to modern scientific infrastructure in ecological monitoring in the South East region. The absence of appropriate technologies in confronting these problems, renders the monitoring of land stress in the region quite ineffective. 3.5.4. Settlement Patterns and Urban Development
Settlement patterns tied to housing and infrastructural development contribute to the development of gullies and the resultant degradation in the region in several ways. In so far as, settlements are not planned, houses are built indiscriminately without consideration to natural flood paths and drainage system. Added to that, human activities such as roadside excavation of borrow pits and the absence of functional drainage systems, which cause runoff to wash off roads, pose serious geohazards to the citizens of South Eastern Nigeria. In these places, infrastructures such as roads are built without proper environmental studies and this tends to quicken the gulling processes. The dense population distribution within the area is implicated as well. With population pressures, the urge to ensure the availability of shelter alongside needy amenities intensifies land stress in the process. When not properly managed as is always the case in the region, construction of new houses and roads tend to exacerbate the issue. For example, Anambra State has probably the highest population density in the whole of Sub-Saharan Africa. With gully erosion destroying much of the land surface, there is always high population pressure for housing, water supply, road construction, and power utility distribution networks among others. This results in massive pressure on the available land which often leads to more
excavation of soil on fragile areas pushed beyond their limits. The desperate and unplanned move to meet the need for more housing in these settings, only creates favourable condition for gullies. In Anambra where there is a very high land consumption rate, the state accounts for the highest concentration of active gully sites in the region [11].
3.6. Mitigation Efforts
From the extent and nature of the land use change coupled with recurrent degradation occurring in the area and the major forces triggering them. Different measures have been crafted to contain the effects on the surrounding ecology of the South East region. For more on the efforts of various entities and stakeholders in regional landscape rehabilitation, please refer to Appendix 1.
4. Discussion
Using mix scale approach made up of GIS, remote sensing and descriptive statistics at the state and regional level. The paper assessed land use and land cover change in Eastern Nigeria from 2000-2017 with emphasis on the issues, impacts, factors, and efforts. Based on the analysis, the study area saw changes in the form of gains and declines. Aside from increases in farm land and bare soil areas, forests and urban land cover did surge in the zone. Given the potentials, the diverse ecosystem, the proximity to the moist tropical rainforest and the vast network of other land cover types clustered therein. The region’s propensity to various forms of land degradation especially gully erosion and other types of land hazards has not enabled it over the years to fully reap the benefits of ecosystem stability and biodiversity. In the face of urbanization involving the encroachment of new settlements and thriving farming operations and extensive forested areas, the region’s critical landscape indicators like grassland, water cover, and bush land still plummeted remarkably. While all these may be associated with conflicting land uses and unsustainable management of the ecosystem. Being an epicenter of land hazards and ecosystem under stress, the South East remains burdened by recurring degradation with notable impacts on the communities.
research, the situation appears further compounded by the sudden disappearances of water bodies and bush lands. Also, what gets overlooked in all these is that bushland referred as to as land which holds remnant vegetation with its unique floral attributes and structure is vital in the ecosystem. Given their role as essential sources of biomass and food, bushlands are providers of critical ecological functions ranging from water quality protection, erosion barrier, windbreak and the trapping of nutrients. Their losses are a major downside in the context of ecosystem services in the South East region.
In a country where land has limitations in some areas, the implications of land cover losses from an ecological standpoint is that, their disappearance to competing use takes away valuable functions essential to ecological services, food production, and income earning potentials of people in affected areas. The same thing can also be said of the ensuing degradation from land and habitat disturbance in an era where governments at all levels are saddled by the growing dangers from habitat loss, the threats of climate change and the protection of fragile natural areas for biodiversity. The damage done to the ecosystem in such settings through the destruction of sensitive habitats accelerates the threats of soil and wind erosion and loss of green cover in a region already prone to transboundary land use conflicts and uncertainties of changing weather patterns. As a remedy, the study offered suggestions ranging from education, the involvement of local communities in land use, the need for efficient policies, conservation measures and the design of a regional land use spatial information system for Eastern Nigeria.
5. Conclusions
The paper revealed new insights on land use change in the study area under the following rubric: (a) Land cover types in abundance in the South East; (b) Land use/Land cover change visible; (c) Land degradation linked to many factors; (d) Mix scale model effective; (e) The impacts of land degradation notable. The details are described in the paragraphs below.
The South Eastern region contains extensive network of land cover types extending to multiplicity of states. The various land cover varieties specific to the zone encompasses those conducive for agriculture, bare soil, bushland, thick forests from the savannah to rain forest, as well as grass land in the northern zone, water and land form denoting urban corridors. While the use of and interactions involving some of these resources has economic prospects amidst mounting impacts on the environment. Seeing the hydrology and human settlement types in the zone, the enquiry captured the extent of water resource presence and urban areas denoting human activities all over the region. Since the nation’s commitment to global sustainable development agenda requires taking annual stock of changes in natural resources for efficient management. The assembling of data on the various land cover types is very vital in resource management and planning where knowledge of opening and
closing data on various periods is indispensable. In that way, this enquiry is quite on target in furnishing a rare inventory on the region’s natural resource stock for decision makers, the federal government and investors in the agricultural and urban development sectors, so that they can garner better insights on the region’s potentials with opportunities for conservation.
Between the stimulating inferences that emerged out of this study as shown from the analysis, the study area saw some visible changes in the size of land covers of different classes from agriculture to urban corridors in the form of declines or gains. Drawing from the comparisons and the info, aside from some increases that could be linked to conservation measures and sustainable land recovery programs adopted by farm operators over time, farmland area and bare soil grew alongside forest cover and urban corridor. Also, the area of bush land, grass land, and water areas crucial to biodiversity and animal refuge plummeted respectively. The patterns appear to have been evolving over the various periods and there is a spreading of that trend in the region’s natural resource inventory. Because the land cover changes from 2000-2017 reflects notable deficits for bush land and grass land and water areas. The risks involved coincided with the encroachment of new settlements onto localities prone to land degradation in the form of erosion. With the importance of various land cover types in the South East, the enquiry, therefore, did lay out a major path for tracking the shortfalls in sensitive habitats. From what is at stake, managers gain novel ways to weigh these changes by observing their impacts with focus on sustainable use. This should allow the states, and regions design effective schemes for reducing the dangers. In that way, the enquiry ushered in a risk monitoring component, that is essential in gauging land cover degradation threats in resource dependent areas undress stress.
The use of mix scale method as analytical tool in the study was quite effective. Applying descriptive statistics and GIS/Remote sensing as research tools showed better ways of assessing land degradation in the region. The model was quite efficient in defining the study area, spotting the emergent patterns, and during the collection and processing of information on various parameters. Aside from the gradual surge and deficits in some variables from 2000-2017 as shown by the analysis. There exists visible concentration in other land cover indicators like agricultural space on the northern axis coupled with large network of green cover areas on varying scales on the southerly corridor of the region over the years. With that came the spatial dispersion of land degradation in the form of erosion hazards across various states in the South East region. In so doing, GIS and remote sensing techniques as analytical and planning tools demonstrated their versatility and proficiency in pinpointing the dispersion of land cover parameters and the risks to communities across space. Detecting these patterns assists planners in putting sustainable use of critical land cover assets as essential components of future policy. This upside exemplifies a considerable phase towards effective planning that is yet to explore such capabilities. While this is vital in the design of land index, it strengthens the decision-making capacity among planners in influencing future directions and the management of land assets in Eastern Nigeria.
The study was effective in showing the threats faced in the natural and built environment as a result of land degradation emanating from change. Identifying the accumulated risks associated with ecosystem destruction and the displacement of people reaffirms the timeliness of the study. The impacts of land degradation at different scales is evident with the frequency of soil erosion, siltation and inundation hazards at the expense of communities and the natural ecology of the region at numerous sites. The extent of these threats is obvious in several localities where citizens agonize over gully erosion, river silting, displacement of villages and cities, devastation of properties and personal possessions in built up areas. While assessing these hazards provides mitigation opportunity against future occurrences in the areas at risk through rehabilitation. Indicating such dangers given the incapacity to anticipate their accumulated effects in the region remains a major step forward in this enquiry. Identifying such risks herein, not only elevates their urgency in mitigation, but it puts future recovery and reclamations of degraded areas on a much stronger footing than ever. Making citizens aware of these actualities gives them the opportunity to track areas at risk due to the dangers to their wellbeing.
Bearing in mind the vulnerability of the region’s ecosystem to stressors and the nature of liabilities from degradation and what emerged from this study. Decision makers in the region would be hard pressed in the years ahead to demand pressing answers to several relevant queries that are relevant to the protection of the environment. The queries consist of which potential risks are to emerge from future land use change in the South Eastern regional ecosystem? What will the scale of impacts be like? What
form will the spatial dimensions of the risks assume? Which additional factors will influence degradation in the region? From the framing of these queries, there are enough prospects through all these for the academic community and managers to refocus the strategy on land management through restoration and impact mitigation. This can be done by means of policy instruments built on command and control that underscore mitigation with efficient actions in the management process. The assumption is that this will ensure the protection of localities and the surrounding ecosystem from environmental hazards of land use change in future years.
Appendix - 1
3.7. Efforts (Contd.)
3.7.1. The Federal Mitigation Initiatives
Considering the extent of land degradation in the Southeast region, the Federal Government of Nigeria is implementing the multi-sectoral Nigeria Erosion and Watershed Management Project (NEWMAP). This is financed by the World Bank, Global Environment Facility, the Special Climate Change Fund, and the Government of Nigeria. With the gravity of the threats in the zone, the NEWMAP funded activities do require implementation by states and the Federal government. In that way, the project currently includes 7 states, namely Anambra, Abia, Cross River, Edo, Enugu, Abia, and Imo. Aside from the role of the Federal Ministry of Environment (FMENV), Department of Erosion, Flood and Coastal Zone Management as lead agency at the Federal level, both State and local governments and native communities are key stakeholders in the venture. This stems from the multi-sectoral nature of the program operations involving memorandum of understandings concerned with water resources management, public works, agriculture, regional planning, earth and natural resources information, and disaster risk management. Besides, the pathway of these objectives center on the recourse to ecological restoration [7].
3.7.2. The Activities at the State Level
surface. Considering the expected impacts of the planned intervention, it was deemed imperative to undertake a location explicit Environmental and Social Management Plan. This was geared at reducing any likely negative ecological and social impacts during the work and in the operating span of the activities [44].
3.7.3. The Guiding Policy Framework for Mitigation Based on the current hazards in the South East region, environmental policies as those guidelines governing the relationship between humans and the environment are crucial in terms of mitigation. From the emergent liabilities involving loss of assets and dislocation of citizens during degradation, regulatory frameworks in various sectors of Nigeria are mandated under existing laws at federal, state and local levels to ensure mitigation. Building on its commitments to addressing environmental issues in Nigeria, the Federal Government, through the Ministry of Environment has several policy instruments to mitigate the challenges. As part of its mandate, the Ministry has at its disposal, legal tools for achieving environmentally sound management of resources and sustainable development across all major sectors of the economy including land resources management with oversight on the fallouts from erosion. Accordingly, every state of the nation has an Environment Ministry tasked with ensuring safe and livable environment free from the menace of geo-hazards [43].
Acronyms
Acronym Meanings
S/N Site numbers
Avg Average
E Eroded
NE Non- Eroded
REFERENCES
[1] Ananda,. J. (2003). Soil Erosion In Developing Countries a Soil Economic Appraisal. Journal of Environmental Management. 68:4:343-353.
[2] Merem, E.C. (2006). The Applications of Geospatial Information Technology in Land Management: A Case Study of Lagos Nigeria. Proceedings of the Fifth GSDI-9 Conference, Santiago: Chile. 2006.
[3] Merem, E.C. (2006). Use of GIS and Remote Sensing Technology as Decision Support Tool in Land Administration: The case of Lagos Nigeria. Proceedings of the 5th International Federation of Surveyors Regional Conference for Africa, Accra: Ghana. 2006.
[4] Merem, E.C. (2006). Use of Remote Sensing Data to Detect Environmental Degradation in Coastal Region of Southern Nigeria. Proceedings of the International Society for Photogrammetry and Remote Sensing (ISPPRS), Mid Term
Symposium, Enschede: Netherlands. 2006.
[5] Nwaogu, C. (2017). Land Use-Land Cover Change and Soil-Gully Erosion Relationships: A Study of Nanka, South-Eastern Nigeria Using Geoinformatics. Proceedings of GIS Conference, Ostrava: Czech Republic. 2017.
[6] Ejiogu. A.O. (2009). Assessment of The Use of Vetiver Grass (Vetiveria zizanioides) In Sheet Erosion Management in Imo State. Proceedings of the Global Conference on Business and Economics (GCBE), Cambridge University: UK. October 2009.
[7] Imo State. (2016). Imo State Nigerian Erosion and Watershed Management Project (NEWMAP) Final Report Environmental and Social. Owerri, Imo State: IMONEWMAP.
[8] International Union for the Conservation of Nature and Natural Resources (IUCN). (2016). Regional Assessment on Ecosystem Disaster Risk Reduction and Biodiversity In West and Central Africa. OUAG, Burkina Faso: IUCN.
[9] Adegunde, A.A. (2006). Assessment of the Socio-economic Impacts of Soil Erosion in South Eastern Nigeria. Proceedings of 23rd FIG Congress. Munich: Germany. October 2006.
[10] Akande, W.G. (2014). Review of Gully Erosion in Nigeria: Causes, Impacts and Possible Solutions. Journal of Geosciences and Geomatics. 2:3:125-129.
[11] Igbokwe. J. I. (2008). Mapping and Monitoring of the Impact of Gully Erosion in South Eastern Nigeria with Satellite Remote Sensing and Geographic Information System. The International Archives of the Photogrammetry, Remote Sensing and Spatial Information Sciences. 37: B8: 865-871. [12] Merem, E. C. (2012). Tropical Landscape Change and the
Role of Agroforestry in Southern Nigeria. British Journal of the Environment and Climate Change. 2:3:285-319.
[13] Ofomata, G.E. (1985). Soil Erosion Southeastern Nigeria: the view of a Geomorphologist. Proceedings of Inaugural Lecture Series, University of Nigeria: Nsukka. 1985.
[14] Amangabara G.T. (2012). Analysis of Selected Failed Gully Erosion Control Works in Imo State. Hydrology for Disaster Management Special Publication of the Nigerian Association of Hydrological Sciences, 2012.
[15] Imo Agricultural Programme (ADP). (2006). Erosion Prone Areas in Imo state. Owerri, Imo State: Imo ADP.
[16] Chikwelu, E.E. (2014 July/August). Geotechnical Investigation of Soil around Mbaukwu Gully Erosion Sites, South-Eastern Part of Nigeria. Journal of Applied Geology and Geophysics. 2:4: 6-17.
[17] Okereke, C.N. (2012 May-June). Mapping Gully Erosion Using Remote Sensing Technique: A Case Study of Okigwe Area, Southeastern Nigeria. International Journal of Engineering Research and Applications. 2:3:1955-1967. [18] Umenweke, M.O. (2006). Termination of Gully Process,
Southern Nigeria. Proceedings of the Eighth Federal Interagency Sedimentation Conference, Reno, NV: USA. April 2006.
Review. 3:2.
[20] Merem, E.C. (2014). The Analysis of Coal mining Impact on West Virginia’s Environment. British Journal of Applied Science and Technology. 4:8:1171-1197.
[21] Merem, E.C. (2017). Assessing the Ecological Effects of Mining in West Africa: The Case of Nigeria. International Journal of Mining Engineering and Mineral Processing. 6:1: 1-19.
[22] Merem, E.C. (2016). Coupling GIS and Remote Sensing Techniques for Coastal Zone Disaster Management: The Case of Southern Mississippi. Geoenvironmental Disasters. 3:25. [23] Merem, E.C. (2008a). Using Spatial Information
Technologies as Monitoring Devices in International Watershed Conservation Along the Senegal River basin of West Africa. International Journal of Environmental Research and Public Health. 5:5:464-476.
[24] Merem, E.C. (2008b). Geospatial Information Systems Analysis of Regional Environmental Change Along the Savannah River Basin of Georgia. International Journal of Environmental Research and Public Health. 5:1: 281-294. [25] Merem, E.C. (2008c). Using geospatial information
technology in natural resources management: The Case of Urban Land Management in West Africa. Sensors. 8:607-619.
[26] Merem, E.C. (2017b). Techniques of Remote Sensing and GIS as Tools for Visualizing Impact of Climate Change-Induced Flood in the Southern African Region. American Journal of Climate Change. 6:306-327.
[27] Merem, E.C. (2007a). Using GIS and Remote Sensing in the Analysis of Ecosystem Decline Along the River Niger Basin: The case of Mali and Niger. International Journal of Environmental Health and Public Health. 4:2:278-289. [28] Merem, E.C. (2007b). GIS Applications in Global
Environmental Protection: The Case of Environmental Monitoring of Fossil Fuel Emission From Oil and Gas Activities in Africa. World Resources Review. 19:3: 657-680. [29] Brinkhoff, T. (2018). Population Statistics For Country.
Oldenburg, Lower Saxony: Germany. City Population. [30] Amadi, D.C. (2014). The Effects of Agulu -Nanka Erosion
On the Socio-Economic Life of Agulu and Nanka Communities of Anambra State. International Journal of Engineering Research and Development. 9: 12: 1-04. [31] Igwe, C. A. (1999). Land Use and Soil Conservation
Strategies for Potentially Highly Erodible Soils of Central Eastern Nigeria. Land Degradation Development. 10: 425-434.
[32] Ofomata, G.E. (1975). Soil Erosion Nigeria in Maps, Eastern States. Benin City, Nigeria: Ethiope Publishing House. [33] Ofomata, G.E. (1981). Actual and Potential Erosion in
Nigeria and Measures for Control. Soil Science Society of Nigeria Special Monograph. 1: 151-165.
[34] Igwe, C.A. (2012). Chapter 8 Gully Erosion in Southeastern Nigeria: Role of Soil Properties and Environmental Factors. Retrieved May 5th 2018 From http://cdn.intechopen.com/ pdfs/37913/InTech-Gully_erosion_in_southeastern_nigeria_ role_of_soil_properties_and_environmental_factors.pdf. [35] Njoku, L. (2016). Erosion Eating Up the South East. The
Guardian. 1-2.
[36] Vermote, E. F. (1997). Atmospheric Correction of Visible to Middle-Infrared EOS-MODIS Data Over Land Surfaces: Background, Operational Algorithm and Validation. Journal of Geophysical Research. 102:4: 17131-17141.
[37] Horning, N. (2010). Random Forests: An Algorithm For Image Classification and Generation of Continuous Fields Data sets. Proceedings of International Conference on Geoinformatics for Spatial Infrastructure Development in Earth and Allied Sciences, Hanoi: Vietnam. December 2010. [38] Harris, P.M. (1995). The Integration of Geographic Data
With Remotely Sensed Imagery to Improve Classification in an Urban Area. Photogrammetric Engineering and Remote Sensing. 61: 8: 993-998.
[39] Hardin, P.J. (2007). Mapping, Measuring, and Modeling Urban Growth. Heidelberg: Springer-Verlag. 141-176. [40] Hagler, B. (2007). Margala and Margala North Blocks:
Environmental Baseline Study. Final Report. Islamabad, Pakistan: MOL Pakistan Oil and Gas Company BV. [41] World Bank. (2010). Report on the Status of Disaster Risk
Reduction in Sub Sahara Africa. Washington, DC: The World Bank Group.
[42] World Bank. (2011). The Integrated Disaster and Land Management Project, Togo. Africa Water Resources Management (AFTWR). Washington, DC: The World Bank Group.
[43] Osumgborogwu, I.E. (2017). Environmental Laws in Nigeria and Occurrence of Some Geohazards: A Review of Asian Journal of Environment & Ecology. 2:4:1-12.