Present Position of Women Employment and Unemployment in Karnataka:
A Sociological Study
Kumara B.R
Lecturer, Department of Sociology, Mandya University, Mandya-571401.
1. INTRODUCTION :
Among the states, Karnataka has the second lowest unemployment rate, behind only Gujarat in nations.
Karnataka’s per capita income ranks fourth among the 10 states considered for the analysis.Women employment and unemployment is one of the main concepts of standard of living, economically, socially, politically, an improvement of
household’s development for women in India and Karnataka state. The increase in the number of women in the labour market signifies an important trend regarding women’s employment. This has been occurring alongside increases in labour force and workforce, especially for urban women, although rural women workers predominate in terms of
participation rates and overall magnitude. The increasing share of women’s participation in the labour force and its
significant contribution to household income as well as GDP require some policy attention be paid to the gender dimensions of employment.
2. OBJECTIVES OF THE STUDY :
To study the status of women employment and unemployment in India and Karnataka
To study the work participate rate for women in Karnataka
To examine the effects of women employment and unemployment in Karnataka
3. METHODOLOGY:
This study is mainly based on secondary sources of information data. The secondary data were collected from various sources like- Economic survey of India and Karnataka, Directorate of economics and statistics in Karnataka, Statistical profile on women labour bureau annual reports, Ministry and labour annual reports, Employment and unemployment situation in India annual reports, journals, news papers, and research articles etc.
4. Trends in Women Employment Scenario in India :
Women form an integral part of the Indian workforce. Employment is one of the essential for promote to improvement of households, politically, socially, economically empowerment in the country. As of 2011, the total number of women workers in India is about 149.8 million and women workers in rural and urban areas are about 121.8 and 28.0 million respectively. Out of total is about 149.8 million women workers, 35.9 million women are working as cultivators and another 61.5 million are agricultural labourers. Of the remaining women’s workers, 8.5 million are in household Industry and about 43.7 million are classified as other workers. The Work Participation Rate of Women has reduced marginally in 2011 but there is an improvement from 22.27 per cent in 1991 and 19.67 per cent in 1981. The work participation rate for women in rural areas is 30.02 per cent as compared to 15.44 per cent in the urban areas.
Women’s participation in the labor force accounted is about 57.2 per cent of the working age women population in 2013, compared to 69.7 per cent participation rate for men.
Abstract: The research article examines the recent position of women employment and unemployment in the State of Karnataka. Employment is one of the main concepts of standard of living, economically, socially, politically, an
improvement of household’s development for women in India as well as Karnataka state. Among the states,
Karnataka has the nation’s second lowest unemployment rate, behind only Gujarat. Karnataka’s per capita income
ranks fourth among the 10 states considered for the analysis. This study also focuses on women work participation rate in Karnataka. This study found that decreasing unemployment of women in rural areas and increasing unemployment rate in urban areas in Karnataka. The study concludes that women employment positive impact on empowering women, economic independence, improvement in social status, high standard of living of rural and urban areas.
Table- 1 Employment of Women Workers in Public and Private Sectors in India (In Thousand)
Year Employment
Public Sector AGR Private Sector AGR Total AGR
1992- 93 2428.7 - 1479.3 - 3908.0 -
1993- 94 2541.6 4.65 1578.8 6.73 4120.4 5.44 1994- 95 2564.6 0.90 1589.3 0.67 4153.9 0.81 1995- 96 2600.4 1.40 1627.5 2.40 4227.9 1.78 1996- 97 2634.5 1.31 1791.9 10.10 4426.4 4.70 1997- 98 2727.6 3.53 1909.4 6.56 4637.0 4.76 1998- 99 2762.7 1.29 2010.9 5.32 4773.6 2.95 1999- 00 2810.7 1.74 2018.4 0.37 4829.1 1.16 2000- 01 2857.0 1.65 2065.8 2.35 4922.8 1.94 2001- 02 2859.2 0.08 2090.1 1.18 4949.3 0.54 2002- 03 2886.7 0.96 2048.7 -1.98 4935.4 -0.28 2003- 04 2904.7 0.62 2063.7 0.73 4968.4 0.67 2004- 05 2890.0 -0.51 2044.4 -0.94 4934.4 -0.68 2005- 06 2921.0 1.07 2095.2 2.48 5016.2 1.66
2006-07 3002.8 2.80 2113.7 0.88 5116.5 2.00 2007- 08 3017.5 0.49 2294.42 8.55 5311.92 3.82 2008- 09 3039.98 0.74 2472.2 7.75 5512.18 3.77 2009- 10 3091.06 1.68 2488.79 0.67 5579.85 1.23 2010- 11 3196.04 3.40 2662.54 6.98 5858.58 5.00 2011- 12 3170.64 -0.79 2783.47 4.54 5954.11 1.63
ACGR 1.27 2.82 1.92
Source: Statistical Profile of Women Labour 2012- 13, GOI
Graph-1 Employment of Women Workers in Public and Private Sectors in India
Table-1 and Graph-1 depicts that employment of women workers in public and private sectors in India during the period from 1992- 93 to 2011-12. On the whole employment situation and annual growth rate of Indian women employment in recent year 2011- 13 is about Rs. 3170.64 thousandand overall annual compound growth rate increasing is about 1.27 per cent in public sector and private sector women employment rate increasing to year to year and compound growth rate also increasing, and also total women employment rate positive increasing in 2011.
y = 92.416x + 3936.4 R² = 0.9433
0 1000 2000 3000 4000 5000 6000 7000
5. Position of Women Unemployment in India :
The size of employment or unemployment in any country depends to a great extent on the level of development. Therefore, when a country makes progress and its production expands, the employment opportunities grow. In response to these developments the absolute level of employment has also grown. However, during the planning period, unemployment in absolute terms has increased. This has happened because during the first three decades of economic planning trend rate of growth was considerably lower than the targeted rate. Therefore, jobs in adequate number were not created. The unemployment rate at all India level stood at 3.8 per cent while in rural and urban areas it was 3.4 per cent and 5 per cent respectively. Unemployment rate is more in urban areas than in rural areas as in urban areas educated unemployed are more in numbers and also in urban areas it requires some vocational training or technical skill to do a job as compared to rural areas. Urban unemployment is that unemployment which exit in urban areas. It is not only painful at personal level but also at social level.
Table- 2 Position of Women Unemployment in India
Year Women Unemployment
Rural Urban
1993- 94 5.6 10.5
1990- 00 7.0 9.4
2004- 05 8.7 11.6
2009- 10 8.0 9.1
Source: Economic Survey of Karnataka 2012- 13 and 2014- 15
The above table- 2 shows that women unemployment in the country. In this table shows the women unemployment rural and urban areas. In overall table shows that decreasing trends of women unemployment in rural and areas in India.
6. Women Employment in Karnataka :
In Karnataka, achieving high rate of growth along with commensurate generation of productive and quality employment opportunities for the rising work force continues to be a major challenge for both the Central and the State Governments. Low growth in employment, prevalence of low productive and low quality employment especially in the unorganized sector and high unemployment rate among the women, youth and educated indicate that the expansion of productive, quality and decent employment has been the principal concern of the state government’s policy in recent years to reduce poverty and to make growth process more inclusive growth. In Karnataka, agriculture is the predominant source of livelihood for the majority of the women population and employment is largely unorganized, rural and nonindustrial in nature.
7. Work Force Participation Rate (WPR):
As of 2011, the Work Participation Rate (WPR) is defined as the proportion of total workers (i.e. main and marginal workers) to total population. In Karnataka, 2, 78, 72,597 persons constituting 45.62 per cent of the total population have enumerated themselves as workers. Among them, 1, 82, 70,116 are males and 96, 02,481 are females. In other words, 59 per cent of the total male population and 31.87 per cent of the total female population are workers. In 2001 Census the WPR in the State was 44.53 per cent comprising 56.64 per cent male workers and 31.98 per cent women workers. On the whole WPR in 2011 has increased in general irrespective of gender and more significantly in urban areas (4%) compared to 2001.
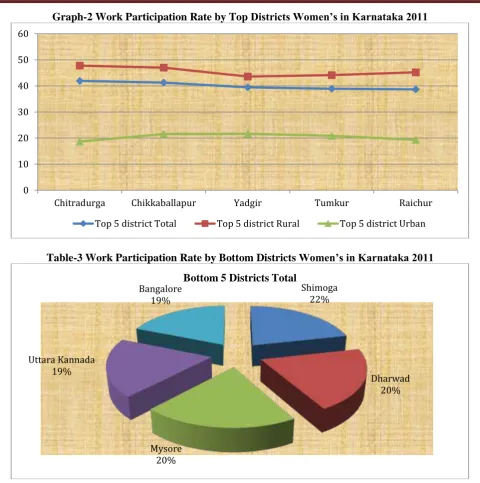
Table-3 Work Participation Rate by Districts Women’s in Karnataka 2011
Top 5 district Bottom 5 Districts
District Total Rural Urban District Total Rural Urban
Chitradurga 41.93 47.78 18.65 Shimoga 28.12 35.35 15.07 Chikkaballapur 41.27 46.99 21.55 Dharwad 26.5 40.35 16.19 Yadgir 39.48 43.6 21.63 Mysore 26.35 32.22 18.14 Tumkur 38.93 44.14 20.85 Uttara Kannada 25.03 29.37 14.52 Raichur 38.69 45.24 19.32 Bangalore 24.61 28.02 24.27
Graph-2 Work Participation Rate by Top Districts Women’s in Karnataka 2011
Table-3 Work Participation Rate by Bottom Districts Women’s in Karnataka 2011
This table and graphs indicates that WPR by districts women’s in Karnataka 2011. Overall table shows the top 5 and bottom 5 districts status of women’s participation rate of rural- urban areas in Karnataka 2011. Among the districts, Chitradurga with a WPR of 41.93 % occupies the top position, followed closely by Chikkaballapur, Yadgir, Tumkur and Raichur with WPR of more than 50%. The lowest WPR of 28.12 is recorded in Shimoga preceded closely by Dharwad, Mysore, Uttara Kannada and Bangalore with WPR between 24.61 to 26.5 per cent in the state.
Table-4 Trends ofAverage Women Daily Employment in Karnataka (In thousand)
Year Average of Women Daily Employment
2005- 06 176828
2006- 07 196174
2007- 08 200442
2008- 09 204386
2009- 10 197763
Source: Statistical Profile of Women Labour 2012- 13, GOI
0 10 20 30 40 50 60
Chitradurga Chikkaballapur Yadgir Tumkur Raichur
Top 5 district Total Top 5 district Rural Top 5 district Urban
Shimoga 22%
Dharwad 20%
Mysore 20% Uttara Kannada
19%
Bangalore 19%
This table-3 reveals that trends in average women daily employment in Karnataka during 2005-06 to 2009- 10. In the 2008- 09 is about 204386, highest average women daily employment in Karnataka and 176828 lowest average women daily employment in 2005- 06.
8. Unemployment Rate in Karnataka:
Unemployment is one of the important parameter of the labour force in the state. It is the ratio of number of unemployed persons/person- days to the number of persons/person-days in labour force. Three sets of estimates of unemployment rates are obtained based on the estimates of unemployment obtained by the three different approaches used for classification of the activity statuses of persons. The different estimates of unemployment namely, Number of persons usually unemployed based on ‘usual status’ approach; Number of persons unemployed on an average in a week, based on the current weekly status (CWS) approach; and Number of person-days unemployed on an average during the reference period of seven days preceding the date of survey, based on the current daily status (CDS) approach.
Table-5 Year- wise Women Unemployment in Karnataka
Year Women Unemployment
Rural Urban
1993- 94 3.9 8.9
1990- 00 4.0 5.9
2004- 05 7.2 9.4
2009- 10 4.1 6.0
Source: Economic Survey of Karnataka 2014- 15
This table indicates that women unemployment in Karnataka. In this table shows the women unemployment rural and urban areas. In overall table shows that decreasing trends women unemployment in rural areas in Karnataka. It is positive impact in women unemployment in rural areas. But, it is highest in urban women unemployment in Karnataka.
9. CONCLUSION:
Women employment not only bring social development but also economic empowerment and the women employment played a very an important in all over development in the country and state. An unemployment woman leads to exploitation of social status, economic status, and also leads to low respect in social community in the state.
REFERENCES:
1. Government of Karnataka (2018-19), Economic Survey of India, Planning, Monitoring Department Programme, Bengaluru.
2. Statistical Profile of Women Labour 2012- 13, GOI.
3. Directorate of economics and statistics in Karnataka, Annual Report Bangalore, 2013.
4. Directorate of economics and statistics in Karnataka , Annual Report Bangalore, 2009- 10 to 2014- 15.
5. Employment and Unemployment Situation in India 2010- 11, NSSO 66th Round Annual Report 2009- 10, GOI
6. Statistical Profile on Women Labour 2012- 13, Labour Bureau Ministry of Labour & Employment Government of India.